Contents lists available atScienceDirect
Limnologica
journal homepage:www.elsevier.com/locate/limno
Predicting the ecological status of rivers and streams under di
fferent
climatic and socioeconomic scenarios using Bayesian Belief Networks
Eugenio Molina-Navarro
a,b,*
, Pedro Segurado
c, Paulo Branco
c, Carina Almeida
d,
Hans E. Andersen
baDepartment of Geology, Geography and Environment, Faculty of Sciences, University of Alcalá. Ctra. Madrid-Barcelona Km. 33.6, 28805, Alcalá de Henares, Madrid,
Spain
bDepartment of Bioscience, Aarhus University, Vejlsøvej 25, 8600, Silkeborg, Denmark
cUniversidade de Lisboa, Instituto Superior de Agronomia, Centro de Estudos Florestais, Tapada da Ajuda, 1349-017 Lisboa, Portugal dUniversidade de Lisboa, Instituto Superior Técnico, MARETEC, Avenida Rovisco Pais, 1049-001 Lisboa, Portugal
A R T I C L E I N F O
Keywords:
Bayesian Belief Network Ecological Status Global change Rivers Scenarios Streams A B S T R A C T
Freshwater systems have increasingly been subjected to a multitude of human pressures and the re-establishment of their ecological integrity is currently a major worldwide challenge. Expected future climate and socio-economic changes will most probably further exacerbate such challenges. Modelling techniques may provide useful tools to help facing these demands, but their use is still limited within ecological quality assessment of water resources due to its technical complexity.
We developed a Bayesian Belief Network (BBN) framework for modelling the ecological quality of rivers and streams in two European river basins located in two distinct European climatic regions: the Odense Fjord basin (Denmark) and the Sorraia basin (Portugal). This method enabled us to integrate different data sources into a single framework to model the effect of multiple stressors on several biological indicators of river water quality and, subsequently, on their ecological status. The BBN provided a simple interactive user interface with which we simulated combined climate and socioeconomic changes scenarios to assess their impacts on river ecological status.
According to the resulting BBNs the scenarios demonstrated small impacts of climate and socioeconomic changes on the biological quality elements analysed. This yield afinal ecological status similar to the baseline in the Odense case, and slightly worse in Sorraia. Since the present situation already depicts a high percentage of rivers and streams with moderate or worse ecological status in both basins, this means that many of them would not fulfil the Water Framework Directive target in the future. Results also showed that macrophytes and fish indices were mainly responsible for a non-desirable overall ecological status in Odense and Sorraia, respectively. The approach followed in this study is novel, since BBN modelling is used for thefirst time for assessing the ecological status of rivers and streams under future scenarios, using an ensemble of biological quality elements. An important advantage of this tool is that it may easily be updated with new knowledge on the nature of relationships already established in the BBN or even by introducing new causal links. By encompassing two case studies of very different characteristics, these BBN may be more easily adapted as decision-making tools for water management of other river basins.
1. Introduction
Improving the ecological quality of freshwaters is one of the main environmental challenges. In Europe, waters are affected by an in-creasing number of pressures (e.g. water abstraction, morphological modifications and diffuse pollution). Climate change may pose an
additional threat to waterbodies augmenting the effect of pressures (Kristensen, 2012). The European Union (EU) has shown a strong de-termination to address this problem, and several policies such as the Nitrates Directive (The Council of the European Communities, 1991) and the Water Framework Directive (WFD) (European Parliament and Council, 2000) have been launched to guarantee the availability of
https://doi.org/10.1016/j.limno.2019.125742
Received 2 May 2019; Received in revised form 4 November 2019; Accepted 7 November 2019
⁎Corresponding author at: Department of Geology, Geography and Environment, Faculty of Sciences, University of Alcalá. Ctra. Madrid-Barcelona Km. 33.6, 28805, Alcalá de Henares, Madrid, Spain.
E-mail address:eugenio.molina@uah.es(E. Molina-Navarro).
Available online 30 November 2019
0075-9511/ © 2019 Elsevier GmbH. All rights reserved.
good quality water. Initially, the WFD committed all EU member states to achieve“good” ecological status in all surface waterbodies by 2015. Based on the information reported by Member States in thefirst River Basin Management Plans (reporting was due at the end of 2009), Kristensen (2012)demonstrated that 56% of rivers and 44% of lakes in the EU had less than good ecological status. Concurrently, Grizzetti et al. (2017)estimated that only 38% the rivers were in a good or high ecological status, using data compiled from these plans compiled by the European Environment Agency from 2004 to 2009. Additionally, en-vironmental monitoring shows that the situation has remained largely unchanged during the last years (Barton et al., 2016). Several authors have thus shown that many water bodies failed to achieve a good ecological status due to multiple stressors, which compromises the in-tegrity of water resources and ecosystems (Grizzetti et al., 2017;Hering et al., 2015;Schinegger et al., 2016). Although some progress has been made, agricultural diffuse pollution and hydromorphological pressures are still threats to many waterbodies (Grizzetti et al., 2017; Tsakiris, 2015). To better address these problems the EU has planned a revision of the WFD by 2019 and postponed the deadline to achieve the ecolo-gical status targets by 2027 to give more time to implement the revised WFD version (Hering et al., 2015). This allows for new measures to be discussed in the current river basin management plan cycle (2016–2021), which, in addition, has to consider the potential effects of climate change.
Modelling tools have become essential to assist water managers in the context of bioassessment programmes (Trolle et al., 2012). Em-pirical modelling is often applied to describe relationships between biotic metrics and stressors with the purpose offinding adequate in-dicators (Feld et al., 2016). On the other hand, process-based models are important to predict patterns resulting from well-known processes (most often abiotic indicators) (Arnold et al., 1998). Their ability to mechanistically describe and incorporate various ecological processes from different disciplines and their interdependencies, makes them particularly interesting to simulate multiple stressors under different environmental conditions. However, their use is limited within ecolo-gical quality assessments: i) they require advanced technical skills and large training effort, and thus are not always appealing to water man-agers (Kragt, 2009;Phan et al., 2016); ii) they usually require a large data input, especially for calibration, so their application is limited to sites with such data availability (Quian and Miltner, 2015); and iii) most process-based models do not include biological elements, which are required as biotic status indicators by the WFD (Moe et al., 2016). The incorporation of expert judgment is limited in the above-mentioned modelling approaches (Kragt, 2009; Phan et al., 2016). However, it may be useful in some situations, for instance when me-chanisms are not well known or when data are not sufficient to run empirical models. Consequently, in recent years, researchers have been working on developing simple but effective modelling approaches to integrate information from different sources (empirical, process-based, expert judgment) and nature (quantitative and qualitative). Among them, there has been a rising interest in the use of Bayesian Belief Networks (BBNs) as tools for ecological and water resources modelling (Barton et al., 2008;Kragt, 2009;Phan et al., 2016).
BBNs, which rely on Bayes’ theorem of probability theory to pro-pagate information, are acyclic graphical models representing re-lationships (links) among variables (nodes) using an underlying prob-abilistic structure in the form of conditional probability tables (CPTs) that link a given variable (defined in terms of different states) to one or more variables in the system. More information about Bayesian net-work theory can be found in Kragt (2009). BBNs are able to handle problems associated with high levels of uncertainty and complexity due to their data integration capability. This helps to overcome data lim-itations, and makes them useful for management purposes (Kragt, 2009; McDonald et al., 2015;Phan et al., 2016). Other advantages of BBNs for water quality modelling include a relatively simple graphical re-presentation, the explicit incorporation of uncertainties, the ability to
handle incomplete datasets, and the fact that they can be easily created, updated, modified and extended (Barton et al., 2008; Kragt, 2009; McDonald et al., 2015,2016). Furthermore, when compared to existing process-based models, BBN approaches allow to integrate biological elements in ecological status assessment (Moe et al., 2016). None-theless, BBNs have some caveats: the inability to model feedback loops, the need for discretising continuous variables, and their validation (Barton et al., 2008;McDonald et al., 2015;Quian and Miltner, 2015). Despite these disadvantages, BBN modelling may prove meaningful to a broad range of users within management of water resources due to the ability to integrate science and management goals as well as to easily communicate complex information, which might facilitate decision-making (Kragt, 2009;McDonald et al., 2015;Phan et al., 2016).
BBN applications for water resources management started in the late 1990s and since then many scientific studies involving this approach have been published. However, despite the continuing advances in BBNs research and development, their actual use remains limited, used mainly by aquatic ecologists and managers for the assessment of river and stream water quality (McDonald et al., 2015). In a systematic re-view discussing BBN applications in water resources management,Phan et al. (2016)found 111 peer-reviewed research papers on the topic the majority of which (42%) dealing with water quality management. Be-sides, the authors pointed out a lack of BBN studies on international scales and only a few explicitly designed to explore the potential im-pacts of climate change on water quality. Among them, Dyer et al. (2014) aimed to determine the effects of climate change and river regulation on water quality; Nojavan et al. (2014) modelled eu-trophication in an estuary under climatic and nutrient pollution man-agement scenarios; andCouture et al. (2018)andMoe et al. (2016) have assessed the combined effect of land use and climate changes on lake ecological status. To the best of our knowledge, BBN modelling has not yet been used to evaluate the impact of combined climate and so-cioeconomic scenarios on the ecological status of streams and rivers.
Our study aims at developing a BBN framework for stream and river water quality modelling (in the following referring to as river), taking as case studies two climatically different river basins that share com-monalities in the typology of stresses potentially interacting to affect their ecological quality: the Odense Fjord basin (Denmark) and the Sorraia basin (Portugal). Climate and socioeconomic changes are likely to interact with the stressors present at these basins with uncertain consequences (Kristensen, 2012). We believe that a BBN approach will be valuable for converting large datasets into a simple and fast prog-nostic tool for supporting river basin managers in decision making processes focused on river ecological status, providing a user-friendly graphical tool to assess the impact of climate and socioeconomic sce-narios on river ecological status.
To achieve these goals, we designed a BBN model for both basins based on their characteristics, main pressures and previous knowledge, following a Scenarios – Stressors – Indicators – Status approach. Different data sources (measured, modelled and expert knowledge) were integrated to simulate the effect of multiple stressors on the eco-logical status of rivers, using several indices to provide a complete status assessment. Within the BBN, we integrated several modelling tools (process-based and empirical), achieving a more holistic outcome (Phan et al., 2016). Subsequently, we simulated climate and socio-economic scenarios demonstrating their impact on river water quality, specifically on its ecological status.
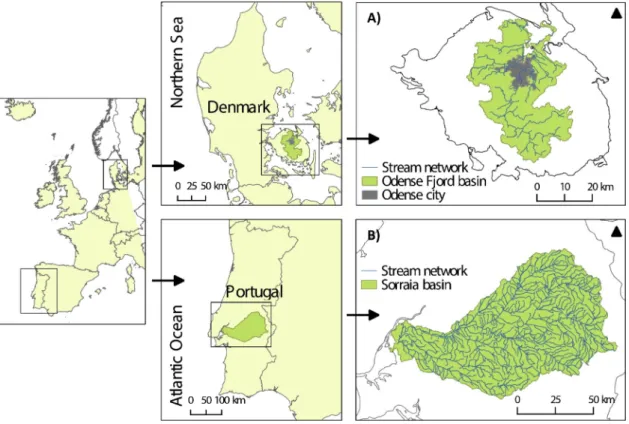
2. Methods 2.1. Case-study areas 2.1.1. Odense Fjord basin
The Odense Fjord basin is located in the island of Funen (Denmark), with an area of approximately 1100 km2 (Fig. 1A). The climate is oceanic with an annual mean temperature of 8.7 °C (2000–2010), with
monthly mean temperatures ranging from 1 °C in January and 17 °C in July. Mean annual precipitation is 812 mm (2000–2010), with no pronounced seasonality. Agriculture is the main land use (68%), fol-lowed by urban areas (16%) and forest (10%). The main city in the basin is Odense with 187,000 inhabitants. Aquatic ecosystems in the basin include lakes, rivers and transitional waters. In spite of several action plans, many of these waters fail to meet the Water Framework Directive targets, having 58% of the streams (km) and 82% of the lakes (larger than 5 ha) a moderate or worse status (Table 1, data for streams have to be seen with caution because for most of the streams only one biotic indicator was considered). Water quality in the basin is condi-tioned by urbanization, hydro-morphological modifications (including channelization and tile draining in about half of the agricultural area), occasional summer droughts and groundwater abstraction drying out headwater streams, and fertilizers and pesticides from agriculture. More details on the study area characteristics can be found inThodsen et al. (2015)andMolina-Navarro et al. (2018).
2.1.2. Sorraia basin
The Sorraia basin occupies an area of 7730 km² in Central Portugal andflows along a length of 155 km (Fig. 1B). It merges with the river Tagus at the estuary and is the Tagus tributary with the largest basin area. The climate is Mediterranean with an average annual air tem-perature of 15.2 °C that ranges from 21.6 °C in the summer to 9.4 °C in
the winter. The mean annual precipitation is around 600 mm, ranging from 25 mm in summer months to 70 mm in winter months. Approxi-mately 41% of the basin area of the Sorraia is forest, 28% range-grasses, 17% agriculture, 9% pine, 2% orchard, 2% urban and industrial and 1% pasture (Mateus et al., 2009). It includes one of the largest area of ir-rigated crops in Portugal, with a total area of 15,500 ha. The presence of two large reservoirs in the basin affects flow patterns and runoff downstream. Additionally, the naturalflow is substantially reduced by water abstraction for irrigation. The Sorraia watershed has a total of 153,000 habitants (INE, 2011) with a density of 20 hab/km2, mainly concentrated in three core areas: Ponte de Sôr, Samora Correia and Coruche. It has only minor issues regarding urban pollution and urban wastes. Among 122 water bodies (essentially rivers), the ecological status in 24% of them is moderate or worse (Table 1). The main cause of poor or failing status in the basin is the water abstraction for agri-cultural purposes. On average, 16,500 ha are irrigated with a total water volume of 120·103 m3per year. Water abstraction for irrigation in the Sorraia basin is the highest within the Tagus River basin region (26% of total need). Nutrient loads from agriculture, livestock and urban origin, mainly in the alluvial valley, are also important potential causes of poor status in the basin.
Fig. 1. Location of the (A) Odense Fjord and (B) Sorraia basins and their river networks.
Table 1
Ecological status reported in the Odense Fjord (Miljø- og Fødevareministeriet, 2017) and in the Sorraia basins (APA, 2012) (H: High, G: Good, M: Moderate, P: Poor, B: Bad, U: Unclassified).
Ecological status (num. and % of water bodies)
H G M P B U
Odense basin (streamsa) 40 (7%) 173 (29%) 210 (35%) 104 (17%) 35 (6%) 38 (8%)
Odense basin (lakes) 0 (0%) 2 (12%) 3 (18%) 5 (29%) 6 (35%) 1 (6%)
Sorraia basin 0 (0%) 54 (44%) 15 (12%) 12 (10%) 2 (2%) 39 (32%)
2.2. Data sources and pre-processing
Data used to feed the BBN came from both process-based models and from national biomonitoring programmes, collected in the context of the implementation of the Water Framework Directive. To simulate stressors related to hydrology and nutrients, process-based catchment models already implemented with the Soil and Water Assessment Tool (SWAT;Neitsch et al., 2005) were used (for further details seeAlmeida et al., 2018;Molina-Navarro et al., 2017,2018;Segurado et al., 2018). Additionally, SWAT was also employed to simulate stressors under different future climatic and socio-economic scenarios.Other stressors in the Sorraia case included land use, which was derived from the CORINE landcover database (European Environmental Agency, 2010) as the percentage area in the whole upstream catchment; river slope, derived from the CCM2 river network database (Vogt et al., 2007); and mean annual temperature, derived from the same climatic models used in the scenario settings (see next section).
Empirical or statistical models (Feld et al., 2016) were used prior to this study to identify and quantify the statistical relationships between the stressors and the biotic indicators. Empirical models developed for the Odense Fjord case study used data from a national Danish streams dataset, which contains measured data from 131 streams (Ferreira et al., 2016). For the Sorraia River case study, to encompass a broader environmental gradient, the empirical modelling was based on a data-base for the whole Portuguese Tagus basin comprising 240 records from the Water Frame Directive biomonitoring program (Portuguese En-vironmental Agency, APA), corresponding to 141 sampling sites with two sampling occasions for most sites (2010-11) (Segurado et al., 2018). Results obtained with both process-based and empirical models assisted in the construction of the BBNs, as described in section2.4. 2.3. Scenarios settings
In both study cases, scenarios were developed under the socio-economic storylines adopted in the MARS Project (www.mars-project. eu). The storylines adopted were the following (Faneca Sanchez et al., 2015): (1) a“Techno World” (TW) that represents a rapid global eco-nomic growth, enabling technological development but with high en-ergy demands and no real drive to specifically enhance or ignore nat-ural ecosystem health; (2) a“Consensus World” (CW) representing a world where current policies continue after 2020, economy growing at the same pace as now, with awareness for environment preservation; (3) a “Fragmented World” (FW) world represents “survival of the fit-test” world driven by countries own interests, with fast economic growth in NW Europe but decrease in other regions, with minimal or no investment and effort in environmental protection, conservation and restoration.
Storylines were incorporated in SWAT to run the future climatic and socio-economic scenarios. First, they were downscaled for each basin by applying expert judgement while taking into account their specificities in terms of dominant land use and socio-economic contexts (Table 2). In the Odense basin, downscaling was focused on farming, since agri-culture is the dominant land use (68% of the area). In the Sorraia basin, minor changes in urban areas were also considered. More information on the storylines’ downscaling regarding land use and socio-economy and how it was applied within the SWAT model can be found in Almeida et al. (2018) and Molina-Navarro et al. (2018). Regarding climate, different Representative Concentration Pathways (RCPs) were assigned to each storyline: the RCP 8.5 (rising scenario with very high greenhouse gas emissions) was assigned to storylines TW and FW, since both consider fast growing economies and fossil-fuelled development; and the RCP 4.5 (stabilization emission scenario) was assigned to the storyline CW, which considers regulations to save energy in favour of reducing emissions (Faneca Sanchez et al., 2015).
Climate scenarios produced by the ISI-MIP project (www.isi-mip. org) were applied in this study, namely the IPSL-CM5A-LR model in the
Odense study and the GFDL-ESM2M model in the Sorraia case-study, considering both the RCP 8.5 and RCP 4.5 emission scenarios. These models were selected because they yielded the best median output regarding cumulative precipitation relative to observations in each study area (MARS internal document “Choice of the Climatic Model for MARS case studies”, unpublished). The future time horizons for scenarios simulations were 2030 (interval 2025–2034) and 2060 (2055–2064) (Faneca Sanchez et al., 2015). Baseline scenarios were produced for the period 2011–2020 using the same climatic models to allow a comparison among the different time periods. ISI-MIP climate data at a 0.5° resolution was downloaded for the grid points closest to each basin and bias-corrected with measured data (temperature and precipitation in both study areas, and additionally solar radiation, hu-midity and wind speed in the Odense basin). Then, data was used as input in SWAT to run the scenarios previously described (Table 2). More details can be found inAlmeida et al. (2018)andMolina-Navarro et al. (2018).
Besides the abovementioned future time horizons and baseline period, additional scenarios were run with recorded climatic variables for the period 2001–2010 (OBS) to account for the isolated effects of land use changes (LUC), including a fourth baseline scenario with present land use (PLU). For the Sorraia basin we only considered the changes set for 2060 time horizon.
2.4. Construction of the Bayesian belief network 2.4.1. Structure of the model
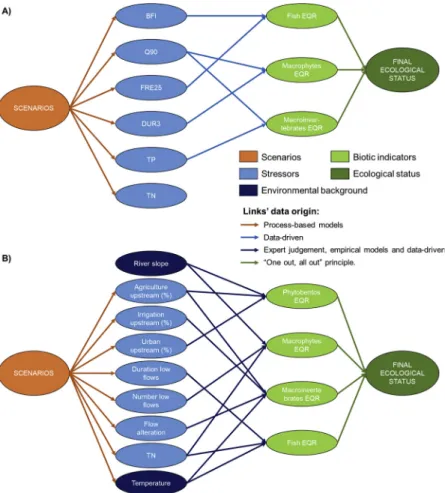
The BBN models were based in a multiple stress cause-effect fra-mework, evaluating the impacts of land use, agricultural management and climate change on both physical and chemical variables. These variables acted in turn as stressors for the biological variables that in-dicate the ecological status of the rivers in the basins, expressed by biotic quality indices following the EU Water Framework Directive criteria (WFD - European Parliament and Council, 2000). The BBN models comprisedfive main components, from parent to child nodes: (1) climate change scenarios and socio-economic storylines, (2) stres-sors (modelled data) or proxies (land use), (3) natural environmental background (measured data, only for Sorraia basin), (4) biotic in-dicators (measured data) and (5) biotic state (model output) (Fig. 2). The BBN models were designed with the software GeNIe, created by BayesFusion and freely available for academic and scientific use (bayesfusion.com/genie,BayesFusion LLC, 2019).
In both case studies, stressors related with the hydrological regime and nutrient loads were considered as the most relevant to be included in the BBN model. For the Odense Fjord basin case study, four hydro-logical and two nutrient stressors were included, while for the Sorraia basin case study, three hydrological and one nutrient stressors were considered (Table 3, Fig. 2). All hydrological and nutrient stressor variables were derived from SWAT simulations for each scenario at the sub-basin level. Output variables such as totalflow, groundwater flow or nutrient concentrations at a daily time-step were extracted from the reach outputfile (output.rch) and the stressors were calculated as de-scribed inTable 3. Hydrological stressors were mainly descriptors of low or highflow events, although each case study used different metrics because of inherent river basin specificities. In the BBN model for the Sorraia basin, given an overall stronger environmental gradient in comparison to the Odense Fjord basin, there was the need to consider the variability in the data induced by land use, climate and hydro-morphology. Therefore, three land use variables, temperature and river slope were also included in the BBN model (see Section2.2for data sources). Values of these stressors for future scenarios were obtained as described inTable 2, except for river slope which does not change in future storylines. Indeed, in the Sorraia basin, land use variables were previously shown to have a strong effect on biotic quality, probably acting as proxies of several interacting individual stressors (Segurado et al., 2018). In the Odense Fjord basin case, total nitrogen
concentration was included as an output node even though it was not identified as a significant stressor for predicting biotic status in the Odense Fjord basin. Thus, it is not linked with the indicators level in the BBN model, but we consider it relevant since it might serve as a che-mical water quality proxy.
Regarding indicators, biotic quality status indices were included and expressed as Ecological Quality Ratios (EQR, observed index divided by its value in reference conditions) and then translated into ecological status classes (bad, poor, moderate, good or high), following the WFD. Each EQR was represented by a node in the BBNs. For Odense Fjord basin, the DFFV for fish (Danish Fish Index for Streams; Kristensen et al., 2014), DVPI for macrophytes (Danish Stream Plants Index;Larsen and Baattrup-Pedersen, 2015), and DVFI for macroinvertebrates (Danish Stream Fauna Index;Larsen et al., 2014) were the indices se-lected; whereas for Sorraia river basin the indices were: IPS for phy-tobenthos (Indice de Polluosensibilité Sécifique;Almeida et al., 2014; Cemagref, 1982), IBMR for macrophytes (Macrophyte Biological Index for Rivers; Aguiar et al., 2014; Haury et al., 2006), IPtI for macro-invertebrates (Rivers Biological Quality Assessment Method - Benthic Invertebrates;Feio et al., 2014;Ferreira et al., 2008) and F-IBIP forfish (Fish Index of Biotic Integrity for Portugal; INAG and AFN, 2012; Segurado et al., 2014). A final node combining the ecological status classes given by the biotic quality indicators, following the“one out all out” principle established in the EU Water Framework Directive (Van de Bund and Solimini, 2007), closed the network. Using this principle, the final overall ecological status class is assigned according to the poorest ecological status class among the different biotic quality in-dicators. The link structure between stressors/land use/environmental background nodes and biotic indicator nodes were defined essentially according to the relationships found in the corresponding empirical models (Ferreira et al., 2016;Segurado et al., 2018). A node with all scenarios used to run SWAT was used as the parent node of each stressor and as the parent node for the climatic scenarios node and the storylines node (Fig. 2).
2.4.2. Class boundary definition
Once the structure of the network was designed, the variables re-presented in network nodes needed to be discretized. Three levels, “Low”, “Medium” and “High”, were defined for every stressor (Appendix A, Table S1). The absolute boundaries (lower boundary for “Low” and higher boundary for “High”) were determined taking into account the whole dataset for each basin. In this way, the boundaries represent a whole range of field conditions that can determine the subsequent indicator values (conditional probabilities between stressors and indicators are also obtained from the national dataset, due to lack of observed data in the Odense basin, as explained later). Then, the discretization into three clases was done using the“Uniform counts” tool in GeNIe, which creates three classes with the same number of cases each. In the case of the Sorraia Basin the class borders were fur-ther adjusted towards the inflection points of EQR partial response curves derived from the empirical models. The class boundaries of biotic indicators were based on the official quality boundaries of the biotic quality indices (Aguiar et al., 2014;Almeida et al., 2014;Feio et al., 2014;Kristensen et al., 2014; Larsen et al., 2014; Larsen and Baattrup-Pedersen, 2015; Segurado et al., 2014) between the“poor” and“moderate” classes and between this and the “good” class. We therefore considered three classes:“Poor/Bad” (PB), “Moderate” (M) and“High/Good” (HG). The same classification was adopted for the overall biotic status classification in the final node.
2.4.3. Conditional probability tables
Conditional probability tables (CPT) define the links or de-pendencies of each child node to parent nodes. The CPT linking sce-narios to stressors were based directly on the outputs from SWAT si-mulations. The correspondence between each biotic quality indicator (EQR) classes and the overall biotic status classes was also determi-nistic, based on the“one out all out” principle. In the Odense case-study conditional probabilities linking stressors with biotic indices were de-rived from the national Danish streams dataset (see 2.2). Denmark as a Table 2
Future scenarios considered in the Bayesian Belief Network models and downscaling of storylines for the two case studies. For land use, the values correspond to the predicted percentage of the total basin area. For the remaining parameters, the percentage change is shown (except temperature in °C change) (PLU: Present Land Use, TW: Techno World, CW: Consensus World, FW: Fragmented World, RCP: Representative Concentration Pathway, IPSL: IPSL-CM5A-LR climate model, GFDL: GFDL-ESM2M climate model).
Scenarios Baseline (PLU) TW 2030 TW 2060 CW 2030 CW 2060 FW 2030 FW 2060
a) Both basins
Emission scenarios RCP4.5 RCP8.5 RCP8.5 RCP8.5 RCP4.5 RCP4.5 RCP8.5 RCP8.5 Years 2011–2020 2026–2035 2056–2065 2026–2035 2056–2065 2026–2035 2056–2065 b) Odense Fjord basin
Climatic Model IPSL IPSL IPSL IPSL IPSL IPSL IPSL
Precipitation – +5.6% +13.2% +0.6% +1.9% +5.6% +13.2% Temperature – +1.0 °C +2.7 °C +0.8 °C +1.6 °C +1.0 °C +2.7 °C Animal manurea – −0.2% −0.2% −0.5% −0.5% +15.0% +15.0% Artificial fertilizera – −3.7% −3.7% −3.5% −3.5% +44.0% +44.0% Pig farms 44% 35% 35% 29% 29% 52% 52% Cattle farmsb 15% 12% 12% 11% 11% 15% 15% Mixed farms 15% 11% 11% 9% 9% 15% 15% Permanent grass 2% 5% 5% 15% 15% 2% 2% Forest 10% 10% 10% 21% 21% 2% 2% Willow – 13% 13% – – – – c) Sorraia basin Climatic Model GFDL GFDL GFDL GFDL GFDL GFDL GFDL Precipitation −39% −42% −37% −43% −39% −42% Temperature +0.8 °C +1.0 °C −0.9 °C +0.3 °C +0.8 °C +1.0 °C Fertilization – +10% +15% −10% −15% +30% +35% Irrigation – −10% −15% −20% −25% +30% +35% Agriculture 33.62% 37.9% 41.4% 29.6% 25.60% 39.9% 41.4% Irrigated crops 4.26% 5.1% 5.9% 3.7 % 3.0% 5.1% 5.9% Urban areas 0.51% 0.51% 0.52% 0.50% 0.49% 0.51% 0.52% a
Changes applied in manure and fertilizer application rates for Odense are averages weighted by farm type area. More details can be found atMolina-Navarro et al. (2018).
b Total surface of cattle farms does not change in the FW storyline in Odense, but the surface of cattle farms with low fertilization decreases, while the surface of those with high fertilization increases (seeMolina-Navarro et al. (2018)for further details).
whole is a lowland country (Windolf et al., 2011), hence with a rela-tively narrow environmental gradient, so the use of a national dataset might represent no concern in this sense. For the macrophytes index, two stressor-indicator classes combinations had no data available (low DUR3 -Annual duration of extremeflow events three times above the flow at Q50- and low Q90 -flow below the 90thpercentile* of the flow-duration curve divided by median flow (Q50)-; high DUR3 and high Q90). Probabilities of the closest neighbour combination were assigned in these cases, followingMoe et al. (2016). The ecological status classes
had a 1:1 correspondence with the indicator classes. In the Sorraia case-study the construction of the conditional probability tables linking stressors, land use and environmental background to biotic indicators were based on an expert judgement partially informed by the effect sizes and partial responses given by empirical models. The parameters were then learned with biomonitoring data from the year 2010. All the CPTs are available in Appendix A, Tables S2-S4.
Fig. 2. Bayesian Belief Network scheme for the Odense Fjord basin (A) and the Sorraia Basin (B) (EQR: Ecological Quality Ratio, for other acronyms please see Table 3).
Table 3
Variables selected in the Bayesian Belief Network modelling for (a) the Odense Fjord basin and (b) the Sorraia basin, and (c) both basins.
Stressor/variable Description
a) Odense Fjord basin
BFI Baseflow index, defined as baseflow volume divided by total volume
Q90 Flow below the 90thpercentileaof theflow-duration curve divided by median flow (Q
50)
FRE25 Annual frequency offlow events above the 25thpercentile of theflow-duration curveb
DUR3 Annual duration of extremeflow events three times above the flow at Q50(days)
TP Annual mean concentration of total phosphorus (mg/L) b) Sorraia basin
AGRIC % area of agriculture in the upstream basin IRRIG % area of irrigated crops in the upstream basin URBAN % area of urban areas in the upstream basin
LFLOWD Mean annual duration of lowflow events - periods during which the daily mean flow falls below the 10th percentile of the mean annual discharge (days) LFLOWN Mean annual frequency of lowflow events (number of events)
FLOWA % of change inflow in relation to the free running river (no barriers) SLOPE River slope (%)
TEMP Mean annual temperature (ºC) c) Both basins
TN Annual mean concentration of total nitrogen (mg/L)
a 90th percentile = theflow value that is exceeded 90 % of the time, i.e. a low flow indicator. b 25th percentile = theflow value that is exceeded 25 % of the time, i.e. a high flow indicator.
2.4.4. Model validation
Probability predictions of stressors from scenarios rely on process-based SWAT models that were already calibrated and validated (Ferreira et al., 2016; Molina-Navarro et al., 2017; Segurado et al., 2018). Similarly, the choice of which stressors are influencing each indicator was based on their statistically significance within empirical models (Ferreira et al., 2016;Segurado et al., 2018). However, these empirical models included more stressors than the BBNs, which are more simplistic, so an additional validation of BBN probability results is desirable. Data-driven validation was done in both study cases, but different approaches were followed due to different availability of in-dependent real data to validate with.
In the Odense Fjord basin, real data for validation was available from the latest Odense Fjord basin management plans, but only as ecological status classes in the rivers, not EQR values. The first basin plan only provides ecological status for macroinvertebrates (Miljøministeriet, 2011), while the second one provides classes for the three Biotic Quality Elements (BQE; Miljø- og Fødevareministeriet, 2016, 2017). The BBN was validated comparing the probability dis-tribution for ecological status classes calculated by the BBN for the present land use (PLU) scenario run with observed (2001–2010) climate data (PLU_OBS) with the data published in those management plans.
In the Sorraia basin case study, however, measured data for the year 2011, not used in the BBN construction, were available for both stres-sors and BQE´s and EQRs. Data driven validation was performed by using 2011 data to construct new CPTs for the stressors nodes and predict class probabilities of the EQR for each BQE and thefinal biotic quality. These predictions were then compared with real EQR classes and resulting biotic quality from the 2011 biomonitoring data. 2.5. BBN modelling
The BBNs allowed to model the resulting class probability dis-tributions for the overall biotic status and for each BQE for each sce-nario byfirst setting the corresponding evidence in the scenarios node and updating the beliefs. First, the effects of isolated LUC were eval-uated comparing the present land use scenario (PLU_OBS) with the three storylines (techno world LUC, consensus world LUC and frag-mented world LUC), all of them ran with observed climate (2001–2010). Running these scenarios allows addressing the next step, modelling combined land use and climate change scenarios, and guar-antees an appropriate discussion of the future storylines results, since when analysing combined climate and LUC scenarios, the signals of the first are often masked by the effects of the second (Dyer et al., 2014). Then, in both case studies, the effects of future storylines were analyzed comparing the probabilities obtained in the scenarios with their re-spective baselines. For both case studies, the response of biotic in-dicators were modelled for the years 2030 and 2060 under different combinations of climate scenarios and storylines, comparing the prob-abilities obtained for each scenario with their respective baselines. Additionally, BBNs were kept as simple as possible to present the sim-plest form (Marcot, 2012;McDonald et al., 2015) as a large number of model nodes does not necessarily guarantee a lower uncertainty (Barton et al., 2008). Marcot et al. (2006) recommend keeping the number of parent nodes to three or fewer to limit the size of the CPTs. 3. Results
3.1. BBNs validation
Figs. 3 and 4show the validation results for Odense and Sorraia cases, respectively. For both case studies, BBN predictions tend to un-derestimate the High/Good class probability and overestimate the Poor/Bad in most cases. The exception in both case studies is an un-derestimation of the Poor/Bad class in the case of thefish indices.
3.2. BBN modelling: Scenario´s simulation results 3.2.1. Isolated land use change (LUC) scenarios
The probability distributions of different biotic status across LUC scenarios were very similar in both basins, showing very subtle varia-tions (Figs. 5 and 6). In the Odense basin, the macrophyte index showed slight differences: the probability of Poor/Bad status decreased in the techno world LUC scenario, increasing the probabilities of Moderate and High/Good status. Changes in other scenarios, however, were minor (Fig. 5a). For the macroinvertebrate index, probability distribu-tions across scenarios were similar (Fig. 5b). Regarding thefish index, the biotic status slightly moved towards the extreme classes in techno world LUC (mainly towards High/Good) and in consensus world LUC (mainly towards Poor/Bad), while it moved to the moderate status in fragmented world LUC (Fig. 5c). Probability distributions for thefinal ecological status classes remained very similar across scenarios (Fig. 5d).
Regarding stressors, isolated LUC scenarios showed a very notice-able impact on TN (Annual mean concentration of total nitrogen (mg/ L)) probability distribution. Probabilities of low and, especially, medium TN levels increased in techno world LUC and consensus world LUC, decreasing drastically the probability of high TN (Appendix A, Figure S1-A). The opposite trend was observed in fragmented world LUC, in which high TN probability became 100%.
In the Sorraia basin, except for macrophytes, BBN projections showed an increase of Poor/Bad class probability and a decrease of High/Good status classes for the techno world LUC and the fragmented world LUC scenarios (Fig. 6a, c and d). In the case of macrophytes, a very slight decrease of Poor/Bad class probability and increase of the High/Good status classes for the techno world LUC and the fragmented world LUC scenarios was predicted (Fig. 6b). For all ecological quality indices, there was a slight decrease of the Poor/Bad and a slight in-crease of the High/Good status classes for the consensus world LUC scenario. The variation of thefinal ecologic status followed the same overall trend as most indices of each biotic quality element (Fig. 6e).
Regarding stressor predictions in the Sorraia basin, isolated LUC scenarios showed noticeable impacts on Total N and on the mean an-nual duration and number of extreme lowflow events. Probabilities slightly shifted towards high class for the techno world LUC and the fragmented world LUC scenarios and markedly shifted towards low TN for the consensus world LUC scenario (Appendix A, Fig. S1-B). Marked increase of the intermediate probability class and decrease of mean annual duration of extreme low flow events were predicted for the techno world LUC and the fragmented world LUC scenarios. An in-crease of the low probability class of mean annual number of extreme lowflow events was found for the three land use change scenarios, in an increasing order from the techno world LUC scenario to the fragmented world scenario (Appendix A, Fig. S1-B).
3.3. MARS storylines
Similarly to isolated LUC scenarios, the probability distributions of biotic status classes for the different scenarios remained quite stable across MARS storylines for most of the indices in both study areas. The most noticeable differences in class probabilities were observed in the macrophyte index for the Odense basin and in thefish and overall in-dices for the Sorraia basin (Figs. 7 and 8).
In the Odense Fjord basin, probability variations in the macrophyte index were especially relevant for the 2060 horizon (Fig. 7a). In techno world and fragmented world scenarios, High/Good status probability increased, while probabilities of Moderate and Poor/Bad status de-creased, and vice-versa for consensus world (M remained stable). The effects of scenarios observed for the Danish macroinvertebrate index probabilities were neglectable (Fig. 7b), while the general trend for the fish index in the future storylines was an increase of probability of High/Good status and a decrease of Moderate status (Fig. 7c).
Probabilities of final ecological status classes (Fig. 7d) barely changed for the short term (2030). For the 2060 horizon, however, Poor/Bad status probability decreased for techno world and fragmented world (−6.1% and −4.3%, respectively), increasing slightly both Moderate and High/Good status probabilities. Conversely, for the consensus world scenario, Poor/Bad status probability increases (+8.2%), while Moderate probability decreases (−7.4%). Despite these slight variations, the BBN predicted that the ecological status of rivers in the Odense Fjord basin would remain mostly Poor/Bad in the future (% of Poor/Bad probability varies between 56.7% and 69.2%, Fig. 7d).
As for isolated LUC scenarios, TN was the process-modelling derived stressor showing greater variations in its probability distribution after BBN modelling, decreasing high TN probabilities in techno world and consensus world and increasing in fragmented world (Fig. S2-A of Appendix A).
In the Sorraia basin, the projections under scenarios for the 2030 and 2060 horizons also resulted in subtle, although consistent, trends of class probabilities among each BQE and the overall biotic status (Fig. 8). For thefish index, Poor/Bad class increased and Moderate and High/Good classes decreased in all the storylines. Fragmented world
and techno world storylines, however, resulted in the highest increase and decrease of, respectively, Poor/Bad and High/Good status prob-ability, and this trend was overall slightly more marked in the projec-tion for the 2060 horizon. In the cases of phytobenthos and macro-invertebrates indices, a slight increase of High/Good and a decrease in Poor/Bad was projected for the consensus world in the future time horizons, in relation to the respective baseline (PLU_4.5). On the con-trary, for the remaining BQE, an increase of Poor/Bad was projected for the consensus world in both future time horizons.
The class probabilities projections for the final ecologic status showed a clear increase and decrease of, respectively, Poor/Bad and Moderate status probability for all storylines. For the 2030 horizon, the Poor/Bad status probability increased 20.8% for techno world, 14.8% for consensus world and 23.3% for fragmented world; the Moderate status probability decreased 18.6% for techno world, 13.3% for con-sensus world and 21.0% for fragmented world. For the 2060 horizon, the Poor/Bad status probability increased 24.3% for techno world, 14.8% for consensus world and 25.2% for fragmented world; the Moderate status probability decreased 21.8% for techno world, 13.4% for consensus world and 22.6% for fragmented world.
Regarding stressors, TN and low flow duration were the most Fig. 3. Modelled (Bayesian Belief Network, BBN) and observed (BMP, Basin Management Plan) probability distribution of biotic status classes (PB: Poor/Bad, M: Moderate, HG: High/Good) in the Odense Fjord basin for macrophytes (Mphy., a), macroinvertebrates (Minv., b) andfish (c) indices, and percentage of river length without information for the observed data (d) (I.=index). 1 Data from the first Odense Basin Management Plan (2010-15, includes data from 2003-10, Miljøministeriet, 2011).2Data from thefirst Odense Basin Management Plan updated in 2013 (median from January 2008, GIS corrected for the SWAT delineated basin;Miljø- og Fødevareministeriet, 2017).3Data from the second Odense Basin Management Plan (2015–2021, includes latest data up to 2012 (2013 for fish), GIS corrected for the SWAT delineated basin;Miljø- og Fødevareministeriet, 2016,2017).
affected, increasing high probabilities of both in all the scenarios (Appendix A, Fig. S2-B).
4. Discussion 4.1. BBNs validation
For some indices, there were obvious discrepancies between the biotic status classes probabilities derived from the BBN and those ob-served in both basins (Figs. 3 and 4). BBN predictions tend to be con-servative by underestimating the High/Good class probability and overestimating the Poor/Bad status in many cases. In fact, poor vali-dation is a known problem in BBN studies (McDonald et al., 2015), as it often incorporates non-testable information, e.g. based on expert jud-gement. The discrepancies found in our study can be partly explained by data limitation: in Odense, the availability of observed data for macrophytes and fish from the Basin Management Plans was scarce (Fig. 3). In Sorraia, not all the sites in the database have complete data regarding EQR values for each BQE index, so the 2011 data for vali-dation represents only a subset of the biomonitoring dataset. Some authors have also emphasised the need to validate BBNs with in-dependent data, but they also admit that it can be difficult when probability distributions are derived from data sources other than ob-served (Barton et al., 2008;Moe et al., 2016). In general terms, the average trend for most indices in both BBNs results and observed data were relatively similar. Moreover, CPTs calculations relied on already calibrated/verified models and therefore the BBN may already be considered partially validated from the beginning. The use of several BQEs also helps to offset problems from a less ideal validation.
4.2. BBN modelling: simulation of scenarios 4.2.1. Isolated land use change (LUC) scenarios
The probability distributions of the biotic status classes showed minor variations across scenarios for all the indices in both basins, and also for thefinal ecological status, as a result of the combination of the three indices under the“one out, all out” principle (Van de Bund and Solimini, 2007).
Thus, isolated LUC scenarios might not affect much the ecological status of rivers in neither the Sorraia basin nor the Odense Fjord basin. Similar results were obtained byBarton et al. (2008)when using a BBN to evaluate eutrophication mitigation in a Norwegian lake,finding that agricultural measures were insufficient to reach a good ecological status.
4.2.2. MARS storylines
Probability distributions of biotic status classes exhibited only small variations under MARS storylines for most indices in both study sites.
In the Odense Fjord basin, the probability changes observed for the macrophytes index for the 2060 time horizon in the Odense basin (Fig. 7a) were not consistent with the projections under LUC only scenarios, illustrating the consequence of the different climate inputs (RCP 4.5 in consensus world, RCP 8.5 in techno world and fragmented world), and actually a response to the variations in DUR3 (Appendix A, Figure S2-A). Other studies in the basin also showed that climate changes and different climate inputs within scenarios (and not LUC) were the main drivers of streamflow (Molina-Navarro et al., 2018), which is directly related to the main stressors affecting the macrophytes index in the BBN (Fig. 2).Dyer et al. (2014), using also a BBN approach to study the effects of climate change on ecologically-relevant flow Fig. 4. Probability distribution of biotic status classes (PB: Poor/Bad, M: Moderate, HG: High/Good) estimated by the Bayesian Belief Network (BBN) using prob-ability distributions of stressors derived from the 2011 biomonitoring data vs. observed biotic status classes in 2011 for phytobentos (Phyt., a), macrophytes (Mphy., b), macroinvertebrates (Minv., c) andfish (d) indices in the Sorraia basin.
regime attributes, also found the duration of high (and low)flows to be a relevant stressor for water quality modelling.
The trend observed for the fish index demonstrates an additional effect of climate over land use changes, and might be explained by higher probabilities for the high BFI class in all the scenarios (Appendix A, Figure S2-A. Nonetheless, a slight increase of thefish index Poor/Bad status was also predicted, balancing the probability distributions so that the average biotic status was not expected to change substantially.
In the Sorraia basin, the major projected variations of biotic status were found in thefish index, indicating that climate change might be the main responsible for the overall observed changes. However, con-trary to the Odense basin, a deterioration of the biotic status, as ex-pressed by a decreasing High/Good class and an increasing Poor/Bad class (Fig. 8d), can be expected to occur in Sorraia. This deterioration is mainly the result of a temperature increase in all storylines (Appendix A, Figure S2-B). Indeed, mean annual temperature was shown to have the strongest negative effect on fish biotic status, among a set of stressors of different nature (Segurado et al., 2018). Other stressors that may contribute to the projected deterioration offish biotic status are the yearly mean duration of lowflow events and TN (Segurado et al., 2018), both predicted to increase in future scenarios (Appendix A, Figure S2-B).
The macrophytes index was found to be responding mainly nega-tively to the frequency of low flow events and TN (Segurado et al., 2018). Nevertheless, the slight deterioration of the biotic status pre-dicted by the BBN (Fig. 8b) might be mainly related to the projected marked increase of TN (especially in techno world and fragmented
world storylines, Appendix A, Figure S2-B), since the frequency of low flow events was not predicted to show high variations.
Projections of phytobenthos and macroinvertebrates indices seem to indicate that future changes might be related to LUC and not to climate change. Indeed, empirical models showed a stronger effect of land use variables in biotic quality for both phytobenthos and macro-invertebrates, namely the percentage of agriculture in the upstream basin, in comparison to hydrological or nutrient stressors (Segurado et al., 2018).
As a result of applying the“one out, all out” principle (Van de Bund and Solimini, 2007), the probability of the Poor/Bad ecological status became higher than in the individual indices in all scenarios and in both basins (Figs. 7d and8e). The more pessimistic product of this principle has already been reported by other authors using BBNs (e.g.Lehikoinen et al., 2014;Moe et al., 2016). Comparing the probabilities obtained for MARS storylines with those obtained with observed climate and present land use (Figs. 5 and 6), results suggested that climate change impacts on the rivers overall ecological status might be more relevant in the Sorraia basin than in the Odense Fjord basin. Mean annual temperature, a stressor only dependent on climate change, was found as one of the relevant stressors for predicting the fish index in Sorraia basin, spreading its influence to the overall status due to the “one out, all out” principle. However, for all the other indices in both basins, both climate and land use changes might not exert a large effect on the ecological status of the rivers.
To the best of our knowledge, this paper uses for thefirst time an ensemble of BQEs for assessing river and stream water quality at an Fig. 5. Probability distributions (%) of biotic status classes (PB: Poor/Bad, M: Moderate, HG: High/Good) for the macrophytes (Mphy., a), macroinvertebrates (Minv., b), andfish (c) indices and of final ecological status classes (d) in the different land use change scenarios in the Odense Fjord basin under observed (OBS, 2001–2010) climate (PLU: Present Land Use, TW: Techno World, CW: Consensus World, FW: Fragmented World).
international scale, predicting ecological effects of future scenarios (combining both climate and socio-economical changes). Thus,finding similar studies using BBNs is challenging.Dyer et al. (2014)also pre-dicted small water quality changes in rivers due to climate change in contrast to significant projected hydrological changes.Moe et al. (2016) and Couture et al. (2018), assessing lake ecological status through BBNs, also revealed a minor influence of climate change on future lake status. However, contrasting with our study, both these studies found a significant impact of future land use management scenarios. Different
basin characteristics and object of study (lake vs. rivers), together with different storyline downscaling methods, might explain these differ-ences.
TN concentration might serve as a chemical water quality proxy. In the Odense case, small variations were found, e.g. a larger probability of high TN in the techno world scenario in 2030 than in the techno world LUC scenario under observed climate (despite same decrease in fertilization), or a lower probability of high TN in the fragmented world scenario in 2060 than in the fragmented world LUC scenario under Fig. 6. Probability distributions (%) of biotic status classes (PB: Poor/Bad, M: Moderate, HG: High/Good) for the phytobentos (Phyt., a), macrophytes (Mphy., b), macroinvertebrate (Minv., c) andfish (d) indices and of final ecological status classes (e) in the different land use change scenarios in the Sorraia basin under observed (OBS, 2001–2010) climate (PLU: Present Land Use, TW: Techno World, CW: Consensus World, FW: Fragmented World).
observed climate. These changes might result from an additional effect of climate change: higherflows favour dilution, but also lead to higher organic N load (Molina-Navarro et al., 2018;Couture et al., 2018).Moe et al. (2016)also found that the benefits of better land use management could be partly counteracted by future warming.
In the case of Sorraia, a much slighter increase of the higher class probabilities for TN was found under the isolated LUC scenarios for techno world and fragmented world storylines under observed climate compared with the scenarios that incorporated climate change, despite the use of the same fertilization scenarios. All simulated future sce-narios showed a significant decrease in water flow due to the lower predicted precipitation according to GFDL climate models (Almeida et al., 2018), which might explain the higher increase of TN con-centration. In the case of the consensus world LUC scenario under ob-served climate, an overall decrease of TN was projected, which is in line with the decrease on the use of fertilizers in this storyline. In the equivalent scenario that incorporates climate change, the effect of the decrease in precipitation overrode the decrease in fertilizer input, re-sulting in a slight increase of TN. The high solubility and leaching susceptibility of nitrate (Ramos et al., 2012) might explain the sensi-tivity of TN to variations in water quantity.
4.3. Consequences for management
BBN modelling predicted that most water bodies from both catch-ments would fail to achieve the ecological status criteria required in the EU Water Framework Directive (“Good” or “High” ecological status, (European Parliament and Council, 2000).
In the Odense Fjord basin, the changes simulated in the fragmented
world storyline would not deteriorate the ecological status of the rivers, but those in the consensus world storylines would not improve it either. Actually, a small improvement is predicted in techno world and frag-mented world in 2060, but because of a different climate input (see 4.2.2). Results show that the BQE most responsible for a non-desirable overall ecological status is the macrophytes index. Thus, water man-agers in the Odense Fjord basin should place particular emphasis on improving the macrophytes’ status in the basin´s streams, thus coun-teracting the plausible effects of climate change on the macrophytes communities.
In the Sorraia basin, the percentage of rivers not fulfilling the WFD is worse in all the scenarios compared to the baseline (Fig. 8e). The main BQE governing the bad overall ecological status is thefish com-ponent (Fig. 8d). Fish biotic status is predicted to decrease under the three storylines due to higher temperatures. Thus, water managers in the Sorraia basin need to put into practice measures to counteract the effect of higher temperatures in the fish communities.
4.4. Strengths and weaknesses of the BBN approach
The main advantage of the use of BBNs is that it allowed to bridge into a single framework information of very different nature, including direct data-driven patterns, process-based models, empirical models, expert judgement and more arbitrary management rules (e.g.“one out all out” WFD rule). Predicted changes are expressed as probabilities, which directly show decision-makers the chances of achieving certain outcomes under alternative socio-economic scenarios.
Despite obvious strengths, BBNs are not without drawbacks. In this study we tried to circumvent most of the BBNs known shortcomings Fig. 7. Probability distributions (%) of biotic status classes (PB: Poor/Bad, M: Moderate, HG: High/Good) for the macrophytes (Mphy., a), macroinvertebrates (Minv., b) andfish (c) indices, and of the final ecological status classes (d) for the baselines (PLU_4.5, PLU_8.5) and the future storylines scenarios in the Odense Fjord basin (PLU: Present Land Use, TW: Techno World, CW: Consensus World, FW: Fragmented World, 30: 2030 time horizon, 60: 2060 time horizon, 4.5: Representative Concentration Pathway 4.5, 8.5: Representative Concentration Pathway 8.5).
(Barton et al., 2008; Borsuk et al., 2004, 2012; Forio et al., 2015; McDonald et al., 2015;Quian and Miltner, 2015). First, the acyclical structure of BBNs that, by not allowing feedback effects, restrict re-lationships to be based on steady-state conditions (Borsuk et al., 2004; McCann et al., 2006). Given the objectives proposed in our case-studies, this does not constitute a problem because we define fixed time win-dows to which we assumefixed socio-economic storylines and climate scenarios that do not have dependencies on the outcomes.
A second issue is the tendency to define over-complex network
structures in relation to the scale of the management problem (Barton et al., 2008). We made an effort to use network designs as parsimonious as possible, by restricting variables to those that could be measured or modelled at least at the sub-basin scale, i.e. the portion of basin draining into each of the modelled rivers, which are the WFD man-agement units (water bodies). In this way, we also coped with the on-going challenge in aquatic ecology of minimizing model structures to present the simplest form (Marcot, 2012;McDonald et al., 2015), be-cause a large number of model nodes does not necessarily warrantee a Fig. 8. Probability distributions (%) of biotic status classes (PB: Poor/Bad, M: Moderate, HG: High/Good) for the phytobenthos (Phyt., a), macrophytes (Mphy., b), macroinvertebrates (Minv., c) andfish (d) indices, and of the final ecological status classes (e) for the baselines (PLU_4.5, PLU_8.5) and the future storylines scenarios in the Sorraia basin (PLU: Present Land Use, TW: Techno World, CW: Consensus World, FW: Fragmented World, 30: 2030 time horizon, 60: 2060 time horizon, 4.5: Representative Concentration Pathway 4.5, 8.5: Representative Concentration Pathway 8.5).
lower uncertainty (Barton et al., 2008). Furthermore, to ensure management applicability, the BBN models focused on two stressor types -flow and water quality (nutrient loads) - which are key targets of river management (Dyer et al., 2014).
A third issue is related with the sensitivity of BBNs outcomes to discretisation of probability distributions (Aguilera et al., 2010; Uusitalo, 2007). To deflect this problem we followed the general re-commendations to define both the breakpoints and the number of in-tervals (Uusitalo, 2007), taking into account limitations in our data, in particular ensuring that each interval had a reasonable amount of ob-servations. For biotic status variables and final biotic status, dis-cretization had a management significance since we used the quality boundaries of biotic quality indices that are officially used as criteria for management actions, namely the border between moderate and good condition.
5. Conclusions
BBNs have been developed to simulate the ecological status of streams and rivers in two European river basins (Odense Fjord and Sorraia) as the result of different climate change scenarios and their potential consequent socio-economic storylines (i.e. land use and agri-cultural management changes). The outputs of BBN modelling suggest little changes in the biotic status of rivers in the majority of the BQEs analysed. As a result, both in the Odense Fjord and in the Sorraia basin, a large percentage of the rivers would not cope with the WFD criteria of good or better ecological status, similar to the present situation in Odense, and slightly worse than in Sorraia. In Odense, the macrophytes BQE was the main responsible for this and in Sorraia it was the fish BQE; managers should allocate their efforts into reducing the effects of stressors into these BQEs respectively for each basin. Despite all po-tential limitations, the BBN projections may represent the best possible outcomes taking into account the typical limitations of bioassessment data availability from environment agencies and may provide useful qualitative insights to decision-making on water management under future climate change.
Declaration of Competing Interest
The authors declare that they have no known competingfinancial interests or personal relationships that could have appeared to in flu-ence the work reported in this paper.
Acknowledgements
We thank the Agência Portuguesa do Ambiente (APA) for providing biomonitoring data from the Tagus Basin. This work is part of the MARS Project (Managing Aquatic ecosystems and water Resources under multiple Stress) funded under the 7th EU Framework Programme, Theme 6 (Environment in cluding Climate Change), Contract No: 603378. Pedro Segurado is supported by a contract funded by the Fundação para a Ciência e Tecnologia (FCT) under the IF Researcher Programme (IF/01304/ 2015). Paulo Branco has been financed by National funds via FCT, under “Norma Transitória –DL57/2016/ CP1382/CT0020”. CEF is a research unit funded by Fundação para a Ciência e a Tecnologia (FCT), Portugal (UID/AGR/00239/2013). Eugenio Molina-Navarro has been supported by the Ramón Areces Foundation under the 26th edition of grants for postgraduate studies and the EU Joint Baltic Sea Research and Development Programme (BONUS) under the Go4Baltic project during his postdoc at Aarhus University.
References
Aguiar, F.C., Segurado, P., Urbanič, G., Cambra, J., Chauvin, C., Ciadamidaro, S., Dörflinger, G., Ferreira, J., Germ, M., Manolaki, P., Minciardi, M.R., Munné, A.,
Papastergiadou, E., Ferreira, M.T., 2014. Comparability of river quality assessment using macrophytes: a multi-step procedure to overcome biogeographical differences. Sci. Total Environ. 476–477, 757–767.
Aguilera, P.A., Fernández, A., Reche, F., Rumí, R., 2010. Hybrid Bayesian network clas-sifiers: application to species distribution models. Environ. Model. Softw. 25 (12), 1630–1639.
Almeida, S.F.P., Elias, C., Ferreira, J., Tornes, E., Puccinelli, C., Delmas, F., Dorflinger, G., Urbanic, G., Marcheggiani, S., Rosebery, J., Mancini, L., Sabater, S., 2014. Water quality assessment of rivers using diatom metrics across Mediterranean Europe: a methods intercalibration exercise. Sci. Total Environ. 476-477, 768–776. Almeida, C., Ramos, T., Segurado, P., Branco, P., Neves, R., Proença de Oliveira, R., 2018.
Water Quantity and Quality under Future Climate and Societal Scenarios: A Basin-Wide Approach Applied to the Sorraia River, Portugal. Water 10 (9), 1186. APA, 2012. Plano de Gestão da Região Hidrográfica do Tejo. Relatório Técnico. Síntese.
(Accessed 5 September 2019). https://sniambgeoviewer.apambiente.pt/Geodocs/ geoportaldocs/Planos/PGRH5-TEJO/RelatorioTecnico_CE%5C1_PGRHTejo_Rel_CE. pdf.
Arnold, J.G., Srinivasan, R., Muttiah, R.S., Williams, J.R., 1998. Large area hydrologic modeling and assessment Part I: model development. J. Am. Water Resour. Assoc. 34, 73–89.
Barton, D.N., Andersen, T., Bergland, O., Engebretsen, A., Jannicke Moe, S., Orderud, G.I., et al., 2016. Eutropia– integrated valuation of Lake Eutrophication abatement de-cisions using a bayesian belief network. In: Neal, Z.P. (Ed.), Handbook of Applied System Science. Routledge, pp. 297–320.
Barton, D.N., Saloranta, T., Moe, S.J., Eggestad, H.O., Kuikka, S., 2008. Bayesian belief networks as a meta-modelling tool in integrated river basin management— pros and cons in evaluating nutrient abatement decisions under uncertainty in a Norwegian river basin. Ecol. Econ. 66, 91–104.
BayesFusion, L.L.C., 2019. GeNIe Modeler: Complete Modelling Freedom. (Accessed 4 September 2019). https://www.bayesfusion.com/genie/.
Borsuk, M.E., Stow, C.A., Reckhow, K.H., 2004. A Bayesian network of eutrophication models for synthesis, prediction, and uncertainty analysis. Ecol. Modell. 173 (2-3), 219–239.
Borsuk, M.E., Schweizer, S., Reichert, P., 2012. A Bayesian network model for integrative river rehabilitation planning and management. Integr. Environ. Assess. Manag. 8 (3), 462–472.
Cemagref, 1982. Étude des méthodes biologiques d’apréciation quantitative de la qualité des eaux. Ministère De l’Agriculture, Cemagref, Division Qualité Des EauxPêche Et Pisciculture. Agence Française de Bassin Rhône-Mediterranée-Corse, Lyon. Couture, R., Moe, S.J., Lin, Y., Kaste, Ø, Haande, S., Lyche Solheim, A., 2018. Simulating
water quality and ecological status of Lake Vansjø, Norway, under land-use and climate change by linking process-oriented models with a Bayesian network. Sci. Total Environ. 621, 713–724.
Dyer, F., ElSawah, S., Croke, B., Griffiths, R., Harrison, E., Lucena-Moya, P., et al., 2014. The effects of climate change on ecologically-relevant flow regime and water quality attributes. Stoch. Environ. Res. Risk Assess. 28, 67–82.
European Environmental Agency, 2010. Corine Land Cover 2006 Raster Data. (Accessed 5 September 2019). http://www.eea.europa.eu/data-and-maps/data/corine-land-cover-2006-raster-3.
European Parliament and Council, 2000. Directive 2000/60/EC of 23 October 2000 es-tablishing a framework for the Community action in thefield of water policy. Official Journal of the European Union 327.
Faneca Sanchez, M., Duel, H., Alejos Sampedro, A., Rankinen, K., Holmberg, M., Prudhomme, C., et al., 2015. Report on the MARS scenarios of future changes in drivers and pressures with respect to Europe’s water resources, in: Deliverable 2.1. Four Manuscripts on the Multiple Stressor Framework. pp. 215–284. Available at: http://www.mars-project.eu/index.php/deliverables.html.
Feio, M.J., Ferreira, J., Buffagni, A., Erba, S., Dörflinger, G., Ferréol, M., Munné, A., Prat, N., Tziortzis, I., Urbanič, G., 2014. Comparability of ecological quality boundaries in the Mediterranean basin using freshwater benthic invertebrates. Statistical options and implications. Sci. Total Environ. 476-477, 777–784.
Feld, C.K., Segurado, P., Gutiérrez-Cánovas, C., 2016. Analysing the impact of multiple stressors in aquatic biomonitoring data: a“cookbook” with applications in R. Sci. Total Environ. 573, 1320–1339.
Ferreira, J., Bernardo, J.M., Alves, M.H., 2008. Exercício De Intercalibração Em Rios No Âmbito Da Directiva-quadro Da Água. Acta do 9° Congresso da Água, Lisboa. Ferreira, T., Panagopoulos, Y., Bloomfield, J., Couture, R.-M., Ormerod, S., (MARS Project
WP4 Team), et al., 2016. Case study synthesis -final report. MARS Project Deliverable 4.1. Available at: http://mars-project.eu/index.php/deliverables.html. Forio, M.A.E., Landuyt, D., Bennetsen, E., Lock, K., Nguyen, T.H.T., Ambarita, M.N.D.,
et al., 2015. Bayesian belief network models to analyse and predict ecological water quality in rivers. Ecol. Modell. 312, 222–238.
Grizzetti, B., Pistocchi, A., Liquete, C., Udias, A., Bouraoui, F., van de Bund, W., 2017. Human pressures and ecological status of European rivers. Sci. Rep. 7, 205. Haury, J., Peltre, M.-C., Trémolières, M., Barbe, J., Thiébaut, G., Bernez, I., et al., 2006. A
new method for assess water trophy and organic pollution— the Macrophyte Biological Index for Rivers (IBMR): its application to different types of rivers and pollution. Hydrobiologia 570, 153–158.
Hering, D., Carvalho, L., Argillier, C., Beklioglu, M., Borja, A., Cardoso, A.C., et al., 2015. Managing aquatic ecosystems and water resources under multiple stress— an in-troduction to the MARS project. Sci.Total Environ. 503–504, 10–21.
INAG, AFN, 2012. Desenvolvimento De Um Índice De Qualidade Para a Fauna Piscícola. Ministério da Agricultura, Mar, Ambiente e Ordenamento do Território, Lisbon. INE, 2011. Censos 2011 - XV Recenseamento Geral Da População E V Recenseamento
Geral Da Habitação. Instituto Nacional de Estatística, Lisbon.