Transylvanian
Review
Vol XXIV, No. 13, 2017
Transylvanian Review
Centrul de Studii Transilvane| str. Mihail Kogalniceanu nr. 12-14, et.5, Cluj-Napoca Email: [email protected] /
New Method for Increasing Sustainable Agricultural
Yield
1 F. Leiva Gea F, 1 A. Cano Ortiz, 2 C.M. Musarella, 1 J.C. Piñar Fuentes, 3 C.J. Pinto Gomes and 1 E. Cano
1 Department of Animal Biology, Plant and Ecology, Botany, University of Jaén, Jaén, Spain, 2 Department of AGRARIA,
University “Mediterranea” of Reggio Calabria, Località Feo di Vito, 89122 Reggio Calabria, Italy and 3 Department of
Landscape, Environment and Planning/Institute of Agricultural and Environmental Sciences. Mediterranean (ICAAM), University of Évora (Portugal), Rua Romão Ramalho, Portugal.
Abstract
The main objective of this study is to look for a new method, to obtain the maximum production, and the minimum economic and environmental cost.
Scientific advances in bioclimatology have brought a greater understanding of the functioning of plant individuals, populations and communities, and the study and interpretation of bioclimatic indices reveals the close relationship between the values of these indices and crop yields.
In cases where insufficient meteorological data are available to allow the various formulas to be applied, thermoclimatic and ombroclimatic bioindicators must be used, some of which have been collected by us in previous works.
This paper contains a bioclimatic study of the southern Iberian Peninsula in relation to the main olive varieties grown in these territories. We establish the values of some key indices for cultivation: continentality index (Ic), which determines the annual thermal range and allows us to establish the period of vegetative activity (PAV); the ombrothermic index (Io), which measures the ombrotype in the different sites; and the thermicity and compensated thermicity index, which denote the thermotype in the territory (It/Itc). In the relationship between the value of the bioclimatic indices and olive production, good fits are obtained in the regression analysis with R2> 0.90, and is very positive influence of the different parameters used.
In conclusion the greatest influence on the production of Ic is between 18.5-19.5, Io 3.5-4.5 and It / Itc 320-350. This allows to obtain areas of maximum production with a lower economic cost.
Keywords: Bioclimatology, olive cultivation, yield, sustainable.
Introduction
Advances in bioclimatic research have brought a greater understanding of the functioning of plant individuals, populations and communities. By applying bioclimatic indices, Rivas-Martínez and Loidi (1999) were able to establish a close relationship between bioclimatic data and plant communities, thus enabling the characterisation of each territory. However, these bioclimatic approaches are also applicable to different crops. The correlation between the indices for the Mediterranean macrobioclimate and the distribution of olive plantations clearly highlights the typically Mediterranean character of Olea europaea L. In the southern Iberian Peninsula, olive cultivation covers vast areas and has major socio-economic importance. The main varieties are Picual, Cornicabra, Hojiblanca, Lechin, Morisca, Manzanilla, Gordal and Verdial.
Under this climate classification, almost all the olive plantations are located in areas with a Mediterranean pluviseasonal oceanic (Ic< or =21, Io>2.0), Mediterranean pluviseasonal continental (Ic>21, Io>2.2) or Mediterranean continental xeric (Ic>21, 1.0<Io<2.2)
bioclimate: there are very few olive plantations under the Mediterranean oceanic xeric bioclimate (Ic< ó =21, 1.0<Io<2.2).
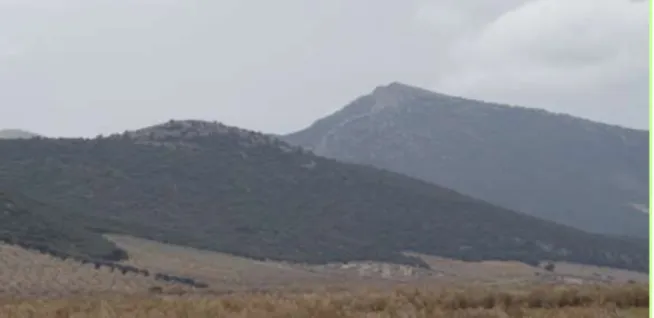
Practically all the olive plantations are located in bioclimatic belts with a thermomediterranean (Itc 350-450) or mesomediterranean (Itc 210-350) thermotype, and a semiarid (Io 1.0-2.0), dry (Io 2.0-3.6) or subhumid (Io 3.6-7.0) ombroclimate. Only in isolated cases do we find non-extensive cultivations in the supramediterranean (Itc 80-210), and exceptionally in the humid mesomediterranean. There is scarce representation of the supramediterranean thermotype due to the relatively low presence of olive plantations in this thermotype. These sites have between 4 to 6 months of frost and can therefore be regarded as unproductive, even causing trees to die due to excessively low temperatures, as occurred in 2005 (Figure 1). This year had a very high number of days with temperatures below -10 ºC, and thus any plantations that were not in their bioclimatic optimum were affected by frost. This occurs in upper mesomediterranean and supramediterranean areas, and even in enclosed valleys where thermal inversion causes the territory to behave as upper meso- or supramediterranean.
Fig. 1: Olive crop showing frost damage caused by to failure to take into account the bioclimatic features of the territory
Although various factors have conditioned the cultivation of the different olive varieties in each zone, they are not always located in their ecological optimum from the bioclimatic point of view. Recent studies (Cano et al., 2001a; Ighbareyeh et al., 2014a,b,c) have highlighted the influence of bioclimatology on olive yields; however this is the first time the bioclimatic characterisation of the different varieties has been undertaken. One of the aims of the present study is to relate the distribution of the
different olive varieties with various bioclimatic indices, and characterise each one according to its bioclimatic requirements. The goal is to contribute new criteria for the agricultural planning of olive cultivation. This also requires biogeographical and soil studies of potential sites for olive cultivation. All this information can be used to propose models for agricultural management, according to Cano et al. (2003). The influence of climate change on agriculture (Peters et al., 2014; Kumar et al., 2016) is mitigated by the
application of agricultural management bioclimatology. With this work we correlate the science of Bioclimatology with agricultural crops, and demonstrate the influence of bioclimatic factors on production. A study that completes the Fakhar-u-Zaman Akhtar et al. (2016) experiment with the application of nutrients. Which together with the studies on poverty and its relation with the greater or lesser agricultural growth (Abdul Rehman et al., 2016a, b) justify this work.
Material and Methods
Initially we developed bioclimatic index territories where there is olive cultivation in southern Spain.
The present work is based on data from 57 meteorological stations, selected due to their location either in or near areas of olive cultivation, or –in a few cases– far from olive plantations. We used the following formulas to calculate the values of the various indices (Rivas Martínez, 1996), (Rivas Martínez and Loidi, 1999): ombrothermic index, Io = Pp/Tp; bi-monthly summer ombrothermic index, Is2 = PJuly+August/TJuly+August; tri-monthly summer ombrothermic index, Is3 = PJune+July+August/TJune+July+August; and continentality index, Ic = Tmax-Tmin; thermicity index, or –where applicable– compensated thermicity index, It/Itc = (T+M+m)10. Pp = positive precipitation and Tp = positive temperature (in this case equivalent to annual precipitation and average annual temperature divided by 12, as all the months have an average temperature above 0°); P = precipitation of the months indicated; T = average temperature of the months indicated; Tmax = maximum temperature of the averages of the warmest month of the year; Tmin = minimum temperature of the averages of the coldest month of the year; T = average annual temperature; M = average of the maximum temperature of the coldest month of the year; and m = average of the minimum temperature of the coldest month of the year. The Itc is applied only to stations with Ic >18, and is obtained by adding a correction factor C to the It, thus establishing the PAV = period of vegetative activity for each station. The Io reveals the ombrotype and determines how much rain falls in a territory and its vegetation response; whereas the Ic shows its continentality, and the It/Itc its thermicity. Summer ombrothermic indices are important in agriculture, as the greater the difference between Is2 and Is3, the greater the compensation. In order to determine the predominance of particular bioclimatic parameters such as Io, Ic and It/Itc in a territory and establish the dominant thermotypes and ombrotypes, we grouped the meteorological stations according to the number of months with vegetative activity, as all the varieties respond well to this criterion. We defined three major areas throughout the whole territory: those where vegetative activity occurs for a) 12 months, b) 10-11 months, and c) 8-9 months. We calculated the averages of the indices mentioned and obtained the Iom,
Icm and It/Itcm. We also used previous data on yields collected in Cano et al. (1997), as well as the agricultural characteristics of varieties described by authors such as Barranco et al. (1998) and Guerrero (1991). We compared each variety with the value of the indices expressed, and contrasted the cultivation with each vegetation series (Rivas Martínez, 1987), (Rivas Martínez et al. 2011). To test the influence of bioclimatic parameters (Pp, It / Itc, Ic, Io) and potential evapotranspiration (ETP) in the production of olive, do a statistical multiple regression analysis. For this face mean values (IIt / Itc, Ic, Io) from an area with the productions.
The interpretation of vegetation based on climate domains (sigmetum) is very important for the subsequent treatment of the vegetation. In order to implement agricultural or any other types of actions, it is essential to have a thorough knowledge of the vegetation series, the catenal contacts between the different landscape units, and the vegetation dynamic. Vegetation dynamic is understood as the successions that occur in the plant cover with the appearance of the initial, intermediate, transitional and final stages. The final stage is reached at the point of the stable biological maximum in harmony with itself and with the ecological factors in the environment. Braun-Blanquet (1979) distinguishes between progressive successions directed towards the climax, and regressive successions which move away from the climax. Regressive successions are normally caused by human and animal intervention, and also by environmental factors. Climatophilous series depend on the general characteristics of the environment – particularly the territorial microclimate–, and the location of the olive plantation (Cano and Cano Ortiz, 2016).
Resultados
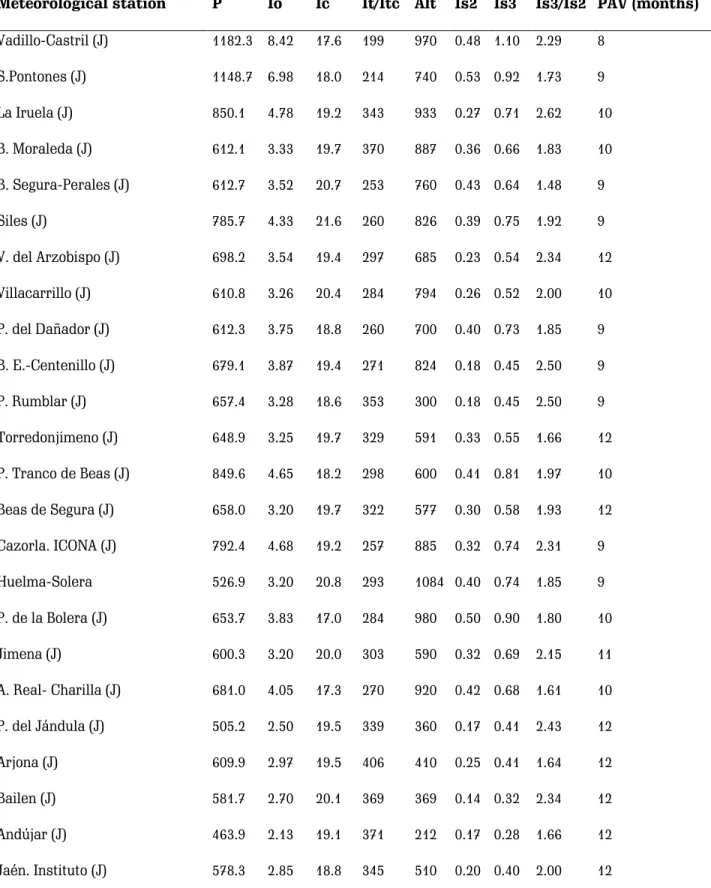
Table 1 was created with data from 57 meteorological stations, obtaining values for T, P, Io, Ic, It/Itc, Tmax , Tmin, Alt (altitude), Is2, Is3 and PAV (period of vegetative activity) for each one. The analysis of the climate and bioclimatic parameters revealed that most of the territory in the study has 12 months of PAV, with no interruption due to cold –considered as occurring when the average monthly T falls below 7.5 ºC (Montero Burgos and González Rebollar, 1983). This precisely coincides with the territories lying more to the south and south-west of the province, which have mainly a thermomediterranean thermotype with It/Itcm =346, and a dry ombrotype with values of Iom = 2.81 and Icm =19.36. The sites with a PAV of 8-9 months are located predominantly in the northwest of the province of Jaén, with the particularity that both territories have a upper mesomediterranean thermotype with It/Itcm = 264.5, and an Icm (average value of the Ic) of 19.43. However the value for Iom (average value of Io) is 4.42, due to the fact that the mountain ranges of Segura, Las Villas and Cazorla –among others– act as a screen against low pressure areas, causing the stations to have a high Io. However (Table 1) shows there are stations with
10-11 months of PAV and a lower mesomediterranean
thermotype occupying a large part of the province of Jaén and Cordoba, with values of Iom = 3.23 Icm =18.82 and It/Itcm =304.
Table 1: General table of stations and bioclimatic indices. P. Average annual precipitation. Io. Ombrothermic index. Ic.
Continentality index (annual thermic index). It/Itc. Thermicity index/Compensated thermicity index. Alt. Altitude. Is2, Is3. Compensated ombrothermic indices. PAV. Period of vegetative activity.
Meteorological station P Io Ic It/Itc Alt Is2 Is3 Is3/Is2 PAV (months)
Vadillo-Castril (J) 1182.3 8.42 17.6 199 970 0.48 1.10 2.29 8 S.Pontones (J) 1148.7 6.98 18.0 214 740 0.53 0.92 1.73 9 La Iruela (J) 850.1 4.78 19.2 343 933 0.27 0.71 2.62 10 B. Moraleda (J) 612.1 3.33 19.7 370 887 0.36 0.66 1.83 10 B. Segura-Perales (J) 612.7 3.52 20.7 253 760 0.43 0.64 1.48 9 Siles (J) 785.7 4.33 21.6 260 826 0.39 0.75 1.92 9 V. del Arzobispo (J) 698.2 3.54 19.4 297 685 0.23 0.54 2.34 12 Villacarrillo (J) 610.8 3.26 20.4 284 794 0.26 0.52 2.00 10 P. del Dañador (J) 612.3 3.75 18.8 260 700 0.40 0.73 1.85 9 B. E.-Centenillo (J) 679.1 3.87 19.4 271 824 0.18 0.45 2.50 9 P. Rumblar (J) 657.4 3.28 18.6 353 300 0.18 0.45 2.50 9 Torredonjimeno (J) 648.9 3.25 19.7 329 591 0.33 0.55 1.66 12 P. Tranco de Beas (J) 849.6 4.65 18.2 298 600 0.41 0.81 1.97 10 Beas de Segura (J) 658.0 3.20 19.7 322 577 0.30 0.58 1.93 12 Cazorla. ICONA (J) 792.4 4.68 19.2 257 885 0.32 0.74 2.31 9 Huelma-Solera 526.9 3.20 20.8 293 1084 0.40 0.74 1.85 9 P. de la Bolera (J) 653.7 3.83 17.0 284 980 0.50 0.90 1.80 10 Jimena (J) 600.3 3.20 20.0 303 590 0.32 0.69 2.15 11 A. Real- Charilla (J) 681.0 4.05 17.3 270 920 0.42 0.68 1.61 10 P. del Jándula (J) 505.2 2.50 19.5 339 360 0.17 0.41 2.43 12 Arjona (J) 609.9 2.97 19.5 406 410 0.25 0.41 1.64 12 Bailen (J) 581.7 2.70 20.1 369 369 0.14 0.32 2.34 12 Andújar (J) 463.9 2.13 19.1 371 212 0.17 0.28 1.66 12 Jaén. Instituto (J) 578.3 2.85 18.8 345 510 0.20 0.40 2.00 12
Linares (J) 642.2 3.12 18.3 339 419 0.21 0.52 2.48 12 L. Torrubias (J) 490.4 2.34 20.3 355 290 0.14 0.31 2.26 12 Mancha Real (J) 551.6 3.02 18.1 299 753 0.37 0.69 1.87 11 P. Guadalmena (J) 517.9 2.74 20.0 308 602 0.37 0.55 1.48 11 L. Fuente Higuera (J) 471.0 2.36 18.6 342 300 0.15 0.30 2.00 12 Ubeda (J) 579.6 3.03 18.4 313 748 0.22 0.44 2.00 11 La P. de Segura (J) 674.7 3.55 19.9 305 584 0.35 0.64 1.82 10 Cabra de s. Cristo (J) 449.9 2.62 17.7 275 938 0.35 0.65 1.86 10 Ubeda. P. Guadiana (J) 404.6 2.24 19.6 285 420 0.23 0.46 2.00 9 P. Guadalmellato (CO) 698.4 3.42 18.0 349 200 0.40 0.64 1.60 12 C. La Jarosa (CO) 831.1 4.46 16.5 315 340 0.25 0.31 1.24 12 Pantano P. Nuevo (CO) 760.6 4.03 17.9 321 410 0.16 0.59 3.68 12 Villaralto (CO) 501.4 2.66 18.8 310 583 0.42 0.60 1.42 11 Pozoblaanco (CO) 514.4 2.66 19.9 311 649 0.34 0.66 1.94 10 Aldea de Cuenca (CO) 559.0 2.98 18.1 307 571 0.23 0.67 2.91 12 H. del Duque. (CO) 476.9 2.68 18.4 284 540 0.42 0.68 1.61 11 Pedroche (CO) 506.8 2.60 19.2 322 621 0.38 0.63 1.65 12 La Rambla (CO) 527.4 2.81 17.9 308 200 0.30 0.41 1.37 12 Castro del Río (CO) 470.7 2.45 20.1 305 210 0.17 0.36 2.12 11 Montoro (CO) 572.4 2.72 18.1 360 195 0.19 0.37 1.94 12 Pozoblanco. Cerro (CO) 594.7 2.98 19.0 339 500 0.32 0.52 1.62 12 C. Miraflores(CO) 634.4 2.81 18.8 394 120 0.24 0.44 1.83 12 C. Aeropuerto (CO) 630.2 3.00 17.6 365 92 0.14 0.34 2.42 12 Baena. S.E.A. (CO) 519.5 2.60 20.7 326 463 0.25 0.39 1.56 11 P. Pueblonuevo (CO) 524.1 2.49 19.9 356 550 0.16 0.42 2.62 12 P. de Baena (CO) 598.6 2.93 18.2 345 150 0.16 0.37 2.31 12 Posadas (CO) 686.9 3.23 18.4 359 88 0.30 0.50 1.66 12 P. de Bembezar (CO) 667.5 3.21 17.7 363 100 0.24 0.51 2.12 12
Lucena. C. Malpa. (CO) 410.0 2.07 16.8 345 280 0.26 0.44 1.69 12 Carcabuey. Algar (CO) 795.8 4.77 16.3 291 740 0.26 0.60 2.30 12 Rute. S. E. A (CO) 636.4 3.31 17.6 327 639 0.27 0.47 1.74 12 Lucena. CdeA (CO) 679.4 3.37 18.1 344 586 0.21 0.46 2.19 12 Puente Genil. C. (CO) 435.2 2.02 17.9 373 200 0.24 0.39 1.62 12
The interpretation of Is2 is particularly important in this analysis of the bioclimatic parameters affecting olive cultivation, as it has low values compared to Is3. This is due to the June rains, which is compensated plant cover in stations where Is3 is very high compared to Is2, thereby reducing water stress. Evidently the higher the ratio of Is3/Is2, the greater the compensation; however this does not imply that waters stress disappears, as the rains may be abundant during winter and spring and minimal in June, and not offset the deficit in July and August. Thus for example in Table 1 the Santiago-Pontones station has rainfall of 1148, Is2 = 0.27 and Is3 = 0.71, with an Is3/Is2 ratio of 2.62; we can contrast this with the Pantano de Guadalmena station, which has Is2 = 0.37 and Is3 = 0.55, and a ratio of Is3/Is2 =1.48. For these situations it is important to take into account another parameter of vital importance in the management of olive plantations: the ETP (potential evapotranspiration)and the CR (soil water retention capacity), which –as we highlighted in Cano et al.
(2001b) – depends fundamentally on texture, structure, organic material and
in order to determine the influence of the parameters (Pp, ETP, It / Itc, Ic, Io) in the production of olive cultivation, face values of these parameters olive production. We use three types of regression to see which best fits the data.
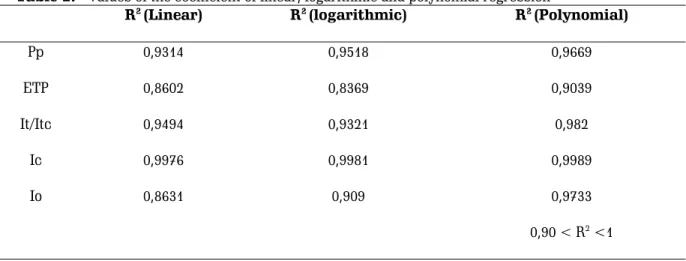
For linear regression, the value R2 is below 0.90 in the case
of ETP and Io, and logarithmic regression with only have value less than 0.90 if the parameter ETP (Table 2). However in all cases R2 is greater than 0.90 when we apply a polynomial fit with a very high setting in the three types of regression in the case of Ic, demonstrating the influence of the parameters used in the production
For positive precipitation Pp is practically linear adjustment, and R2 is greater than 0.90 in all three types of
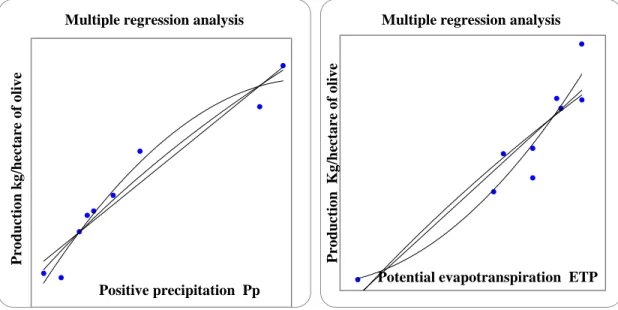
regression. For potential evapotranspiration ETP polynomial regression analysis with value R2> 0.90 fits
better (Figure 2). For It / Itc with R2> 0.90 the impact on
production is negative when It / Itc <300, and very positive when It / Itc ranges from 340-360 (upper thermomediterranean and lower mesomediterranean). It is also very positive influence on the production continentality index Ic, which fits very well in the three types of regression R2 = 0.9989 values very close to 1
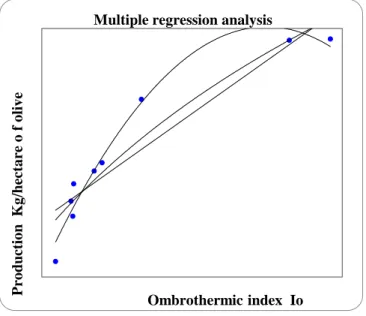
(Figure 3). The Io ombrothermic index has a great influence on production, fitting well in the regression analysis polimonial R2 = 0.9733; existing low productions
when the value of Io <3.5, these productions are increased to values between 3.5 and 4.5 Io, and are depleted for values of Io> 4.5 (Figure 4).
Table 2: - Values of the coefficient of linear, logarithmic and polynomial regression
R2 (Linear) R2 (logarithmic) R2 (Polynomial)
Pp 0,9314 0,9518 0,9669 ETP 0,8602 0,8369 0,9039 It/Itc 0,9494 0,9321 0,982 Ic 0,9976 0,9981 0,9989 Io 0,8631 0,909 0,9733 0,90 < R2 <1
Fig. 2: - Multiple regression analysis. Positive precipitation and potential evapotranspiration. Pp and ETP: Pplynomial
regression (Pp) y = - 2E-0.5x2 + 0.0293x -12.137 (R2 = 0.9669). Linear regression (Pp) y = 0.0069x – 4.466 (R2 = 0.9314).
Logarithmic regression (Pp) y = 4.8457ln (x) – 31.307(R2 = 0.9518). Pplynomial regression (ETP) y = 2E-0.5x2 -0.0286x +
6.8911 (R2 = 0.9038). Linear regression (ETP) y = 0.0095x – 8.4747 (R2 = 0.8602). Logarithmic regression (ETP) y = 7.6236ln
(x) – 51.736 (R2 = 0.8369).
Fig. 3: - Multiple regression analysis. Thermicity and continentality index It/Itc and Ic: Pplynomial regression (It/Itc) y =
0.0002 x2- 0.0709 x + 6.2259 (R2 = 0.982). Linear regression (It/Itc) y = 0.0238 x – 7.2948 (R2 = 0.9494). Logarithmic
regression (It/Itc) y = 6.7967ln (x) – 38.85(R2 = 0.9321). Pplynomial regression (Ic) y = - 0.2799x2 + 12.906x -144.5 (R2 =
0.9989). Linear regression (Ic) y = 2.2334x – 42.806 (R2 = 0.9976). Logarithmic regression (Ic) y = 42.581ln (x) – 125.74 (R2 =
0.9981). P ro du ct io n k g /hect a re o f o liv e Positive precipitation Pp Multiple regression analysis
P ro du ct io n K g /hect a re o f o liv e
Potential evapotranspiration ETP Multiple regression analysis
P ro du ct io n K g /hect a re o f o liv e
Thermicithy index It/Itc Multiple regression analysis
P ro du ct io n K g /hect a re o f o liv e Continentality index Ic Multiple regression analysis
Fig. 4: Multiple regression analysis. Ombrothermic index Io. Pplynomial regression y = – 0.4304 x2 + 4.4035 x – 9.7441
(R2 = 0.9733). Linear regression y = 0.7338 x – 2.6448 (R2 = 0.8631). Logarithmic regression y = 3.0762ln (x) – 3.819 (R2 =
0.909).
Discussion
The results reveal a great correlation between production and bioclimatic parameters, these bioclimatic parameters also condition the vegetation series present in the territory. Consequently, each type of vegetation corresponds to a type of crop, which Cano and Cano Ortiz (2016) establishes for the cultivation of olive trees.
The interpretation of vegetation based on climate domains (sigmetum) is very important for the subsequent treatment of the vegetation. In order to implement agricultural or any other types of actions, it is essential to have a thorough knowledge of the vegetation series, the catenal contacts between the different landscape units, and the vegetation dynamic. Climatophilous series depend on general features of the environment and act as precise indicators for the optimisation of agricultural cultivation. In this study we propose a set of series that are suitable for olive cultivation, and others that are not. * Series where olive cultivation can occur. ** Series where olive cultivation is optimum (Cano and Cano Ortiz, 2016).
Based on the studies conducted by Cano et al. (2007), olive varieties respond to different values in the various bioclimatic indices, and are located in the area of a particular vegetation series. Cano et al. (2003) thus propose a specific model for agricultural and forestry management.
The Picual variety has its optimum in the upper thermomediterranean and lower mesomediterranean belt with values of Io = 3.6-4.6, IC =18-20 and It/Itc = 280/400. It is somewhat tolerant of frost, and thus grows well in the
lower mesomediterranean, where frosts occur for 1-2 months. However as this variety has a good tolerance for soil humidity and is sensitive to drought, it should be grown in areas with an ombrotype ranging from dry to subhumid. This variety is not particular about soil, but grows poorly on sites with a high proportion of clay (vertisols), as these soils have a low CR and a high ETP, and behave as though they were semiarid unless soil management practices are applied to reduce the ETP. It does not grow well in places with an upper subhumid and humid ombrotype; the Io should not be above 4.6, as in these environments it is easily attacked by peacock spot –
Spilocaea oleagina, known locally as "repilo"–, and thus plantations in these territories require a significant economic and environmental cost to maintain their yield. This variety is widespread in the provinces of Jaén, Cordoba and Granada. To achieve its ecological optimum it should be sited in areas occupied by the following series
Pyro bourgaeanae-Querco rotundifoliae s. thermophilous faciation with Myrtus communis, Paeonio coriaceae-Querco rotundifoliae s. thermophilous faciation with Pistacia lentiscus, Viburno tini-Queco fagineae s, Myrto communis-Querco rotundifoliae s, Rhamno-Querco rotundifoliae s.
The Cornicabra variety has its optimum in the upper mesomediterranean belt extending into the lower supramediterranean, with values of Io =2.6-3.6, Ic = 20-22 and It/Itc = 210/280. It is resistant to cold, and therefore grows well with 3-4 months of frosts. It withstands drought well and has a dry ombrotype. Because it is sensitive to peacock spot it should not be located in places with an Io of over 3.6. This variety is widely grown in Ciudad Real,
P ro du ct io n K g /hect a re o f o liv e Ombrothermic index Io Multiple regression analysis
Toledo and parts of Albacete. Its optimum is in the series
1) Pyro-Querco rotundifoliae s.) Querco rotundifoliae s.
The Hojiblanca variety has its optimum in the upper thermomediterranean with a dry ombrotype, and with Io =2.6-3.6, Ic = 17-18 and It/Itc = 350/400. It does not tolerate cold well, and should therefore be grown on sites with a maximum of 1-2 months of frost. It may extend to the lower mesomediterranean. It grows well in dry ombrotypes, and does not resist Io > 3.6 as it is sensitive to peacock spot, tuberculosis and verticilosis. Although it grows well in most soils, it prefers limy substrates. Its optimum is in the series 1) Rhamno-Querco rotundifolaie
s.) Myrto communis-Querco rotundifoliae s, and also in
Paeonio-Querco rotundifoliae s. thermophilous faciation with Pistacia lentiscus.
Lechin, this variety is widespread throughout the provinces of Seville, Cordoba and Cadiz, and has its optimum in the dry-subhumid thermomediterranean with Io = 4-6, Ic = 15-17 and It/Itc = 350/450. It is sensitive to frost, and should therefore be located in frost-free sites or where frosts occur for no more than one month. As it is very resistant to peacock spot, it grows well in subhumid and even humid thermomediterranean locations. It should be located in the thermomediterranean cork oak and Portuguese oak series of Myrto communis-Querco suberis s., Oleo-Querco broteroi s., Rhamno-Querco rotundifoliae
s., Myrto-Querco rotundifoliae s and in mesophytic
faciations of holm oak.
The Morisca variety has its optimum in the dry ombrotype and upper thermomediterranean thermotype, and may extend to the lower mesomediterranean. It cannot withstand extreme cold, but can resist a maximum of one month's frost when located in places with values of Io = 2.6-3.6, Ic = 16-18, and It/Itc = 280/400. This plant tolerates drought and limy soils, and therefore grows well in the region of Tierra de Barros (BA), where there is a degree of basicity, and a pH of nearly 7 (neutral). It should be located in the holm oak series of Pyro-Querco rotundifoliae s. basophilous faciation and thermophilous
faciation. This variety can also be grown in the area
occupied by the series of Myrto-Querco rotundifoliae s.
Manzanilla, this is an eating variety that grows in areas of Seville and Badajoz, extending towards territories in Cáceres, where it is known by the name of "manzanilla cacereña". It is sensitive to frost, and has a thermomediterranean optimum which may extend to the lower mesomediterranean. This plant is sensitive to peacock spot, tuberculosis and verticilosis, and should therefore be located in areas with a dry ombrotype, in this case with values of Io = 2.6-3.6, Ic = 15-17 and It/Itc = 280/450. It can occupy the area of the Morisca variety and is therefore located in the same series.
Gordal, unlike the Manzanilla, this variety is resistant to cold and also requires a certain number of hours of frost to flower; its optimum is therefore mesomediterranean. It is resistant to peacock spot and can therefore be grown in the dry-subhumid ombrotype, where it requires sites with
values of Io = 3.6-4.6, IC = 18-20 and It/Itc =210/350. It should be grown in the area occupied by the same series as the Picual and Hojiblanca varieties. This suggests the need to reconsider the cultivation of the Gordal variety in thermomediterranean areas, as this variety is not currently located in its ecological optimum, which –among other causes– may lead to alternate fruiting.
The Verdial variety is located in lower thermo- and mesomediterranean areas in territories in Huelva, Seville, Badajoz, Malaga and Portugal, as reported by Barranco et al. (1998) and Guerrero (1991), where –according to the first author– different varieties of Verdial occur. They all share the fact that their fruits do not turn totally black, except in the case of the Verdial from Vélez-Málaga, whose high olive oil yield may make it attractive to cultivate. In general terms it can be said to have its optimum in places with Io = 2.6-3.6, Ic =12-15 and It/Itc =280-450, and is present in practically the same series as the Morisca and Manzanilla varieties. As it is sensitive to frost and peacock spot, its cultivation should be planned in thermomediterranean sites with a dry ombrotype.
Arbequina, this cultivar has a mesomediterranean optimum with values of It/Itc = 210-350, Ic = or > 21, and Io = or > 3.6 (dry/subhumid). It is resistant to cold, has relatively underdeveloped trees, and its fruit is small and tightly attached. This is a variety that does not grow well in very limy soils, as this may cause the occurrence of iron chlorosis. It is tolerant of peacock spot and verticilosis, and therefore grows well in zones with Io = or > 3.6. Farga, typical of the provinces of Castellón and Valencia, this plant has its optimum in the upper thermomediterranean to lower mesomediterranean, with It/Itc = 350, Ic = 16-17 and Io < 3.6. It is not frost resistant, although it can withstand cold weather. As it is sensitive to peacock spot it is advisable to grow it in areas with a dry ombrotype.
In view of the considerable increase in the area currently occupied by olive cultivation –and as highlighted by Barranco (1998)–, it is necessary to carry out adaptation tests on all the varieties that are sited far from their habitual cultivation areas. For example in the case of the Empeltre variety –whose cultivation area has traditionally been in the Ebro Valley– in the hypothetical case of its possible introduction in Andalusia, it is worth noting that this variety does not tolerate frost and is somewhat resistant to tuberculosis and verticilosis, which in our opinion would point to the advisability of its cultivation in thermomediterranean areas with an It/Itc of around 350, Ic values ranging between 12-15, and Io > 3.6. The Arbequina variety –whose cultivation is proliferating in Andalusia– can withstand low temperatures, does not tolerate very limy soils, and is resistant to peacock spot and verticilosis. Guerrero (1991) reports that it performed well in tests and can thus be grown in Andalusia. In our opinion, these varieties should be planned on soils that are not excessively limy, in the mesomediterranean bioclimatic
belt with thermotype, It/Itc ranging between 210-350, Ic of around 20 and Io > 3.6.
Conclusions
The research carried out so far allows points to the need for national and European policies to establish scientific and technological criteria when planning olive cultivation, in order to enable sustainable development and minimise economic and environmental cost. We have therefore carried out a general bioclimatic study of areas of olive cultivation to serve as a model for sustainable development in which each variety occupies its own bioclimatic niche. This calls for the territorial ordination of traditional crops and new known botanical resources. In the case of olive cultivation, we establish the limits of bioclimatic tolerance for each of the main varieties. The bioclimatic parameters that most affect production are Ic, Io and It / Itc. This work is demonstrated the need for bioclimatic bases in agricultural management, to achieve sustainable development to increase production and quality, by placing each crop in its bioclimatic optimum.
References
Abdul Rehman, Luan Jingdong, Rafia Khatoon, Imran Hussain (2016a). Effect of Agricultural Growth on Poverty Reduction, its Importance and Suggestions. Transylvanian Review 7 (5):449-454
Abdul Rehman, Luan Jingdong, Muhammad Shahid Iqbal, Imran Hussain (2016b). A Study on Agricultural Development in China and its Comparison with India and Pakistan. Transylvanian Review 24 (6):603-610 Barranco, D., Fernández Escobar, R. and Rallo, L. 1998. El
cultivo del olivo. Ed. Mundi-Prensa. Junta Andalucía. pp. 1-651.
Braun-Blanquet, J. 1979. Fitosociología. Ed. Blume.Madrid Cano, E., García Fuentes, A., Torres, J.A., Salazar, C.,
Melendo, M., Pinto Gomes, C.J. and Valle, F. 1997. Phytosociologie appliquée a la planification agricole. Colloques Phytosociologiques 25 : 1007-1022.
Cano, E., Ruiz, L. and Cano-Ortiz, A. 2001a. Influencia de la Bioclimatología en la producción del olivar. Aldaba 11: 151-155.
Cano, E., Ruiz, L. and Cano-Ortiz, A. 2001b. Análisis de las técnicas de cultivo en el olivar. Aldaba 11:157-162. Cano, E., Ruiz, L., Cano-Ortiz, A. and Nieto, J. 2003. Bases
para el establecimiento de modelos de gestión agrícola y forestal in Memorian al prof. Dr. Isidoro Ruiz Martínez. Serv. Publ. Univ. De Jaén. Pp.131-142 Cano, E., Cano-Ortiz, A. and Montilla, R.J. 2007.
Bioclimatología y olivar en la provincia de Jaén: Establecimiento de áreas de cultivo para algunas variedades de olivo. I congreso de cultura del olivo. IEG. pp. 517-528.
Cano, E. and Cano-Ortiz, A. 2016. Bioclimatología aplicada a agronomía in Nuevas Tendencias en Olivicultura.
Serv. Publ. University of Jaen. Pp. 6-64. http://www.unebook.es/es/ebook/nuevas-tendencias-en-olivicultura_E0002605410
Cano-Ortiz, A. 2007. Bioindicadores ecológicos y manejo de cubiertas vegetales como herramienta para la implantación de una agricultura sostenible. Tesis Doctoral. Universidad de Jaén.
Cano-Ortiz, A., Del Río González, S. and Pinto Gomes, C.J. 2013. Impact of soil texture on plant communities of Raphanus raphanistrum L. Plant Sociology 50 (2): 39-46.doi:10.7338/pls2013502/02
Fakhar-u-Zaman Akhtar, M., Muhammad Munir Anjum, Azhar Hussain (2016). Impact of integrated use of inorganic phosphorus and farm yard manure for improving growth of maize (Zea mays L.) under desert climate of Bahawalpur, Pakistan. Transylvanian Review 24 (10):2736-2744
Guerrero García, A. 1991. Nueva Olivicultura. Ed. Mundi-Prensa. pp. 1-271
Montero Burgos, J.L. and González Rebollar, J.L. 1983. Diagramas Bioclimáticos. Minsterio de Agricultura, Pesca y Alimentación. ICONA. pp. 1-379.
Ighbareyeh, J.M.H., Cano-Ortiz, A. and Cano, E. 2014a. Case Study: Analysis of the Physical Factors of Palestinian Biolcimate. American Journal of Climate Change 3:223-231. Published Online June 2014 in SciRes. http://www.scirp.org/journal/ajcc; http://dx.doi.org/10.4236/ajcc.2014.32021
Ighbareyeh, J.M.H., Cano-Ortiz, A. and Cano, E. 2014b. Biological and bioclimatic basis to optimize plant production: Increased economic areas of Palestine. Agricultural Science Research Journal 4 (1):10-20. Available online at http://www.resjournals.com/ARJ Ighbareyeh, J.M.H., Cano-Ortiz, A., Suliemieh, A.A.A.,
Ighbareyeh, M.M.M. and Cano, E. 2014c. Phytosociology with other characteristic biologically and ecologically of plant in Palestine. American Journal of Plant Sciences 5:3104-3118.
Published Online September 2014 in SciRes. http://www.scirp.org/journal/ajps;
http://dx.doi.org/10.4236/ajps.2014.520327
Kumar, A., Sharma, P. And Joshe, S. 2016. Assessing the Impacts of Climate Change on Land Productivity in Indian Crop Agriculture: An Evidence from Panel Data Analysis. J. Agr. Sci. Tech. 18: 1-13
Peters, K., Breitsameter, L. and Gerowitt, B. 2014. Impacto of climate change on weeds in agriculture: a review. Agrom. Sustain. Dev. 34:707-721. doi: 10.1007/s13593-014-0245-2.
Rivas Martínez, S. 1987. Mapa de series de vegetación de España a escala 1:400.000. Ministerio de Agricultura. Pesca y Alimentación. ICONA. pp. 1-208.
Rivas Martínez, S. 1996. Clasificación Bioclimática de la Tierra. Folia Botánica Matritensis 16: 1-32.
Rivas Martínez, S. and Loidi Arregui, J. 1999. Bioclimatoloy of the Iberian Peninsula. Itinera Geobotanica 13: 41-47.
Rivas Martínez et al. (2011). Mapa de series, geoseries y geopermaseries de vegetación de España. Parte II. - Itinera Geobotanica 18 (1): 5-424.