A Work Project, presented as part of the requirements for the Award of a Masters Degree in Finance from the Faculdade de Economia da Universidade Nova de Lisboa.
Alpha Generation with
Twitter’s
Daily Momentum
Miguel Maria Borges Leitão Leal da Costa; Student Number 14826
ABSTRACT
This thesis does not set out to focus on the dynamics relationship between Twitter and
stock prices, but instead tries to understand if using relevant information extracted from
tweets has the power to increase investors’ stock picking ability, and generate alpha in
portfolio’s choice relative to a benchmark. Despite the short period analyzed, it gives
promising results that the sentiment analysis performed by Social Market Analytics Inc.
applied to an equity portfolio, is able to generate positive abnormal returns, statistically
significant in and out of sample.
Keywords: Market Sentiment, Sentiment Analysis, Twitter, Stock Picking.
Acknowledgments
I am very grateful for the supervision of my advisor Professor Afonso Fuzeta Eça. I
would like to thank Dr. John Fox and Dr. Jeff Blaschak from Social Market Analytics
Inc. for all the support provided. I am very thankful for the invaluable support of my
I.
Introduction
While a single lost word might contain a negative or positive sentiment, two words may
have several interpretations, and Twitter works has a vast storehouse of public mood
that can be used to access what users are feeling, with 320 million active users sharing 1
billion tweets – short messages up to 140 characters – every day. Twitter offers “an
unprecedented opportunity to study human communication and social networks,”
(Miller, 2011). The prediction of the financial markets is a multibillionaire industry and many companies, with more or less success, have been trying to do this since the first
stock markets exchange were found, which has been a true challenge not only to
investors but also to researchers over the years. The study of social mood has been a
growing subject in the prediction of financial markets.
On the 23rd April, 2013 the Associate Press, a news’ agency founded in 1846 suffered
an e-crime. The hacker was able to publish a false statement through Associate Press’s
Twitter’s account stating that a terrorist attack on the White House had possible
happened. The S&P 500 index, in 4 minutes, suffered a loss of 136 billion dollars. This
amount was restored with the same velocity as it was lost, when the situation was taken
care of. Just as it happened with an index, so it can also happen with all companies
quoted on the stock market. More recently, a similar situation happened when Financial
Times published an inaccurate Tweet about the decision of the European Central Bank
to leave interest rates unchanged, which made markets to stir.
The price of a stock quoted on the stock market tends to fluctuate with the information
better maximize his returns. Hence, there is the need to be aware of the information
available, which is mostly released in the form of news.
When working with financial markets we can understand that it is through social media
platforms such as Twitter that journalists, private investors and all financial and
non-financial companies launch their information to the market in a quickly and concise
way. By analyzing millions of tweets it is possible to transform text into data organized
by entities, themes and concepts that after careful treatment allow us to obtain the
sentiment related to a company, to an industry, to a political party or a country. This
way, it is possible to detect what crowds are feeling. A good example of a company
being successful in predicting future price movements is the Cayman Atlantic Hedge
Fund, that presented its investor with Sharpe Ratios higher than 1 over the last 3 years.
A lot of doors were closed while trying to find how to work on this subject, until I met
Dr. John Fox from Social Market Analytics, Inc. (SMA). SMA produces a family of
metrics, called S-Factors that were designed to capture the signature of financial market
sentiment. SMA applies these metrics to data captured from social media sources to
estimate sentiment for indices, sectors, and individual securities. More specifically,
these metrics are estimated from analyzing tweets that are then converted into
actionable indicators.
SMA provided data for sentiment and volume. This company has patents on their
process and for that reason this thesis does not discloses information about specifics of
the data that was used, and is only be able to comment SMA’s process of sentiment
Moving forward in the analysis, the strategy that was built uses sentiment jointly with
volume, in order to assess if there is an upward or downward pressure for individual
stock prices to fluctuate. The strategy uses sentiment factors in order to determine, not
only when should an investor take a position in a particular stock, but also if the
direction of the position should be long or short according to a positive or negative
sentiment, respectively. The volume factor is used as a filter that imposes a limit on the
number of stocks in which one should invest, because this strategy tries to only invest in
stocks with robust sentiment factors extracted from a large number of tweets.
After building an investment strategy with factors provided by SMA, regression
analysis were performed in order to understand if the strategy has a statistical significant
alpha, in and out of sample. The additional return that is not explained by the market is
called abnormal return, or alpha, which results from the portfolio’s manager ability to
exploit opportunities arising on the market, and is frequently used as measure for assessing an active manager's performance, in relation to market returns. The conception and focus on alpha comes from the fact that during the twentieth century, stock investment managers were not making more money than investors who simple invest in the overall market. Since a positive and significant alpha allows concluding that looking at information from tweets increases the stock picking ability of an investor
who is able to correctly use it, this work’s investigates if strategies using tweets’
sentiment signals yield a robust alpha. Other metrics are also studied to prove this
strategy is as robust as possible.
The rest of the work follows this path: Section II reviews the relevant literature on this
methodology taken to perform the strategy and different techniques applied to better
understand the regressions’ results. Section V presents and discusses the results. Section
VI concludes this work.
II. Literature Review
Primarily, this thesis tries to establish a link with the literature that approaches findings
on market sentiment through social media platforms.
“In models of investor sentiment on stock market prices, uninformed traders rely on
various information sources in forming their beliefs. In equilibrium, their beliefs, albeit noisy, influence prices” (Sheng & Oh, 2011). This work tries to reinforce what other
researchers have studied, regarding subjects related to news that are spread in social media platforms, their relevance and usability for portfolio managers. Also, it tries to prove that stock discussions are not always noise, as Antweiler & Frank, 2004 proved.
The process of studying if Twitter has the power to exploit stock picking ability starts
with the sentiment analysis applied to tweets. After some research, one can find that
examples of pioneering uses for sentiment analysis are plentiful. Sentiment analysis is
being used as a tool in new industries and with different objectives such as preparing for
and avoiding scandals, in other words, taking a proactive position vs reactive position -
LEGO and Shell scandal 2014; or using healthcare records to improve practices and
process efficiency in healthcare services - Arizona Universtiy’ study on Sentiment
Analysis of Data Collected from Social Media for Improving Healthcare.
Different methods can then be employed to classify data, and researchers have been
classifiers, researchers need to train them in order to evaluate and improve their
effectiveness (Sebastiani 2002). From the research that was done, it can be understood
that there are a few key challenges for sentiment analysis in order to make a sentiment
analysis as robust as possible: 1 - “While machine do analytics, humans do analysis” by
Anjali Lai – improving the final outcome of a sentiment analysis is only possible with
years of experience; 2 - The analysis must treat carefully the accuracy of numbers in an
environment where it is possible to correlate everything against everything – a good
example is the Bank of England’s attempt to analyze whether Twitter could help predict
a bank run prior to the referendum for Scottish independence. A group of data analysts
at the bank decided to search for terms that showed fears over financial stability, linked
to Scotland and the referendum. They built a system that would analyze Twitter in real
time, looking for signals of bank runs by searching for key terms, like "runs" or RBS -
Royal Bank of Scotland. At the same day of the voting, the Minnesota Vikings and the
New England Patriots were playing on a Sunday evening and the reason the model
showed an increase in activity was due to fans tweeting about “runs” and “RBs” –
which refers to running backs, not The Royal Bank of Scotland.
Others researchers were interested in potential applications of Twitter information
rather than finance. Tumasjan et al. (2010) analyzed Twitter messages mentioning
politics information related and found that the number of tweets is able to reflect voters’
preferences. Also, Asur and Huberman (2010) tried show how social media can predict
future outcomes by predicting revenues of movies, and proved there is a strong
Another relevant issue that must be taken into account is the fact that one may argue
that individuals exploit social media tools such as Twitter by disseminating misleading
and speculative information to investors. However, previous research shows that the information on Twitter can help investors in their investment decision, and leads to the conclusion that Twitter can play a role in making the market more efficient (Bartov, Faurel and Mohanram, 2015).
“The three distinct characteristics of these tweets, succinctness, high volume and
real-time, greatly facilitate the diffusion of investing information in the community” (Oh and Sheng, 2011). With the dramatic increase in the use of social media, fact is that it transformed the capital markets in a way that firms use it to communicate with their investors’ base in a timely and cost effective way, and investors have a fast channel to
access information, share their information and insights about markets. Researchers found that the aggregate information contained in individual tweets helps to predict firms’ quarterly earnings (Bartov, Faurel, Lucile and Mohanram, 2015). This study
takes us to another type of analysis, and to believe in the concept of Wisdom of Crowds that refers to a phenomenon first observed by Sir Francis Galton, who studied the fact that a large group of problem-solvers thinking independently often makes a better collective prediction than that produced by experts, no matter how brilliant they are at solving problems:
“In 1907, Sir Francis Galton asked 787 villagers to guess the weight of an ox. None of
them got the right answer, but when Galton averaged their guesses, he arrived at a near
perfect estimate. This is a classic demonstration of the „wisdom of the crowd‟, where
A more broadly study was done (ECB 2015), which quantifies the effects of online
bullishness on international financial markets, by reporting the frequency of appearance of the terms bullish and bearish in Twitter content and Google over time. Their results support the investor sentiment theory (by De Long et al., 1990a), and suggest that Twitter bullishness may provide a useful and simple investor sentiment index. Not only leading indexes in the US but also in UK and Canada, and a very modest predictive value over Chinese market. Because people pay more attention to negative than positive news, a rational way of human thinking (Luo, 2007), leads investors to believe bullish sentiment to have a lower predictive accuracy than that of bearish sentiment. This thesis is able to understand that in general positive news/sentiment yield better returns rather than when looking at negative news/sentiment.
III. Data
SMA uses actionable intelligence from social media data by filtering out the noise to deliver clean data on sentiment for financial markets. More specifically, it produces a family of metrics, called S-Factors, designed to capture the signature of financial markets sentiment. They provided a set of data with daily frequency ranging from the 1st August 2013 to 22nd September 2015, with factors for sentiment and volume over all stocks on the S&P 500 index.
S&P 500 Index can be considered an excellent market to apply this study since the United States has the highest concentration of Twitter users in the world (Fiegerman, 2012; ECB, 2015) which allows us to believe that Twitter is more present in peoples’ lives than in any other country.
SMA has a three stage process to mine sentiment factors (S-Factors), not only from Twitter but also from StockTwits messages, composed by three stages: 1 - The Extractor: where the process starts by extracting all signals for designated financial terms and symbols with no filter; 2 - The Evaluator: where all tweets are analyzed for financial relevance – indicative tweets - using proprietary natural language processing algorithms. In this sample, the number of indicative tweets related to a stock in a given day ranges from 1 to 2520; 3 - The Calculator: which determines the sentiment signature for each stock using a sentiment dictionary adjusted for performance in the financial market domain.
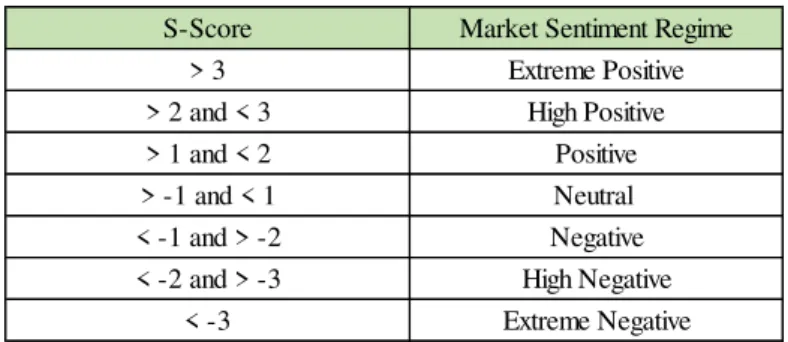
This process is done by gathering information into time period buckets based on the moment at which tweets were made public. Sentiment level for each word analyzed from a tweet is obtained from SMA’s sentiment dictionary, which has over 18,000 words and 400 two-word phrases that have content and sentiment levels of relevance to financial market activity.
S-Score Market Sentiment Regime
> 3 Extreme Positive
> 2 and < 3 High Positive > 1 and < 2 Positive > -1 and < 1 Neutral < -1 and > -2 Negative < -2 and > -3 High Negative
< -3 Extreme Negative
standard deviation. Positive S-Scores are associated with favorable changes in investor sentiment, while negative levels are associated with unfavorable changes – see table 1.
Table 1– Sentiment Regime
In order to run regressions with the portfolio’s returns and test the statistical significance of the alpha, Fama-French Factors with daily frequency were obtained from Kenneth R. French data library, as the series for momentum factor. The momentum factor added to Fama-French factors completes the Carhart Four-Factor Model.
IV. Methodology
In this section it is explained the investment strategy and outline some tests that were done in order to access if the strategy has a statistical significant alpha.
Secondly, the strategy looks to the volume of indicative tweets, from where sentiment signals were extracted to each stock, and ranks stocks according to the number of tweets that were published about them. This filter’s objective is to not only narrow the number of stocks to invest in, but also to make sure the sentiment being captured derives from a large sample of tweets, providing robustness to the analysis. In our base strategy we choose the top 15 stocks with the highest number of tweets, since it seems to be a reasonable number. These strategy uses signals collected before the market close, allowing the strategy to consider market closing prices as entry prices, and positions are held until the end of the next trading day. In order not to leverage the portfolio, daily returns are divided by the sum of long and short positions.
The reasoning behind the filter volume is similar to the S-score, and a simple concept to grasp, as the volume of tweets about some news or article of a company helps identify which tweets/news will have a more meaningful impact in sentiment – and therefore performance – of a stock. The final goal of these two filters is to only invest in stocks with robust sentiment factors extracted from a large number of tweets.
To access if this strategy yields positive and significant alphas, this work tries to identify and quantify the factors that determine the alpha of the strategy by utilizing
Carhart Four-Factor model, which adds the momentum factor to the Fama-French
model.
The order of importance that was followed to better understand the alpha was to, first run a t-test on portfolio’s return since it allows to statistically reject the hypothesis that they are zero:
Standard Error = √
Secondly, check if the alpha from both Fama-French and Carhart models’ regressions with portfolio’s returns is positive and significant, in and out of sample.
Finally, it is analyzed the Information Ratio (IR). While the Sharpe ratio assesses manager’s performance relative to risk taken, IR measures the ability and consistency to
generate excess returns relative to a benchmark, computed this way:
The information ratio provides a good measurement on portfolio manager’s skills and consistency relative to a benchmark.
V. Results
S-FF Regression HML SMB MKT Alpha Coefficient 0,1938 0,0501 0,6009 0,1659%
t-statistic 1,2617 0,4041 8,3740 2,8785
Since our goal is to prove that the strategy is able to generate alpha, we do not take into account transaction costs. With an S-Score of 2.5/-2.5 as a filter for sentiment with 1 day lag, and 15 stocks as a filter for volume, the base strategy yields a Sharpe ratio of 1.7198 with an annualized return of 32.68% and 19.00% annualized volatility over the 3 years’ period being analyzed, compared to the S&P500 index, our benchmark, which yields a Sharpe ratio of 0.5448 with an annualized return of 7.08% and 12.90% annualized volatility. Graph 1 plots the cumulative return of our base strategy, and the cumulative return of the S&P 500 index during the period in analysis.
Graph 1 – This graph plots both cumulative returns of our base strategy and S&P 500 during the period being analyzed – 1/08/2013 to 22/09/2015.
The t-test done on portfolio’s returns is 2.98, which tells us that our returns are statistically different from zero. The next step was to regress the portfolio’s returns on Fama-French 3 Factor model (table 2.1).
The fact that the alpha is significant (t-statistic > 1.96) indicates a daily outperformance of 0.1659% with regards to Fama-French model. From the table above, we can see that all 3 factors are positive, but only the market beta is significant. This positive market beta means that returns are explained by the market, and one possible reason might be due to the volume filter used in this strategy since Google, Facebook, Amazon and Apple are examples of stocks that have a higher volume of tweets compared to other stocks, and represent a relevant share of the market.
Table 3.1 - This table shows the coefficients, alpha and their significance, of the regression of the entire sample of our portfolio's returns with the Carhart model.
Regarding the regression with the Carhart model, which adds the momentum factor to the 3 factor model, both market beta and alpha are slightly higher and significant when compared to Fama-French results (table 3.1). The t-statistic of alpha indicates that the portfolio daily outperforms the Carhart model by 0.1706%. We can also see that the momentum factor is significant but negative. One possible reason for the negative beta of momentum can be that we are going long/short in stocks with good/bad momentum on Twitter sentiment, but these stocks in general have performed badly/well in the past. The fact that we are using daily data, and the Carhart model takes into account monthly momentum, is a possible reason to explain the apparent negative correlation between the two factors, given that in this strategy the idea is to take advantage of very short term sentiment changes – daily Twitter momentum.
Since the momentum factor is significant, we are not going to analyze the Fama-French
Carhart MOM HML SMB MKT Alpha Coefficient -0,3201 -0,0637 0,0365 0,6280 0,1706%
the 2nd half and last 6 months of the sample - tables 3.2 and 3.3 respectively.
Table 3.2 - This table shows the coefficients, alpha and their significance, of the regression of the 2nd half of our portfolio's returns with Carhart model.
Table 3.3 - This table shows the coefficients, alpha and their significance, of the regression of the last 6 months of our portfolio's returns with Carhart model.
Regarding alphas, and taking into account that we are looking at a 3 years period, the fact that both in and out of sample analysis show a positive and significant alpha proves that, with a proper sentiment analysis, such as the one implemented by Social Market Analytics, an investor is able to improve his stock picking ability. Regarding the coefficient of determination (R2), which tests the goodness of fit of the model, as expected it is always low (<16%), since we have positive and significant alphas.
A sensitivity analysis is now going to study how different inputs impact our results. In short, it was found that the best way to build a strategy with Twitter’s signals is to take into account the sentiment factor yielded for the day, and consequently taking positions before the market close and hold them until the end of the next trading day (1 day lag) – results on table 4.1. By looking at table 4.2 and following analysis, it is possible to understand that considering the average of the sentiment factor during a look back period, for example, the day before (2 days lag) does yield positive but poorest results compared to 1 day lag – results on table 4.2. When looking at the average of the sentiment factor with 3 days lag, the strategy loses all its Sharpe Ratio, significance of returns and alphas.
Carhart MOM HML SMB MKT Alpha
Coefficient -0,7515 -0,6385 0,0114 0,7054 0,3890%
t-statistic -2,6588 -1,3360 0,0308 4,0584 2,4654
Carhart MOM HML SMB MKT Alpha
Coefficient -0,3715 -0,1063 -0,0126 0,7048 0,2787%
Table 4.1 – This table presents a sensitivity analysis on Sharpe ratios using different sentiment signals and volume filters, with 1 day lag.
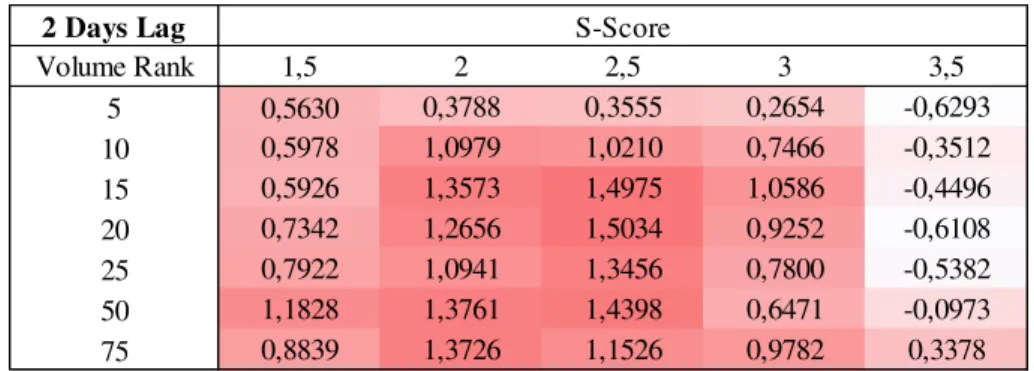
Table 4.2 - This table presents a sensitivity analysis on Sharpe ratios using different sentiment signals and volume filters, with 2 days lag.
From tables 4.1 and 4.2, we can see that Sharpe ratios are higher when using 1 day lag instead of 2 days lag. It can be concluded that sentiment factors are quite short term, which makes sense since Twitter reactions are usually very momentary.
Tables 5.1 and 5.2 show the t-test that was done to prove which inputs lead to a series of the portfolio’s returns that are statistically different from zero. It is possible to see that
different strategies with 1 day lag (table 5.1) have a higher number of inputs leading to portfolio’s returns that are statistically different from zero, when compared with 2 days
lag (table 5.2). T-tests results are also higher, and the higher the t-test the higher is the significance. This comparison of statistical significance of portfolio’s returns with 1 day lag versus 2 days lag, is in accordance with previous conclusions from tables 4.1 and
1 Day Lag
Volume Rank 1,5 2 2,5 3 3,5
5 0,4152 0,5028 0,6706 0,8732 0,6990
10 1,0690 1,2514 1,1991 1,3230 1,1217
15 1,0864 1,6477 1,7198 1,5608 1,1631
20 1,1022 1,3780 1,6286 1,5900 1,4891
25 1,1876 1,3035 1,6718 1,6846 1,4685
50 1,3008 1,0958 1,2892 1,3918 1,3912
75 0,9839 1,1226 1,0952 1,1560 1,2204
S-Score
2 Days Lag
Volume Rank 1,5 2 2,5 3 3,5
5 0,5630 0,3788 0,3555 0,2654 -0,6293
10 0,5978 1,0979 1,0210 0,7466 -0,3512
15 0,5926 1,3573 1,4975 1,0586 -0,4496
20 0,7342 1,2656 1,5034 0,9252 -0,6108
25 0,7922 1,0941 1,3456 0,7800 -0,5382
50 1,1828 1,3761 1,4398 0,6471 -0,0973
75 0,8839 1,3726 1,1526 0,9782 0,3378
Table 5.1 – This table presents a sensitivity analysis for the statistical significance of portfolio’s returns, using different sentiment signals and volume filters with 1 day lag. A t-test > 1.96 allows to statistically reject the hypothesis that portfolio’s returns are zero.
Table 5.2 - This table presents a sensitivity analysis for the statistical significance of portfolio’s returns, using different sentiment signals and volume filters with 2 days lag. A t-test > 1.96 allows to statistically reject the hypothesis that portfolio’s returns are zero.
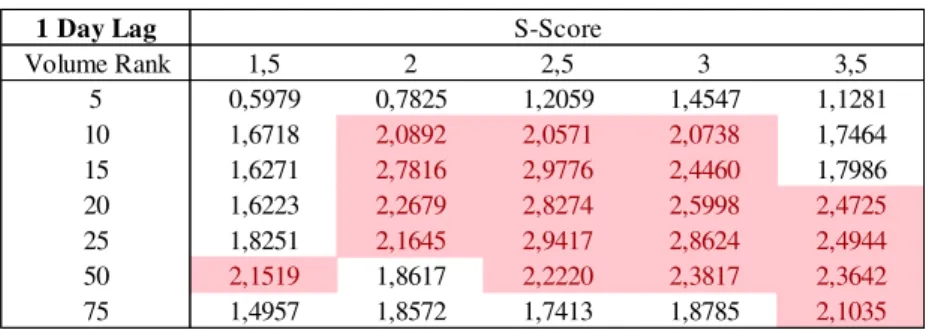
Since previous regressions showed a significant momentum factor, and taking into consideration that alphas are always positive, on tables 6.1, 6.2 and 6.3 we analyze the significance of alphas from regressions with the Carhart model, with 1 day lag.
Table 6.1– This table presents a sensitivity analysis, using different sentiment signals and volume filters using 1 day lag, for the significance of the alpha computed from the regression of the entire sample of portfolio’s returns with the Carhart model.
Every analysis that was done so far, including results from table 6.1, support our predictions on which inputs should be used. Also, table 6.1 reinforces that fact that 1
1 Day Lag
Volume Rank 1,5 2 2,5 3 3,5
5 0,7188 0,8704 1,1608 1,5115 1,2100
10 1,8504 2,1660 2,0755 2,2900 1,9416
15 1,8804 2,8521 2,9768 2,7017 2,0132
20 1,9078 2,3852 2,8190 2,7522 2,5775
25 2,0556 2,2563 2,8938 2,9160 2,5419 50 2,2517 1,8967 2,2315 2,4091 2,4080
75 1,7031 1,9432 1,8958 2,0010 2,1125
S-Score
2 Days Lag
Volume Rank 1,5 2 2,5 3 3,5
5 0,9746 0,6558 0,6154 0,4593 -1,0893
10 1,0347 1,9005 1,7672 1,2924 -0,6079
15 1,0257 2,3494 2,5920 1,8324 -0,7782
20 1,2708 2,1907 2,6023 1,6015 -1,0572
25 1,3712 1,8939 2,3291 1,3501 -0,9316
50 2,0473 2,3819 2,4922 1,1201 -0,1683
75 1,5300 2,3759 1,9951 1,6932 0,5846
S-Score
1 Day Lag
Volume Rank 1,5 2 2,5 3 3,5
5 0,5979 0,7825 1,2059 1,4547 1,1281
10 1,6718 2,0892 2,0571 2,0738 1,7464
15 1,6271 2,7816 2,9776 2,4460 1,7986
20 1,6223 2,2679 2,8274 2,5998 2,4725
25 1,8251 2,1645 2,9417 2,8624 2,4944
50 2,1519 1,8617 2,2220 2,3817 2,3642
75 1,4957 1,8572 1,7413 1,8785 2,1035
day lag’s strategies show robust results regarding investment performance, and
statistical significance of portfolio returns and alpha.
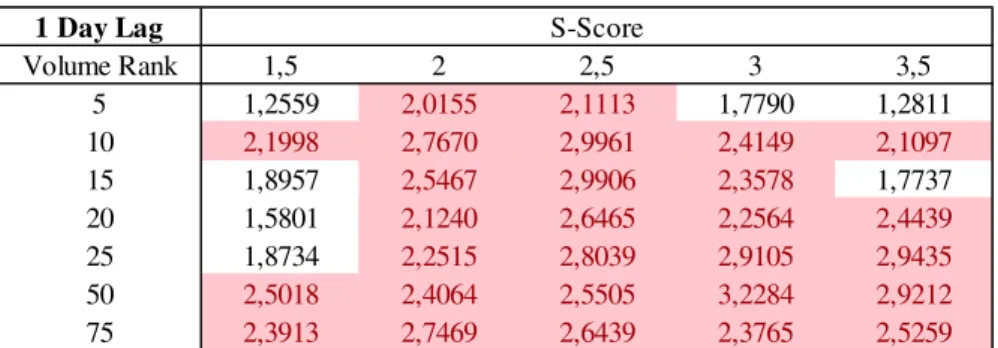
On table 6.2 and 6.3 you can see the significance of the alpha of two regressions made out of sample - for the 2nd half and last 6 months of the sample, respectively. Once again, only 1 day lag strategy is presented since the 2 days lag strategy yields positive alphas but with no significance. In a strategy with 3 days lag, all relevant indicator is lost.
Table 6.2– This table presents a sensitivity analysis, using different sentiment signals and volume filters using 1 day lag, for the significance of the alpha computed from the regression of the 2nd half of the portfolio’s returns with the Carhart model.
Table 6.3– This table presents a sensitivity analysis, using different sentiment signals and volume filters using 1 day lag, for the significance of the alpha computed from the regression of the last 6 months of the portfolio’s returns with the Carhart model. (The last 6 months of the sample have less than 200 observations, which means that alphas are only significant if t-statistic is higher than 1.98).
1 Day Lag
Volume Rank 1,5 2 2,5 3 3,5
5 1,2559 2,0155 2,1113 1,7790 1,2811
10 2,1998 2,7670 2,9961 2,4149 2,1097
15 1,8957 2,5467 2,9906 2,3578 1,7737
20 1,5801 2,1240 2,6465 2,2564 2,4439
25 1,8734 2,2515 2,8039 2,9105 2,9435
50 2,5018 2,4064 2,5505 3,2284 2,9212
75 2,3913 2,7469 2,6439 2,3765 2,5259
S-Score
1 Day Lag
Volume Rank 1,5 2 2,5 3 3,5
5 2,0331 2,0968 2,1791 1,7790 0,9953
10 2,5463 2,4603 2,6250 1,9788 1,3399
15 2,2857 2,2755 2,4654 1,3748 0,8125
20 1,8480 2,0557 2,2199 1,2460 1,2506
25 1,8573 2,0976 2,3046 1,2941 1,2519
50 2,4482 2,3789 2,0870 1,4867 1,1867
75 2,9984 3,2778 2,4736 1,2987 0,9025
Table 6.2 confirms the fact that alphas are still significant on strategies using several different inputs when regressing the second half of our returns. Table 6.3 shows that with an S-Score of 3 (extreme positive/negative sentiment regime), strategies loose significance when regressing only the last 6 months of the strategy’s returns, which are not as good results as the ones yielded so far, but it must be taken into that an S-Score of 3 is an extreme sentiment regime and the period in analysis is short.
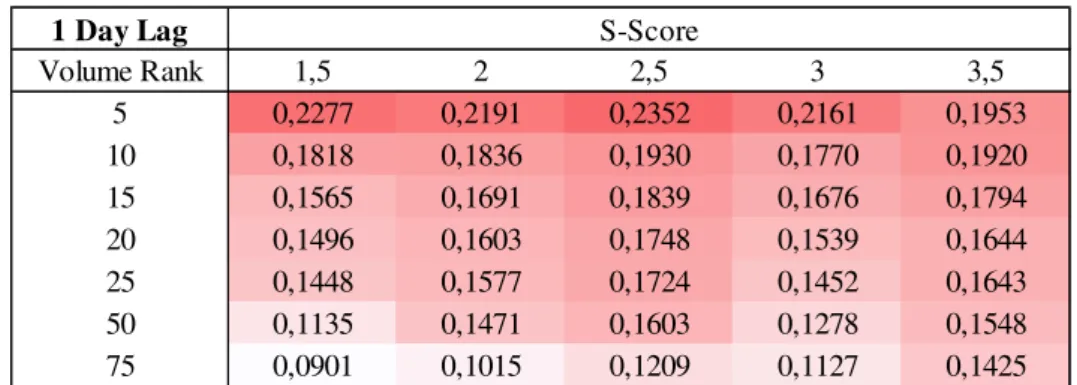
Information Ratio Analysis
“Information Ratio is the key to value added”, by Grinold and Khan (2000). IR is widely used and it is a powerful tool to evaluate portfolio managers’ skills. So that you
can better evaluate information ratios present on table 7, Grinold and Kahn (2000) studied that an information ratio greater than 0 indicates that a portfolio manager has performed in the top 50% of the population, above 0.5 means that the manager performed in the top 75% of the population.
Table 7 – This table presents a sensitivity analysis on Information ratios resulting from strategies using different sentiment signals and volume filters, with 1 day lag.
The above table allows to conclude that managers using signals for sentiment would perform above average, and strategies using S-Scores of 2.5 and volume filters for 5 stocks have best ratios. This level for sentiment is in line with previous analysis, but the
1 Day Lag
Volume Rank 1,5 2 2,5 3 3,5
5 0,2277 0,2191 0,2352 0,2161 0,1953 10 0,1818 0,1836 0,1930 0,1770 0,1920 15 0,1565 0,1691 0,1839 0,1676 0,1794 20 0,1496 0,1603 0,1748 0,1539 0,1644 25 0,1448 0,1577 0,1724 0,1452 0,1643 50 0,1135 0,1471 0,1603 0,1278 0,1548 75 0,0901 0,1015 0,1209 0,1127 0,1425
volume filter is not. If keeping the S-Score fixed while increasing the number of stocks of the volume filter, it is possible to observe a stable annualized return and a steadily decreasing annualized volatility. Taking this into account, and looking at the IRs above 0.2, allows to conclude that although the volatility of excess returns is lower (resulting in high IR), this is only achieved with high levels of volatility on portfolio’s returns. A possible reason to explain the above analysis is that there are optimal levels for volume filters, and a number of stocks in which we want to invest, that increase levels of diversification on the portfolio and consequently increasing a unit of return per unit of risk – which is in line with previous analysis.
General Sentiment on S&P 500 Index
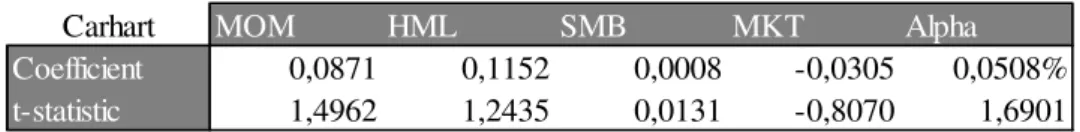
Another example of a strategy that was done using only signals for sentiment, was to take into account the average of sentiment of all stock in an index, an average sentiment of the S&P 500: if the average sentiment is >0 the investor decides to go long on the index, and in case the average is <0 the investor goes short. This strategy yields a Sharpe ratio of 0.8516, outperforming the index by an annualized return of 1.82% over the 3 years of the sample (8.90% vs 7.08%), with lower levels of volatility (10,45% vs 12.90%). Although these are interesting results, this series of returns is not statistically different from zero, and the regression with the Carhart model tells us that none factor or the alpha is significant:
Table 8 - This table shows the coefficients, alpha and their significant, of the regression with the portfolio returns that takes into account the average sentiment of the S&P500 Index, with the Carhart model.
Carhart MOM HML SMB MKT Alpha
Coefficient 0,0871 0,1152 0,0008 -0,0305 0,0508%
Different reactions on positive vs negative news
One final remark regarding this work’s conclusions has to do with the fact that it is widely believed that people react more aggressively to negative news, compared to reactions on positive news. On Chart 2 you can see a decomposition of returns resulting from long and short positions on our base strategy, showing that the most relevant part of returns is coming from taking long positions derived from positive sentiment signals. Further analysis was not done on a long-only portfolio, since it was proved in an early stage that returns were not statistically different from zero and alphas were also not robustly significant.
Graph 2– This graphs presents the decomposition of cumulative returns yielded from long positions vs short positions of our base strategy.
VI. Conclusion and Future Directions
“Using Twitter to track the mood of nations is analogous to using satellites to track the
atmosphere”, (Dodds, 2011).
performance relative to a specified benchmark by increasing investors’ stock picking ability.
This work’s results appear to support the hypothesis role of investor sentiment in behavioral finance, which has origin from a unique set of factors for sentiment and volume provided by Social Market Analytics Inc. that were used to build an investment strategy. The strategy is proved to have a positive and significant alpha in and out of sample with Fama-French and Carhart models regressions. These results add evidence of the powerful insights that can be extracted from social media sentiment to maximize profits, by improving investors’ stock picking skills. From these results, we can also make inferences on the possibility that social media can be used in other areas of study such as business and health.
Regarding sentiment analysis, and the tool used to extract sentiment from Twitter, this work proves that SMA does it with success. The research that was done to work on this project allows one to believe that the sentiment analysis is only good if, when applied, shows positives outcomes, such as this strategy’s results.
References:
Antweiler, Werner. And Murray, Z. Frank. 2004. “Is All that Talk just Noise? The
Information Content of Internet Stock Message Boards.” Journal of Finance. 36.
Bartov, Eli. Faurelm, Lucile. Mohanram, Parthar. 2015. “Can Twitter Help Predict
Firm-Level Earnings and Stock Returns?”. 43.
Chahal, P. Kaur.2015. “Sentiment Analysis of Data Collected from Social Media for
Improving HealthCare”. The School of Engineering & Computing Sciences Texas. 43.
Dodds, Peter.2011. “Temporal patterns of happiness and information in a global social
network: Hedonometrics and Twitter”. Social and Information Networks. 27.
Fiegerman, Seth. 2012. “Twitter now has more than 200 million monthly active
Users,”.18.
Georg Aase, Kim. 2011. “Text Mining of News Articles for Stock Price Predictions”.
Norwegian University of Science and Technology. 84.
Grinold, Richard C. and Ronald N. Kahn. 2000. “Active Portfolio Management”. New
York: McGraw-Hill. 621.
Huang, Lei. Bhayani, Richa. Go, Alec.2009. “Twitter Sentiment Classification using
Distant Supervision”. Stanford University. 6.
Huberman, Bernardo A. and Asur, Sitaram. 2010. “Predicting the Future With
Social Media”. Social Computing Lab Palo Alto, California. 8.
Luo, X. 2007. “Consumer Negative Voice and Firm-Idiosyncratic Stock Returns”
Journal of Marketing. 88.
M. Romero, Daniel. Galuba, Asur, Huberman. 2010. “Influence and Passivity in
Mao, Counts and Bollen from ECB. 2015. “Quantifying the effects of online
bullishness on international financial markets”. 23.
Miller, Greg. 2011. “Social scientists wade into the Tweet stream,” Science, volume
333, number 6051. 2.
Oh, Chong. and Sheng Olivia. 2011. “Investigating Predictive Power of Stock Micro
Blog Sentiment in Forecasting Future Stock Price Directional Movement”. Thirty
Second International Conference on Information Systems. 19.
Richard C. Grinold, Ronald N. Kahn. 1995. “Active Portfolio Management”. The
Journal of Finance. pp. 1559-1562.
Sàágua, João.2014. “Exploring the Predictive Power of Google Searches over the US
Stock Market”. Nova School of Business and Economics. 62.
Sebastiane, Fabrizio. 2002. “Machine Learning in Automated Text Categorization”.
Consiglio Nazionale delle Ricerche, Italy. 47.
Shleifer, Summers, Waldmann and J. Bradford De Long.1990. “Noise Trader Risk
in Financial Markets”. Journal of Political Economy. 738.
Sitaram, Huberman, Galuba, M. Romero, Daniel.2010. “Influence and Passivity in
Social Media”. 9.
Tumasjan, Andranik. Sprenger, Sandner and Welpe. 2010. “Predicting Elections
with Twitter: What 140 Characters Reveal about Political Sentiment”. Technische
Universität München. 8.
Zheludev, Ilya, Smith, Robert and Aste, Tomaso.2014. “When can social media lead