i
SYSTEM FOR FRAUD DETECTION: CUSTOMER
SEGMENTATION AND PREDICTIVE ANALYSIS
Carolina
Sottomayor Moser Machado
VIA-VERDE PORTUGAL
Project Work presented as partial requirement for obtaining
the master’s degree in Information Management
i
Instituto Superior de Estatística e Gestão de Informação
Universidade Nova de Lisboa
CUSTOMER SEGMENTATION AND PREDICTIVE ANALYSIS OF VIA
VERDE
by
Carolina Sottomayor Moser Machado
Project Work presented as partial requirement for obtaining the master’s degree in Information Management, with a specialization in Knowledge Management and Business Intelligence.
Advisor: Prof. Rui Alexandre Henriques Gonçalves
ii
ACKNOLEDGMENTS
I would like to express my gratitude to all those which have supported, helped, commented or otherwise assisted me throughout the process.
First, I would like to thank my supervisor Professor Rui Gonçalves who helped me throughout this process with his guidance, knowledge, and advices.
Additionally, I would like to thank the University Nova Information Management School and all professors that thought me during this master’s degree as their courses have contributed with knowledge presented in this work project.
Furthermore, given the consulting nature of this project, I appreciate all contributions received by Via Verde Portugal that provided information and data regarding the toll industry. This includes a special thank you to Eng.ª Margarida Cordeiro and Susana Ferraz.
Finally, I appreciate the support and the information sharing that I felt from my Brisa colleagues and most importantly, I thank my friends and family for listening to me and encouraging me to do my best. None of this could have happened without all of them.
iii
ABSTRACT
Brisa - the largest Portuguese motorway operator in Portugal - focus on these main factors: the digital world, the affirmation of individual choice, the transport integration, the collaborative business models and the sharing economy. These are some of the aspects that make Brisa a benchmark of the motorway sector at an European level.
Consistent with this vision, Via Verde was created in 1991 and has been growing since then. Via Verde's mission is to make customers lives more practical. It offers greater speed and convenience to its customers, through faster ways of payment. In the end of 2018, Via Verde had 3.4 million of active identifiers, "the result of customer growth with 261 thousand new net subscribers compared to 2017", said Brisa's mobility services collection company. [2019]
Based on the relevant concepts of information, knowledge and intelligence associated with Data Mining, this paper seeks to identify and describe the practical applicability of this information technology in current and relevant areas of the company activity.
The initial phase of the study began with a literature review focused on the techniques and approaches behind the predictive analysis. This was followed by the data collection and validation process. The data collection phase is of great importance in the elaboration of any scientific research and all the care with this phase aims to guarantee the quality of the information. The data used in this dissertation was mainly provided by the company in study – Via Verde Portugal - and is a sample of 406 Million transactions for the year of 2017. The final stage consisted of a study caused by the processing of data and the development of the most appropriate model.
KEYWORDS
Beacon Technology; Payment Risk; Customer Segmentation; Fraud; Predictive Model; Neural
Networks; Decision Trees; Regression;
iv
INDEX
1.
INTRODUCTION ... 1
1.1. Background and Theoretical Framework ... 1
1.2. Company History ... 1 1.3. Problem Identification ... 3 1.4. Study Objectives ... 4
2.
LITERATURE REVIEW ... 6
2.1. Operational Risk ... 6 2.2. Fraud ... 9 2.3. Payment Fraud ... 132.4. Analytical Methods for Fraud Detection in Payment ... 13
2.4.1. Data Mining Processes ... 15
2.4.2. Predictive Models ... 18
2.4.2.1. Defining the Target ... 19
2.4.2.2. Logistic Regression ... 20
2.4.2.3. Decision Trees ... 21
2.3.2.3.1. Decision Trees Representation ... 21
2.3.2.3.2. Growing a Decision Tree ... 22
2.4.2.4. Artificial Neural Networks ... 26
2.4.2.5. Ensemble Models ... 29
3.
METHODOLOGY ... 32
3.1. Research Methodology ... 32
3.2. Data Collection Process ... 32
3.3. Modelling ... 33 3.3.1. Sample ... 33 3.3.1.1. Variables ... 33 3.3.1.2. Sampling Techniques ... 34 3.3.1.3. Normalization ... 36 3.3.2. Explore ... 37 3.3.3. Modify ... 41
3.3.3.1. Target Variable - Binary ... 42
3.3.3.2. Dimensionality Reduction ... 42
3.3.3.3. Outliers ... 42
v
3.3.4. Model and Assess ... 44
3.3.4.1. Error Rate ... 45
3.3.4.2. Accuracy ... 46
3.3.4.3. Other Measures ... 46
3.3.4.4. ROC Curve and AUC (Area Under Curve) ... 47
4.
RESULTS AND DISCUSSION ... 48
5.
CONCLUSIONS ... 54
6.
LIMITATIONS AND RECOMMENDATIONS FOR FUTURE WORKS ... 58
7.
BIBLIOGRAPHY ... 59
vi
LIST OF FIGURES
Figure 1 - “From the infrastructures era to the Mobility era” (Source: Author elaboration) .. 2
Figure 2 - Evolution over the years of 2016 and 2017 (Source: Author elaboration, using data
from 2016 and 2017 from Via Verde Portugal) ... 4
Figure 3 - Reasoning Process (Source: Author elaboration) ... 5
Figure 4: The “4-Cause Definition” of Operational Risk According to Basel (Source: Guidelines
on Operational Risk Management, Oesterreichische Nationalbank (OeNB), 2006) ... 7
Figure 5 - Fraud Triangle Model (Source: Source: Wells, J. T., 2005. Principles of fraud
examination. Hoboken, New York: John Wiley and Sons) ... 10
Figure 6 - Top Merchants Affected by Fraud Transactions (Source: ONLINE PAYMENT FRAUD
WHITEPAPER, 2015) ... 13
Figure 7 - CRISP-DM Life Cycle (Source: Adapted from R. Wirth and J. Hipp, "CRISP-DM:
Towards a standard process model for data mining") ... 16
Figure 8 – SEMMA (Source: Adapted from A. I. R. L. Azevedo and M. F. Santos, "KDD, SEMMA
and CRISP-DM: a parallel overview”) ... 17
Figure 9 - Data Triangle methodology (Source: Author elaboration, using information from
Reeve A. (2013). “Managing Data in motion: Data Integration. Best Practice Techniques
and Technologies”. 152-154) ... 19
Figure 10 - Sigmoid Function ... 21
Figure 11 - Illustration of the Decision Tree (Source: SAS Institute) ... 22
Figure 12 - Entropy of a Binary Variable ... 23
Figure 13 - CHAID structure - Decision Tree example (Source: Author elaboration) ... 25
Figure 14 - CART structure - Decision Tree example (Source: Author elaboration) ... 25
Figure 15 - Artificial Neural Network Representation ... 27
Figure 16 - Backpropagation Algorithm ... 27
Figure 17 - Step Activation Funtion ... 28
Figure 18 - Sigmoid Activation Funtion ... 28
Figure 19 – Tanh Activation Function ... 29
Figure 20 - ReLU Activation Function ... 29
Figure 21 - Bagging Method (Source: Author elaboration, using information from Bulhmann,
P. (2012). “Bagging, Boosting and Ensemble Methods”) ... 30
Figure 22 – Boosting Method (Source: Author elaboration, using information from Bulhmann,
P. (2012). “Bagging, Boosting and Ensemble Methods”) ... 31
Figure 23 - Stacking Method ... 31
vii
Figure 25 - Analytical Model used in the study ... 33
Figure 26 - Distribution of the dataset according to the dependent variable (Debt) ... 34
Figure 27 – SMOTE (Source: Made by Author) ... 35
Figure 28 - SMOTE steps (Source: Made by Author) ... 36
Figure 29 - Multi-Class Dependent Variable (Source: Made by the author, PowerBI) ... 37
Figure 30 - Binary Dependent Variable (Source: Made by the author, PowerBI) ... 37
Figure 31 – Influence of Transaction Payment Method Variable (Source: Made by the author,
PowerBI) ... 38
Figure 32 - Transaction Payment Method by Target Variable (Source: Made by the author,
PowerBI) ... 38
Figure 33 - Influence of the Date Variable by Day of the Week (Source: Made by the author,
PowerBI) ... 39
Figure 34 - Influence of the Date Variable by Day of the Month (Source: Made by the author,
PowerBI) ... 39
Figure 35 - Influence of the Tariff Class (Source: Made by the author, PowerBI) ... 39
Figure 36 - Influence of the Rescission Date Variable (Source: Made by the author, PowerBI)
... 40
Figure 37 - Influence of the Type of Client Variable (Source: Made by the author, PowerBI) 40
Figure 38 – Number and Value of Observations per Client (Source: Made by the author,
PowerBI) ... 41
Figure 39 - Binary Target Variable Code ... 42
Figure 40 - Partitions used in the Predictive Model ... 43
Figure 41 – ROC Curve (Source: Made by the author) ... 47
Figure 42 – Predictive Models ROC Curve (Source: SAS Miner)... 49
Figure 43 – SAS Segment Size Profile (Source: SAS Miner) ... 52
viii
LIST OF TABLES
Table 1 - Number of Via Verde enrollments (Source: Author elaboration, using data from 2013
to 2017 from Via Verde Portugal) ... 2
Table 2 - The Seven Operational Risk Event Types Projected by Basel II (Source: Bielski, 2003;
BdP, 2010 e BCBS, 2004) ... 8
Table 3 - CRISP-DM & SEMMA (Source: Adapted from SAS) ... 18
Table 4 - Comparison of CHAID vs CART algorithm (Source: Author elaboration, , using
information from Lu, Y. (2015). “Decision tree methods: applications for classification and
prediction”, Shanghai Archives of Psychiatry, 130-133) ... 26
Table 5 - Data Partition ... 43
Table 6 – Confusion Matrix ... 45
Table 7 – Statistic Comparison [Fit Statistic: _AUR_] ... 49
Table 8 – Statistic Comparison [Fit Statistic: GAIN and LIFTC] ... 50
Table 9 – Ensemble 10 Confusion Matrix ... 51
Table 10 – Neural 10 Confusion Matrix ... 51
Table 11 – Predictive model error rate for the binary dependent variable ... 55
ix
LIST OF ABBREVIATIONS AND ACRONYMS
BCBS Basel Committee on Banking Supervision CART Classification and Regression Trees
CHAID Chi-Square Automatic Interaction Detection DT Decision Trees
MLP Multi-Layer Perceptron VVP Via Verde Portugal
1
1. INTRODUCTION
This first chapter consists of a brief contextualization of the business, the background and the problem description. The main objectives are also presented below.
1.1. B
ACKGROUND ANDT
HEORETICALF
RAMEWORKTo survive in today’s competitive market, a company needs adequate technology to innovate the services and products it offers. Industrial Revolution in the mid-eighteenth century made a profound impact on the productive process, which reached both the economic and social levels. Since then, technology has been a part of the evolution of the companies. Every day companies are forced to adopt new technologies, which is necessitated by the society that is going through rapid changes. The challenge that big data is posing will continue to be one of the most exciting opportunities for the next years.
In the very world where the boundaries between industries, technologies and regulatory bodies are becoming increasingly indistinct, fraudsters are looking for soft targets to attack beyond their traditional ways. In PwC’s 2018 Global Economic Crime and Fraud Survey, only 49% of global
organizations admitted to having fallen victim to fraud and economic crime. However, Didier Lavion, the Principal of the Global Economic Crime and Fraud Survey Leader, says that that number should be much higher – about 51%. (PWC, 2018)
Naturally, the use of big data has become indispensable for the prevention of fraud. Existing technologies are now enough to analyse the data generated today. However, the future is still an unknown environment, and it is important for companies to recognise the benefits that these new technologies will bring to their businesses and should be encouraged to exploit these techniques. It is possible to gain a comprehensive look at all the channels connected by the clients that will be seen in a unique way, regardless of the connection. (Accenture Consulting, 2018)
A greater amount of information will be generated to outline the fraudster's profile and treat the customers differently, and new information will be added to the fraud prevention process.
Furthermore, the speed of identifying these activities will increase, generating financial benefits for the companies and their customers. (Accenture Consulting, 2018)
1.2. C
OMPANYH
ISTORYBrisa Portugal Highways (Brisa Autoestradas de Portugal) was founded in 1972, leading the market and establishing a recognized operational model for road infrastructures.
Due to the rapid evolution of technology, companies of all kinds face an increasingly competitive environment and more globally dispersed competition (Porter, 1990). To satisfy customer requirements while competing with other companies, it is important to create and develop an efficient flow that ensures the production of first-class products (Wann-Yih et al., 2004). These characteristics define a new era, in which the concept of mobility has taken on a broader significance whilst it has also introduced new challenges. Via Verde was born in this new era, in 1991, by relying on an innovative electronic payment system: Beacon technology.
2 Initially, Via Verde was created to prevent delays on toll roads and bridges by collecting tolls without requiring cars to stop. A tag is attached to the vehicle’s windshield that transmits information about the vehicle, and the toll amount is debited directly from the driver’s bank account. This payment involves no administrative costs and a fully integrated, cross-bank network.
For example, using the toll roads is the fastest way to get around Portugal: a drive from Lisbon to Aveiro, for example, would take just under 3 hours on the toll roads but around 5 and a half hours on the non-toll roads1
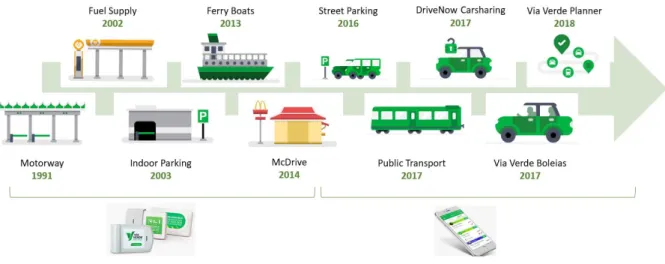
Currently, with recent updates to its system, Via Verde offers other services in addition to the collection of motorway tolls, such as ex-SCUTS, electronic fuel payment, and car park fee payment. Over the years, Via Verde has become part of the daily routine of road users. It began with the development of a set of services under the Via Verde brand that use a collaborative ecosystem logic—functionalities and services that are complementary to each other, some operated directly by Via Verde, others integrated through a platform such as Via Verde Planner.
Figure 1 - “From the infrastructures era to the Mobility era” (Source: Author elaboration)
These developments have had a significant impact on Via Verde’s financial performance in recent years.
Year
Number of Enrollments
2013
96.4k
2014
107k
2015
128.5k
2016
167.2k
2017
174.9k
Table 1 - Number of Via Verde enrollments (Source: Author elaboration, using data from 2013 to 2017 from Via Verde Portugal)
3 However, along with company growth has come the risk of non-payment by customers. It is
important to mention that, of Via Verde’s more than 759.700 clients, 55.700 clients have rescinded the contract—some forced by payment failure, the last phase of an infringement procedure, others by option.
When an infringement occurs is necessary to investigate what is the situation and how often it occurs. There are two main paths when analyzing infringement:
• When relates to McDrive, Gas Supply, Indoor Car Parking, Ferries, the service will be blocked, and no further use will be possible until the client regulates the situation.
• If is regarding the highway tolls the situation changes, since there is no physical way to stop vehicle to pass (e.g. toll barrier). This happens when there is a problem of registration of the transaction (registration of the vehicle that does not coincide with the registration in the contract, non-payment of transactions, alteration of the Multibanco card associated with the contract, or other reason) is triggered a yellow signal to warn of this problem.
In these cases, the holder of the Via Verde subscription contract may receive various notices (letters, mobile messages, e-mails, according to the data available in the contract) and, if the problem is not solved, Via Verde may terminate the contract (the identifier being invalid).
The infractions can occur for several reasons. The most common are the following situations: • No identifier associated with the vehicle or with an invalid identifier (canceled / terminated).
This situation occurs when, for example, a vehicle that does not have an active contract with Via Verde Portugal, SA, uses the toll road for vehicles equipped with a Via Verde identifier. • Identifier with payment problems. To enroll in the Via Verde payment system, implies the
existence of a valid debit card, to ensure the payment of debits resulting from the uses of the service. If the debit card associated with the identifier is invalid (expiry / renewal /
cancellation or other reason, information provided by SIBS, which reflects the
communication received from the bank issuing the ATM card), it causes non-payment of transactions.
• Ticket issued manually. An invoice issued for a passage made on a Via Manual barrier, provides that payment is to be made to the concessionaire within 8 days. After this deadline, if the payment is not verified, the process of administrative infraction is initiated.
• Violation of a manual barrier. This situation occurs whenever the payment of any toll rate is not made using the manual way.
1.3. P
ROBLEMI
DENTIFICATIONLaunched in 1991, this system developed by Brisa, known as the automatic toll collection system, was quickly expanded to other features, having exceeded 300 million transactions in 2014, and was considered a great value-added service for the customer. The widespread implementation of electronic toll systems offers great advantages in terms of efficiency, convenience, and safety, not only for payment but also for ease of travelling. However, there are some risks associated with this business, including the risk of non-payment. This study aims to construct a predictive model to prevent non-paying clients.
An infringement occurs when a vehicle passes through the Via Verde lane without having an active contract or, when it does have an active contract, it is invalid for some reason. In the event the Via
4 Verde contract is valid, non-payment can occur in cases where it is impossible for Via Verde to collect tickets.
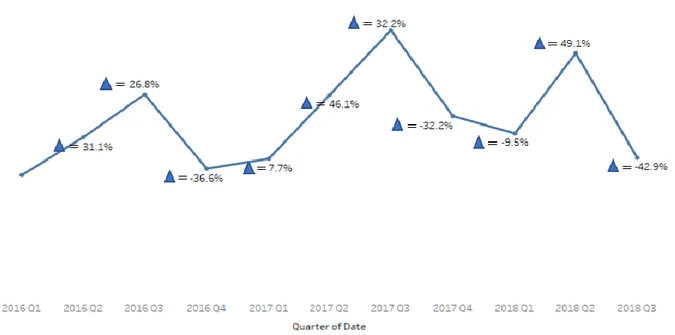
The evolution of the infringements during the years 2016 and 2017 can be observed in the following graph:
Figure 2 - Evolution over the years of 2016 and 2017 (Source: Author elaboration, using data from 2016 and 2017 from Via Verde Portugal)
There are certain variables that contributes to this grow - knowing which are the most relevant and weightier in the process can add value to the company. At first, we need to distinguish data from information. Although linked, these concepts do not have the same meaning. Data is all information and initially does not bring any value to the company, as it has not yet been filtered or interpreted. They are given with potential. Information is a set of data that has been categorized and useful information can be extracted. The important thing in this process is to be able to distinguish what can be used with relevance and what has no value whatsoever. For instance, the data provided only had the 4 first numbers of the Postal Code. This data, by itself, doesn’t bring an insight to our study, however, when combining with the Location (provided by CTT Data Base) gives us the chance to see where the most part of costumers and the routes used are.
As seen, Data analysis is an important step in any decision-making process within a company. But, in order for such information to be relevant and to ensure positive returns for the business, it is essential for the organization to ensure data quality. This means consulting the origin of the facts, verifying the composition of the elements, evaluating the consistency of the available information, among other procedures. During the study this was one of the main struggles, a lot of variables had outliers and non-sense information. This is due to the fact that the main client information is provided by the costumer and might not be the most accurate or can be misspelled.
1.4. S
TUDYO
BJECTIVESIn an attempt to respond to the problems related to the grow of the road toll non-payment, a general goal was set, and several specific objectives defined. This master’s degree final project
5 consists on a payment fraud study analysis of the most known Beacon technology in Portugal – Via Verde.
The intent is to explore the design of a customer segmentation process, and which variables to consider. To achieve this purpose, the following questions will be answered:
1. Which variables should be included in customer segmentation?
2. How can a customer segmentation process be designed when looking to how often do they purchase and how much do they spend (Monetary Value - Identify the variables that most contribute to the success/ debt situation)?
3. How can we predict/ anticipate future frauds? (Apply predictive methods - MLP neural networks, regression, or decision tree)
A predictive model will be developed with the main objective of predicting whether a client will be in debt to Via Verde in the future based on the same variables as customer segmentation (e.g.,
variables associated with the possibility of losses associated with the non-fulfilment of a client’s contract). The process will be developed through qualitative and quantitative research based on a literature review and data provided by the company. Only variables with high influence on the case study will be implemented in this project.
The diagram below describes the reasoning process:
6
2. LITERATURE REVIEW
Risk management is a preponderant factor for the survival of any business. Solomon et al. (2000: 449), incorporates in the concept of risk all types of risks (financial and non-financial) that companies face and, considers, that risk can be understood as uncertainty as to the amount of results associated with both earning potential and loss exposure.
The type of risks can be distinguished according to their nature:
• Financial risk: when risk is directly related to the monetary assets and liabilities of the institution;
• Non-financial risk: when risk arises from circumstances (social, political or economic phenomena) or internal (human resources, technologies, procedures and others) to the institution;
• Other risks: specific risk whose negative impact results in an imbalance for the entire financial system, whether at the level of the country or the world
In this study we will develop the concept one of the Non-Financial Risk - Operational Risk, due to analysis failure, processing operations, internal and external fraud and insufficient or inadequate human resources [BdP (Bank of Portugal): Notice No. 5/2008, Article 11].
Operational Risk and Payment Fraud are key concepts for detecting fraudulent behavior. These will be developed in the following subchapters. In addition, identifying and exposing methods and fraud detection algorithms (namely, data mining and networks) will clarify and classify the various existing methods.
2.1. O
PERATIONALR
ISKBy virtue of its nature, the operational risk is inseparable from a company’s business as it is related to all business activities. It is the most prevalent specific risk; all measures to control and mitigate its effects depend on the specific profile of an organisation. It is considered to be a cultural risk, since its approach and treatment practices particularly affect day-to-day business (Christl & Pribil, 2006). One of the first definitions of operational risk was provided by an internationally recognised entity in 1993, which is allied to the uncertainty pertaining to the losses resulting from inadequate systems and controls, human error and management failures (Group of Thirty2, quoted by Magalhães in
2012). Since then, the said concept has been developing, with several researchers and official entities presenting their own definitions.
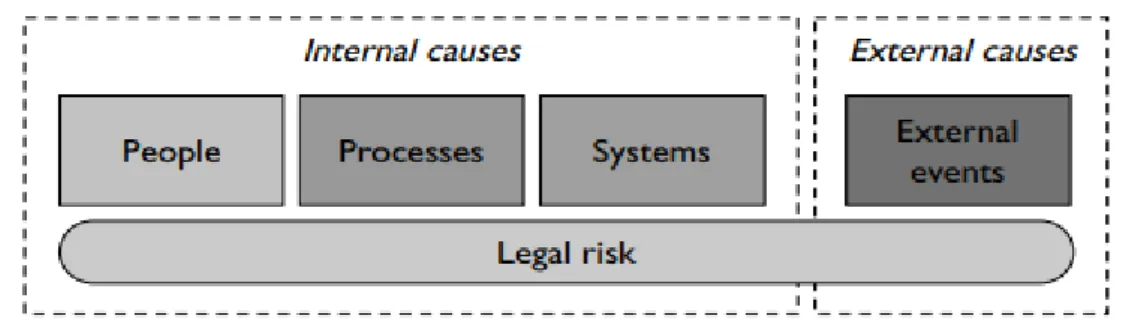
In the context of the definition issued by the Basel Committee, Brink (2002), Chernobai, Rachev and Fabozzi (2007) defined that operational risk consists on the loss resulting from four dimensions – people (inadequate or failed internal processes), systems, processes and external events:
2 Consultative Group on International Economic and Monetary Affairs, Inc.
The Group of Thirty aims to deepen the understanding of international economic and financial issues and explore the international repercussions of decisions taken in the public and private sectors. (Source: http://www.group30.org/)
7 • People – These can occur due to several facts, such as, lack of knowledge of the institution's
products, commercial pressure to achieve objective, segregation of functions,
misunderstanding, omission, distraction or negligence of employees or third parties engaged in and fraudulent behavior (tampering with controls, intentional non-compliance with standards, leakage of privileged information, misappropriation of information,
misinformation). (Mestchian, 2003)
• Systems – The risks that can arise from this dimension include system failures caused by degradation problems, quality and data integrity, inadequate, application-related risks, hardware failures, and storage and data recovery, among others. (Mestchian, 2003) • Processes – Refers to inefficiencies in the organization's business processes. It includes the
processes of value movement, such as sales and marketing, product development and customer support, as well as all back office processes, such as information, human resources and operations processing. The occurrence of non-observance of operational norms and limits results in the lack of functioning of committees, non-compliance with credit, undue custody of confidential documents, non-implementation of controls, lack of compliance, lack of monitoring / conciliation and others. (Mestchian, 2003)
The implementation of internal control procedures aims to avoid errors and risks, however, they may be incorrectly drawn and executed, becoming a source of risk, since they will be inefficient (Davis, 2005).
• External Events – Losses that may occur due to external events, such as, criminal acts, natural disasters, terrorism, money laundering, external fraud and information leakage by
outsourcing companies. (Brink (2002).
Figure 4: The “4-Cause Definition” of Operational Risk According to Basel
(Source: Guidelines on Operational Risk Management, Oesterreichische Nationalbank (OeNB), 2006)
Given the BCBS’ definition, certain criticisms were made in this regard. Wahler (2002) argues that the aforementioned risk originates from internal and external sources: (i) change: external and internal causes; (ii) complexity: in products, processes and technology; (iii) complacency: inefficient
management of the business and its risk, unlike the credit and market risk events that are influenced by the institution’s transactions and business partners. Furthermore, according to Hadjiemmanuil (2003), the definition provided by the committee is “opaque” and “open” because it does not specify the factors that constitute operational risk or its relation to other forms of risk. Tattam (2011) refers to the BCBS’ definition as “narrow” since it only mentions the risk loss, with no reference to the possibility concerning opportunity, positive consequence or monetary gain. Chaudhury (2010) points out that this risk is specific to the company and to certain operations and, unlike the market, the
8 credit, the interest rate and the foreign exchange risks, a higher level of operational risk exposure is generally not rewarded by higher expected return.
For Davis (2005), the difficulty of an operational risk is revealed when comparing it with other types of risks. At the credit risk level, the amount of loans made and to whom, with an approximation of the probability of non-compliance through the analysis of tenderers and with support for scoring models, are known at the outset. In the operational risk, these models have no capacity to predict risk or the degree of risk exposure (CHORAFAS, 2003). The fact that a process has never had an operational failure cannot be regarded, as it being exempt from potential risks. According to Akkizidis and Bouchereau (2006), the risk should only be accepted when the benefits outweigh the costs. Operational risks can only be eliminated if the institution no longer exists.
Herghiligiu and Cocris (2014) report that the types of operational risks are represented by categories/risk classes. These include internal fraud, external fraud, legal and liability losses, non-compliance with regulations, processing errors, information security breaches, inadequate business practice, disaster recovery, business continuity, and physical security failures. (Table 2)
Types of Operational Risk
Event Definition
Internal fraud Acts of fraud committed internally in an organization go against its interest. Losses arising from acts intentionally committed to fraud, assets misappropriation or legislation, regulations or business policies circumventing.
External fraud Losses arising from acts intentionally intended to commit fraud, misappropriation of assets or circumvention of legislation by a third part. Theft, check fraud, and breaching the system security like hacking or acquiring unauthorized information are the frequently encountered practices under external fraud.
Practices on employment and safety at the
workplace
Losses arising from acts that are not in accordance with labor, health or safety legislation or agreements, as well as the payment of personal injury or acts related to differentiation/discrimination. Customers, products and
business practices
Losses arising from the intentional or negligent breach of a professional obligation in relation to specific customers (including fiduciary and fitness requirements) or the nature or design of a product.
Damage to physical assets Losses arising from damage or loss caused to physical assets by natural disasters or other events (such as rapid and unexpected changes in climatic conditions)
Disturbance of business activities and system
failures
Losses due to disturbance of business activities or system failures (hardware or software)
Execution, delivery and management of processes
Losses due to Failure in delivery, transaction or process management, as well as in relationships with commercial counterparts and vendors. Table 2 - The Seven Operational Risk Event Types Projected by Basel II
(Source: Bielski, 2003; BdP, 2010 e BCBS, 2004)
One of the main operational risk challenges lies in developing a management approach that helps the top management to define the different categories of operational risk to be considered in each of the business lines. Under new regulation rules, each institution is allowed to adopt its own definition of operational risk. This individual definition is subject to certain requirements. It should provide a clear understanding of what an operational risk is, consider the material risks that the business faces, and include the main causes of operating losses (Walsh, 2003). It is essential to have an appropriate risk
9 management environment that identifies, assess, monitor, control and mitigates the risk, to establish contingency plans and to establish operational risk management policies and carry out their regular evaluation. The supervisor is responsible for (i) carrying out periodic inspections covering this risk, (ii) ensuring that banks establish and evaluate such policies and (iii) documenting and internally
disseminating the processes and controlling the operational risk; identifying and evaluating the operational risk inherent in all products, activities, processes and systems, defining a minimum of loss and developing processes to periodically monitor the risk profile and exposure to significant losses, including reporting to the top management body and the regulator, are some of the measures presented by the Basel Committee which emphasize the development of an adequate risk
management environment (BCBS, 2001). Goncalves (2011) adds that the Operational Risk Management based on an effective process/ system leads to reduction of losses and operational costs, market and investors image improvement, and also reinforces the level of satisfaction of employees, shareholders, institution customers and the financial market.
Fraud is a specific part of operational risk, being either internal or external. Prevention and detection of this risk are the motivation of this work. In the next section we explain its details and debate its importance.
2.2. F
RAUDIn 1950, Donald R. Cressey, Ph.D., interviewed 250 felons over a period of five months. The felons were selected based on the following two behavioural criteria: (1) the person should have accepted a position, job or role of trust, and (2) they must have violated that trust.
Cressey concluded that the three factors that were always present when respondents reported the breach of the trust were:
1. Realized they had a financial problem that was not likely to be shared with another person in their environment or conviviality;
2. Had knowledge or awareness that this problem could be solved secretly for breach of the position of financial trust received, and
3. Were able to rationalize their own conduct, so that they allowed them to adjust their conception of themselves as trustworthy.
For these reasons, the author concluded that at the base of fraudulent behaviour lies a human process defined by a combination of the three essential factors mentioned above, namely, a non-shareable financial problem, an opportunity to commit a breach of trust and rationalization on the part of the offender, so that they would have a ‘clear conscience’ even after committing the fraud. (Cressey, 1950, p. 738-743)
10 Figure 5 - Fraud Triangle Model (Source: Source: Wells, J. T., 2005. Principles of fraud examination.
Hoboken, New York: John Wiley and Sons)
The pressure on the individual corresponds to the financial problem not shared by the individual, such as the fear of losing their current occupation, inability to reach or maintain a certain standard of living, and other personal problems. The fact that the individual had the opportunity, the necessary knowledge, and the information to commit the fraud are failures on part of corporate governance, and so is the lack of opportunity to resolve the unshared problem. Rationalization constitutes the process of defining the act as justifiable and/or acceptable.
The concept of fraud has developed over time and has become increasingly exhaustive. The word ‘fraud’ has a Latin origin and originally means ‘harm done to someone’. Picket in 2000 (cited by Moura & Silva, 2004. p. 550) defined fraud as any behaviour by which a person has an intention to gain an advantage over another person. This definition has become more and more comprehensive, yet it is not yet complete (Moura & Silva, 2004) because it is found in the most diverse forms and across different domains (Pimenta & Afonso, 2012).
According to Wells, 2007 (as cited in Pimenta 2009), ‘in the broadest sense, fraud can include any crime for profit, using as main modus operandus the achievement’. However, according to Pimenta (2009), the achievement does not directly imply fraud because, to be considered fraud, there must be damages, which are typically monetary in nature.
There are different types of Fraud: • Corporate Service Fraud
o Payment Fraud - This type of fraud involves falsely creating or diverting payments. Examples include creating false bank account records that allow fraudulent payments to be made. Other examples include generating fake payments, making fraudulent payments to yourself, intercepting and changing payee details, or intend not to pay.
o False Accounting Fraud - This type of fraud involves changing the way company accounts are presented so that they do not reflect the actual value or financial
11 activities of the company. This fraud commonly includes overstating assets and / or understanding liabilities.
o Acquisition Fraud - Engages in a third-party procurement process and covers the acquisition of goods, services and construction projects. Acquisition fraud usually involves collusion to perpetrate fraud that encompasses bidding irregularities, bid manipulation, or payment requests - often for goods (and sometimes services) that have not been delivered or are below what was specified as the request.
o Asset Exploitation and Information Fraud - Examples of fraudulent activity reported in this category include sick leave staff who work elsewhere, abuse of flexible working hours, misuse of company time, and misrepresentation or
misrepresentation
o Travel and subsistence, payment and other licenses Fraud - Fraud in this area involves activities such as completing fraudulent payment requests or creating false payroll records. Examples of fraud include unclaimed travel claims, false claims of customer entertainment, exaggerated claims, forged signatures authorizing payment, etc
o Receiving Fraud - This type of fraud involves using the organization's assets for unofficial purposes and / or providing information to outsiders for personal gain. This excludes direct theft from insiders, such as stealing stationery or other physical assets. (Bologna e Lindquist, 1995)
• Institutional Investment Fraud
o Pyramid or Ponzi Scheme Fraud - These well-known types of fraud involve an
unsustainable business model, in which investments to other later investors are used to pay off previous investors, giving the impression that early participants
investments dramatically increase in value in a short space of time. of time. These types of scams often appear at the beginning of a recession when investors want to withdraw their money from the scheme, leading to their sudden collapse and exposure. (Reena Aggarwal, May Hu and Jingjing Yang, 2015)
• Business Trading Fraud
o Long and Short Business Fraud - This type of fraud occurs when a seemingly legitimate business is established with the intention of defrauding its suppliers and customers. This can happen after the company develops a good reputation and credit history or when the apparent business has been in operation for only a few months (short term fraud, usually Internet related). (Cassim M, 1987)
• General Business Fraud
o Bankruptcy-Related Insolvency and Fraud - Insolvency fraud occurs when a company is dealing in a fraudulent manner and usually occurs before the company's early insolvency. Directors (or shell directors) often set the phoenix immediately before or after the insolvency of the first company, in order to obtain assets from the first company and to avoid paying its debts at the same time. However, there are several provisions of the Insolvency Law that allow liquidators and / or creditors to take action against those individuals who personally try to take shelter behind the corporate veil of the company. (Richard Perkoff, 2019)
12 In Portugal, according to Pimenta (2009), the quantification of fraud becomes quite complex due to various institutional, cultural, and cognitive factors. Nonetheless, it is possible to obtain, with a low probability of error, a set of values to estimate that fraud represents between 1.5% and 2% of Portugal’s GDP. This being the case, it is important to note the different types of fraud: internal fraud (by an employee of an organisation), external fraud (from an entity outside of an organisation), interpersonal fraud (by one or more individuals against another), and business fraud (from one organisation to another organisation or individual) (Soares, 2008). In this study, we will focus on external fraud.
13
2.3. P
AYMENTF
RAUDThe amount of electronic transactions has significantly increased over the last few years, mainly due to the spread of electronic commerce technology. This resulted in an increase of fraud cases,
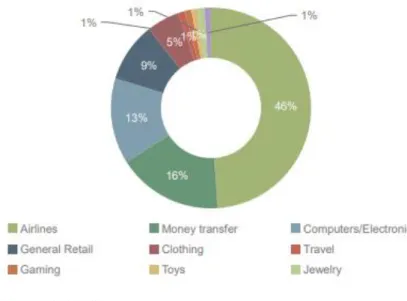
resulting in billions of dollars losses every year, worldwide. (Brandao G., Caldeira E., Pereira A., 2014) Payment fraud is any type of false or illicit transaction. The perpetrator deprives the casualty of assets, personal property, interest or sensitive information through the Internet. (ACFE, 2010) According to a study from Juniper Research3, in 2015, the average value of a fraudulent transaction is
significantly higher than the average of that same legitimate transaction. The most affected
categories were airlines with 46 % of fraudulent transactions, followed by money transfer with 16%:
Figure 6 - Top Merchants Affected by Fraud Transactions (Source: ONLINE PAYMENT FRAUD WHITEPAPER, 2015)
As mentioned in the previous chapter Fraudsters use an assortment of strategies leading to substantial losses. Fraudsters use exposed data in a decentralized, worldwide production process translating stolen information into false installments. (Richard J. Sullivan, 2014)
2.4. A
NALYTICALM
ETHODS FORF
RAUDD
ETECTION INP
AYMENTFraud prevention consists of ensuring fraud does not occur prior to finalising the payment terms of a transaction. Fraud detection comes into place when prevention measures fail to prevent fraud and consists of identifying fraud as soon as possible after it occurs. However, both fraud prevention and detection activities are in constant evolution. This is due to the fact that, whenever a new fraud prevention or detection method is implemented, criminals revise their strategies and try new
3 Juniper Research Group is a consulting and analytics firm. It is a global leader for industry research with mobile, online & digital market research specialists, providing market intelligence, consulting, data and forecasting.
14 methods of getting around the fraud prevention or detection measures. As a result, new methods for fraud detection are elaborated and the cycle repeats itself (Bolton, R.J., Hand, D.J., 2002).
There are several methods capable of detecting fraud: business rules, auditing, social networks, and statistical and data mining models.
• The use of business rules for fraud detection is very important, as they serve to represent the user’s requirements and internal process conditions that are essential to keeping up with the growth of companies, including making software useful and up-to-date (Wan-Kadir &
Loucopoulos, 2004).
• The main aim of the audit is not to detect fraud, but rather to express an opinion on the veracity of the financial statements. However, in the execution of the work, errors or frauds may be detected. This approach is very costly and time-consuming, being only applied to small samples (Copeland et al., 2012; Francisco, 2014; Schiller, 2006).
• Social Networks consist in the implementation of networks connecting suspicious or
fraudulent entities by modelling connections between entities in claims (Baesens et al., 2015; Jans, Van Der Werf, Lybaert, & Vanhoof, 2011)
• A wide range of data mining techniques is used in fraud detection. So far, the logistic
regression model (which measures the relation between a categorical variable – fraud or not fraud – with the other independent variables) is the most used model in detecting financial fraud (Albashrawi, 2016).
The choice of these methods must be made accordingly to the set of characteristics that each company presents with the needs and particularities of the business. Most failures in fighting fraud are due to errors in the detection phase, which increases the probability of propagation. Fraud detection methods allow diagnosing fraudulent activities whereas prevention aims to avoid fraud. (Baesens et al., 2015; Hartley, 2016)
The present study will be focus on the use of data mining for fraud detection.
The use of data mining for fraud detection requires the existence of a well-defined problem, based on procedural models, and cannot be solved with query and reporting tools (Lavrac et al., 2004). This technique aims to find unknown facts with a statistical basis that are triggered from the data (Elkan, 2001) in an efficient way.
Today, the data discovery and decision-making phenomenon is more than a trend. Data mining refers to extracting knowledge from a large set of observed data in order to discover the unsuspected relationships and hidden patterns in data and presenting it to users in an innovative, understandable, and useful way (Adeniyi, Wei, & Yongquan, 2016).
Data mining is also considered the “process of exploration and analysis, by automatic or semi-automatic means, of large quantities of data in order to discover meaningful patterns and rules” (Berry & Linoff, 1997, p. 5). It uses machine learning, artificial intelligence and statistical technologies to extract information from a data set and transforming it into an understandable structure that could never be found through manual analysis alone.
Berry and Linoff (2010) later had cause to regret the 1997 reference to “automatic and semi-automatic means”, feeling that it misled the role of data exploration and analysis.
15 In its first years, data mining was mainly used for unsupervised learning, involving identifying clusters and associations, without making any assumptions about the structure of the data (Stephens and Tamayo, 2003). Nowadays, the main goal has changed dramatically. A researcher will now examine large data sets to discover patterns as before, but will also uncover new information and predict failure points and outcomes for the future.
A few concise definitions of Data Mining are presented below.
• “DM is the nontrivial process of identifying valid, novel, potentially useful, and ultimately understandable patterns in data” – Fayyad et. all (1996)
• “[Data Mining is] the discovery by computer of new, previously unknown information, by automatically extracting and relating information from different (…) resources, to reveal otherwise hidden meanings” - Hearst (1999)
• “[Data Mining is] “Extracting useful information from large data sets.” - Hand et al. (2001) • “Data Mining is the process of automatically discovering useful information in large data
repositories” – Tan, Steinbach & Kumar (2006)
• “[Data Mining is] the process of discovering meaningful correlations, patterns and trends by sifting through large amounts of data stored in repositories. Data mining employs pattern recognition technologies, as well as statistical and mathematical techniques.” - Gartner Group, information technology research firm.
2.4.1. Data Mining Processes
In order to have a clear analysis of the applied techniques it is essential to have an overview of the Data Mining Process.
There are several methodologies proposed by authors, however the most used methodologies are SEMMA (Sample, Explore, Modify, Model, Assess) and CRISP-DM (CROSS Industry Standard Process for Data Mining). (Santos & Azevedo, 2005) They will be described in the following subsections. CRISP-DM
CRISP-DM (Cross-Industry Standard Process for Data Mining) is a process for performing data mining, with the goal of having a consistent procedure, repeatability and objectivity. The data mining process provides a view of the project lifecycle, containing the project phases, their tasks and the
relationships between these tasks. (R. Wirth and J. Hipp, 2000)
The CRISP-DM methodology is described in terms of hierarchical process and consists of six crucial steps, which are described and illustrated below (Figure X). The six phases were thought so that they could be applied in any business area. [CRISP-DM, 1999]
16 Figure 7 - CRISP-DM Life Cycle
(Source: Adapted from R. Wirth and J. Hipp,
"CRISP-DM: Towards a standard process model for data mining")
1. Business Understanding – There should be an analysis of the context for the demands of the project. More specifically, what are the scenarios (or not) for the project to start in the best possible way?
2. Data Understanding – The characteristics and limitations of the databases, their history, their composition and their type should be understood, and it should be determined if the data are sufficient to understand the proposed problem.
3. Data Preparation – There are numerous techniques and technologies that can be used when working with data. Some of the many tasks include inserting missing treatment, converting different types of data according to need and understanding whether the data are
categorical and continuous and if they should be standardized or not. In this step, the construction of variables is also fundamental to the success of any model.
4. Model Building – At this point, techniques will be used that are more adherent to the objective of the project, be it a prediction, classification, grouping or regression.
5. Testing and Evaluation – In this step, a rigorous assessment of the results is performed so that there is confidence in the project before it is delivered. If the project objective has not been reached, it may be necessary to go back to the first step.
6. Deployment – In this step, the project is finished. It is the least technical, but not the least important, stage of the data mining process. Here the result is delivered to the customer in the form of a report or a system deployment for real-time data access.
17 SEMMA
The SEMMA is a methodology developed by SAS Institute, linked to SAS enterprise miner. It is a cyclic scheme, as can be seen in the following representation.
Figure 8 – SEMMA
(Source: Adapted from A. I. R. L. Azevedo and M. F. Santos, "KDD, SEMMA and CRISP-DM: a parallel overview”) The acronym SEMMA is described as:
• Sample - Sample of representative population data, is normally partitioned into training, validation and test sets;
• Explore - helps redefine the entire process of knowledge discovery by search for trends and anomalies in the data through statistical techniques is the processing of data;
• Modify - allows you to select and transform the variables in view of the type of model used, is based on the exploratory phase to manipulate the information. (to convert nominal variables in numerical);
• Model - through data mining models, search combinations in information that better predicts the expected result with the model;
• Access (evaluation) - evaluates the results obtained by measuring the performance of the data mining process allowing the optimization of the results by the adjustment of the model. The SEMMA model allows the adjustment of the data according to several regression or classification simultaneously, and the model with the best performance in terms of the mean squared error will be selected to predict the data.
CRISP-DM vs SEMMA
As seen, both methodologies give an overview of the development of a predictive model, structuring the data process in phases that are interrelated, converting the knowledge discovery development in an interactive process.
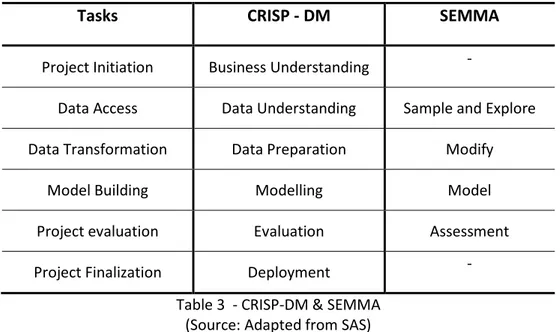
18 In a first analysis it can be deduced that in terms of processes for developing a Data Mining project the methodology CRISP-DM is more complete than SEMMA, by incorporating the Understanding phases of the Business and Implementation. However, a more detailed analysis integrates Business Understanding into the Sample phase of the SEMMA methodology that it is not possible to constitute a coherent and solid sample without genuine of all aspects presented. With regard to the evaluation phase of the SEMMA methodology if it is considered that the obtained knowledge is applied it is assumed that the phase of Implementation (present in the CRISP-DM methodology) is also present (Azevedo& Santos, 2008).
Tasks
CRISP - DM
SEMMA
Project Initiation Business Understanding -
Data Access Data Understanding Sample and Explore Data Transformation Data Preparation Modify
Model Building Modelling Model
Project evaluation Evaluation Assessment
Project Finalization Deployment -
Table 3 - CRISP-DM & SEMMA (Source: Adapted from SAS)
Based on these differences, it was decided to follow the CRISP-DM methodology with the SEMMA approach during this work, in particular by adapting itself to the project in question and also for being one of the methodologies most used in this type of research work (Predictive Models). One of the main reasons was the fact that SEMMA methodology is focused on SAS Enterprise Miner
software and on model development.
2.4.2. Predictive Models
“An economist is an expert who will know tomorrow why the things he predicted yesterday didn’t happen.”
—Earl Wilson
Predictive analytics consists of the techniques, tools, and technologies used to find models that can anticipate outcomes with a significant probability of accuracy. Prediction brings insight into the unknown. Accurate predictions can transform businesses by empowering their decision-support systems.
Prediction is a process that consists of three distinct but related parts: capture, predict, and act. ‘Capture’ refers to capturing, or collecting, relevant data, while ‘predict’ refers to using various techniques, including data mining, text mining, and statistical analysis, to anticipate an outcome. Finally, ‘act’ refers to deploying models into operational processes to optimise decisions at the right time to change outcomes for the better.
19 Figure 9 - Data Triangle methodology
(Source: Author elaboration, using information from Reeve A. (2013). “Managing Data in motion: Data Integration. Best Practice Techniques and Technologies”. 152-154)
Predictive Analytics is often express in many ways. A few concise definitions of predictive modelling are presented below.
“Predictive analytics is the process of discovering interesting and meaningful patterns in data.”
(Dean Abbott, 2014, Applied Predictive Analytics. Principles and techniques for the professional data analyst)
“Predictive modelling (also known as supervised prediction or supervised learning) starts with a training data set. The observations in a training data set are known as training cases (also called training examples, instances, or records). The variables are called inputs (also known as predictors, features, explanatory variables, or independent variables) and targets (also known as response, outcome, or dependent variable). For a given case, the inputs reflect your state of knowledge before measuring the target”
(Christie et al., 2011, Applied Analytics Using SAS Enterprise Miner)
“Predictive Analytics helps connect data to effective action by drawing reliable conclusions about current conditions and future events”
(Gareth Herschel, Research director of Gartner Group)
There are several aspects of the model building process that are worthy of further discussion. In the following subsections, we will describe the relevance of defining the target in a model and the three most common predictive modelling approaches.
2.4.2.1. Defining the Target
Defining and measuring the target variable to be predicted by the model is the first step in a data mining project. The target variable should have all the information that we want to predict – the outcome.
In the present work the target variable will be the “Debt” - case where the client has been in debt or is in debt. The approaches taken were:
• Binary Target- It takes the value 1 if the transaction was fully paid, and 0 otherwise. To notice that the binary variable can either be numeric, 0 and 1, or character, Y and N.
20 • Multi-Class Target - it combines the dependent variables in study into a discrete variable
composed by 4 distinct classes
These two methods will be further described later, in the methodology chapter.
2.4.2.2. Logistic Regression
Logistic Regression is a type of regression normally used when the dependent variable is
dichotomous or binary. It allows the estimation of the associated probability of occurrence of a given event in a set of exploratory variables. After estimating the probability of an instance, the
classification of it as event or non-event can be made.
Logistic regression ability to provide probabilities and classify new samples using continuous and discrete measurements makes it a popular machine learning method. The dependent variable follows the Bernoulli4 distribution having an unknown probability.
In any regression model the right quantity is the mean value of the response variable given the independent variable value. This quantity is called conditional mean value and can be expressed as E[Y|X] where Y represents the response variable and X is the explanatory variable:
𝐸[𝑋|𝑌 = 𝑥] = 𝜋(𝑥) = 𝑒
𝛽0+𝛽1𝑥
1 + 𝑒𝛽0+𝛽1𝑥
Since the association between the target variable and the inputs is not a linear function, a linkage function denominated logit is used to establish the relationship between the dependent binary variable and one or more nominal, ordinal, interval or ratio-level independent variables. This transformation is defined as:
𝑙𝑜𝑔𝑖𝑡(𝜋(𝑥)) = ln( 𝜋(𝑥) 1 − 𝜋(𝑥)) 𝑙𝑜𝑔𝑖𝑡(𝜋(𝑥)) = 𝑒𝛽0+𝛽1𝑥 1 + 𝑒𝛽0+𝛽1𝑥 1 − 𝑒𝛽0+𝛽1𝑥 1 + 𝑒𝛽0+𝛽1𝑥 = 𝑒𝛽0+𝛽1𝑥 1 + 𝑒𝛽0+𝛽1𝑥 1 1 + 𝑒𝛽0+𝛽1𝑥 𝑙𝑜𝑔𝑖𝑡(𝜋(𝑥)) = ln(𝑒𝛽0+𝛽1𝑥) = 𝛽0 + 𝛽1𝑥
This transformation takes on special importance because the model with this transformation has several properties of the linear regression model:
• The logit function is linear in the parameters; • It can be continuous;
Their values can assume ℝ
The final value is interpreted as the estimated posterior probability - In order to associate predicted values to these probabilities the sigmoid function is used. The function maps any real value into another value between 0 and 1.
21 Figure 10 - Sigmoid Function
The goal of logistic regression is to correctly predict the category of the outcome for individual cases - any value of x above 0.5 will be classified as Class 1, otherwise will be classified as Class 0. The regression coefficients for the logistic regression are calculated using maximum likelihood estimation or MLE. This means that the choice of an adequate model is based on the significance of the
coefficients associated with the input variable.
2.4.2.3. Decision Trees
A decision tree is a map of possible outcomes of a variety of related choices. It allows an individual or organization to compare possible actions based on their costs, probabilities, and benefits.
Nowadays, Decision Trees is one of the most popular predictive algorithms due to their structure and interpretability. They are a simple, but powerful form of multiple variable analysis. They provide unique capabilities to complement and substitute for:
• Traditional statistical forms of analysis • Data mining tools and techniques
• Multidimensional forms of reporting and analysis found in the field of business intelligence
2.3.2.3.1. Decision Trees Representation
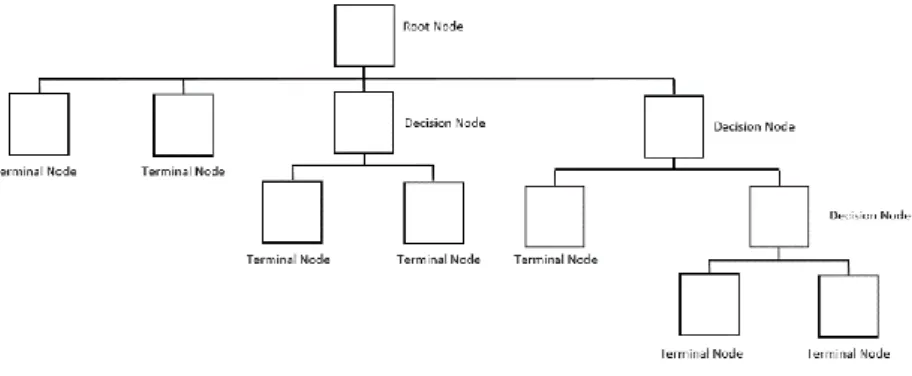
A decision tree usually begins with a single node, which then, splits into possible outcomes. Each of these results leads to additional nodes, which will again, split into other possibilities.
22 Figure 11 - Illustration of the Decision Tree (Source: SAS Institute)
There are three types of nodes: probability nodes, decision nodes, and end nodes (also called leaves). The probability node, represented by a circle, shows the probabilities of a certain result. A decision node, represented by a square, shows the decision to be made, and an end node shows the final result of a decision path. All nodes, including the bottom leaf nodes, have mutually exclusive assignment rules. In consequence, observations from the parent data set can be found in one node only.
2.3.2.3.2.
Growing a Decision TreeDecision tree growing is done by creating a decision tree from a data set. Splits are selected, and class labels are assigned to leaves when no further splits are required or possible. To measure the goodness of a split different functions can be used, the most known are Entropy and Chi-Square, both approaches are available in SAS Enterprise Miner.
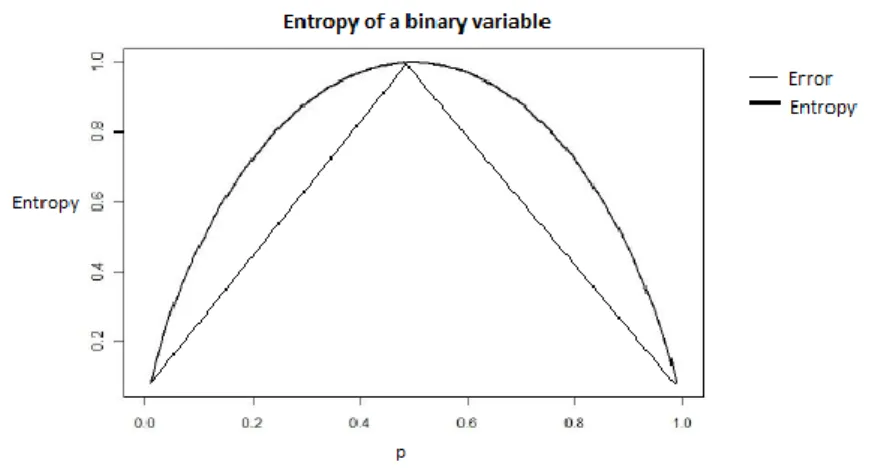
Entropy
Entropy characterizes the (im)purity of the data: in a dataset, it is a measure of the lack of homogeneity of the input data when comparing with is actual classification. For example, the entropy is maximal (equal to 1) when the data set is heterogeneous (Mitchell, 1997).
The entropy function E of a collection S in a c class classification is defined as:
Entropy(S) = ∑
𝑐𝑖=1−𝑝
𝑖log
2𝑝
𝑖Where 𝑝𝑖
is the proportion of S belonging to class 𝑖.
Some of the most useful features of Entropy are:•
Maximum Entropy log2𝑐 if 𝜌
𝑖= 𝜌
𝑗∀ i ≠ j
• Entropy(S) = 0 if ∃𝑖 such as 𝜌
𝑖= 1
23 Figure 12 - Entropy of a Binary Variable
Figure 8 shows the variation of the entropy for a binary target variable versus the error. The maximum is reached when there is a 50/50 proportion of event and non-event. The aim of the algorithm is to find the split that minimizes the entropy, which provides the largest difference in proportion between the target levels.
The information gain of an attribute A from a data sub-set S gives the expected entropy reduction caused by the partitioning of the examples according to an input variable. Let P(A) be the set of values that A can assume; Let x be an element of this set and let 𝑠𝑥 be the subset of S formed by the
data in which A = x; the entropy obtained by partitioning S as a function of attribute A is given by:
𝐸𝑛𝑡𝑟𝑜𝑝𝑦(𝐴) = ∑
|𝑠
𝑥|
|𝑆|
𝐸𝑛𝑡𝑟𝑜𝑝𝑦(
𝑥𝜖𝑃(𝐴)
𝑠
𝑥)
The Information Gain relative to a collection S and an input A is defined as: 𝐺𝑎𝑖𝑛(𝑆, 𝐴) = 𝐸𝑛𝑡𝑟𝑜𝑝𝑦(𝑆) − 𝐸𝑛𝑡𝑟𝑜𝑝𝑦(𝐴)
The construction of a decision tree has three objectives: to decrease the entropy (the randomness of the objective variable), to be consistent with the data set and to have the smallest number of nodes. Gini Index
The Gini index, developed by Conrado Gini in 1912, measures the degree of heterogeneity of the data. Therefore, it can be used to measure the impurity of a node. This index in a given node is given by:
𝐺𝑖𝑛𝑖𝐼𝑛𝑑𝑒𝑥 = 1 − ∑ 𝑃𝑖2 𝑐
𝑖=1
24 When this index is equal to zero, the node is pure. On the other hand, when it approaches the value one, the node is impure (increases the number of classes evenly distributed on this node).
In situations where Gini criterion is used in binary partitioning trees, it tends to isolate the records that represent the most frequent class in a branch. When using entropy, the number of records in each branch is balanced.
Both Impurity measures have different techniques to split the node in decision tree based models. However, most of the times, they are quite consistent with each other, the performance of a model won’t change with the use of Gini Index or Entropy.
Algorithms
There are several known algorithms that implement a decision tree. There is no precise way to determine the best algorithm. Their performance may vary depending on the volume of data and the situation in which they are being used.
One of the first algorithms developed was the ID3. His concept of creation used the idea of inference systems and machine learning concepts. In a short time, other algorithms have also appeared: C4.5, CART (Classification and Regression Trees), CHAID (Chi Square Automatic Interaction Detection) and others. In this present subsection the CHAID will be described.
CHAID(Chi-Square Automatic Interaction Detection)
In CHAID algorithm, input groupings are formed by combining values in the input if their relationships with the target are similar. Values are indistinguishable from a statistical point of view if the pairwise differences between two values relative to the target are not statistically significant. By selecting the input variable with the lowest significant p-value, the algorithm is intrinsically selecting the variable that has the stronger relationship with the target variable at each step (Ritschard, 2010).
Like other decision trees algorithm, CHAID advantages are that is a highly visual algorithm, easy to interpret because it uses multi-way slip5 by default. It need rather large samples sizes to work
effectively since with small samples sizes the respondent groups can quickly become too small for reliable analysis. One important advantage of CHAID over alternatives is that the multiple regression is non- parametric.
The CHAID algorithm can produce more than two branches at any level of the tree. The first branch of the tree is created when the independent variable, which has greater interaction with the
dependent variable, is selected. Each node has homogeneous values according to selected variables. The process is performed on all independent variables to find the best number of classes.
25 Figure 13 - CHAID structure - Decision Tree example (Source: Author elaboration)
CART (Classification and Regression Trees)
The trees constructed by the CART algorithm are indicated for non-linear problems, achieving satisfactory results for both numerical and categorical variables. The growth of the tree is binary - each node has two branches/sub-trees, so that the values of the dependent variable are more homogeneous than the previous division. Within a tree, there are many simpler sub-trees, so the tree obtained has the possibility of being pruned once the process is finished, as shown in the figure 10.
Figure 14 - CART structure - Decision Tree example (Source: Author elaboration)
Through the process, instead of determining when a node is terminal or not, it continues to provide tree growth until it is no longer possible to do so, for example, when reaching a minimum number of data in the sample. After all the terminal nodes have been found, the tree is defined as maximal, that is, the tree of maximum size
After finding the maximal tree, some subtrees, obtained by pruning some branches of this tree, are observed by testing the error rates and the best of them is chosen.
26 Table 4 - Comparison of CHAID vs CART algorithm
(Source: Author elaboration, , using information from Lu, Y. (2015). “Decision tree methods: applications for classification and prediction”, Shanghai Archives of Psychiatry, 130-133)
2.4.2.4. Artificial Neural Networks
The human brain is considered the most fascinating existing carbon-based processor, consisting of approximately 10 billion neurons. All the functions and movements of the organism are related to the functioning of these small cells. The neurons are connected to each other through synapses, and together they form a large network, called Neural Network.
Artificial neural networks consist of a method of solving artificial intelligence problems, constructing a system that has circuits that simulate the human brain, including its behavior - learning, making mistakes and making discoveries. More than that, they are computational techniques that present a model inspired by the neural structure of intelligent organisms and that acquire knowledge through experience.
There are many different types of artificial neural networks, differing in their learning rules and topologies. In this case, the one used is the Multi-Layer Perceptron (MLP), one of the most prestigious and successful architectures used in predictive and classification problems.
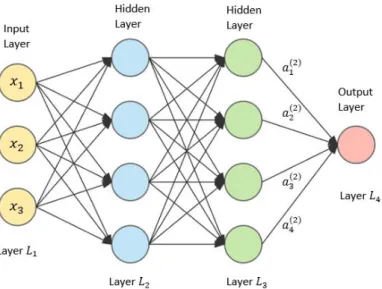
27 Figure 15 - Artificial Neural Network Representation
The type of neural networks shown has three layers. The first layer, called Input Layer, is
characterized by receiving the data which the model will be trained and stores it in the network; the second layer, called Hidden Layers, is where most processing is done through weighted connections; and the third layer, called Output Layer, is where the final result is completed and displayed. The layers are linked through synapses with the exception of the first layer that is where the whole process begins.
MLP uses a supervised learning technique called backpropagation algorithm for training,
characterized by decreasing the gradient throughout the network, responsible for minimizing the mean square error of the model output.
The process begins with the initial random distribution of the associated weights. Each variable of the initial layer is trained and synthesized by the hidden layers and the values obtained in the output layer are later compared with the real ones, ending the process with the calculation of the error value that the network obtained. This error is then gradually reduced, altering and adjusting the weight of synapses.