RESEARCH
Spatio-temporal variation
and socio-demographic characters of malaria
in Chimoio municipality, Mozambique
João Luís Ferrão
1*, Jorge M. Mendes
2, Marco Painho
2and Sara Z. João
3Abstract
Background: In Africa, urban malaria is a major concern, since the towns and especially their suburbs are growing quickly. In Mozambique, malaria represents 45 % of all cases of outpatient visits and 56 % of inpatient visits at paediat-ric clinics. Malaria is a major public health burden in Chimoio Mozambique and few studies on malaria exist.
Methods: The study was carried out to establish the spatiality and temporality of malaria and describe socio-demo-graphic characteristics of malaria patients in Chimoio. Weekly malaria data for 9 years (2006–2014) were collected from the district Epidemiological Bulletin and incidence by season, age, gender, and residence was calculated. SPSS version 20 was used for statistical analysis and ArcGis 10.1 was used to produce maps.
Results: The annual overall average of malaria incidence was 20.1 % and the attributable fraction (AF) of malaria was 16 %. There were differences in weekly and yearly malaria occurrences throughout the period. There was no differ-ence in malaria cases between male and female patients. Children under 5 years of age are three times more prone to malaria than adults (p < 0.05). Three temporal clusters of malaria were identified: cluster 1, weeks 25–47 with average weekly cases of 618 (sd = 251.9), cluster 2, weeks 18–24 and 48–51 with average weekly cases of 1066 (sd = 317.4). cluster 3, weeks 1–17 and 52 with average weekly cases of 1587 (sd = 722.4). Similarly, three different clusters were identified according to residential areas: cluster 1 (10 %) mostly urban, cluster 2 (22 %) mostly suburbs, cluster 3 (28 %) mostly rural areas.
Conclusion: Malaria is increasing in the suburbs, and rural areas present more cases of malaria compared to urban areas. This article is an initial step to understand the dynamics of malaria in Chimoio. Results suggest that malaria var-ies in time and space, and that precision public health strategy should be used to control malaria occurrence. Studvar-ies on weather factors affecting malaria cases, bed net usage, and others should be undertaken.
Keywords: Malaria, Spatiality, Temporality, Socio-Demographic, Chimoio, Precision health
© 2016 The Author(s). This article is distributed under the terms of the Creative Commons Attribution 4.0 International License (http://creativecommons.org/licenses/by/4.0/), which permits unrestricted use, distribution, and reproduction in any medium, provided you give appropriate credit to the original author(s) and the source, provide a link to the Creative Commons license, and indicate if changes were made. The Creative Commons Public Domain Dedication waiver (http://creativecommons.org/ publicdomain/zero/1.0/) applies to the data made available in this article, unless otherwise stated.
Background
Malaria is a very old disease and is a major public health problem in Africa. An estimated 91 % of deaths in 2010 were in the African Region. Most deaths occur amongst children living in Africa, where a child dies every minute from malaria [1, 2]. Urban malaria in Africa is a prob-lem of substantial and growing proportions since these areas are growing quickly, especially in suburbs with poor
houses and drainage, farming activities, large amount of vegetation, fruit trees, and persistent poverty. Children and pregnant women are severely and disproportionately affected by malaria in high malaria burden countries [3]. The disease undermines people’s health and capacity to work, hampering the social and economic development of the countries involved [4].
In Mozambique, malaria represents 45 % of all cases in outpatient visits, 56 % of inpatient visits at paediatric clinics, and around 26 % of all hospital deaths [5]. The high prevalence in many parts of the country puts the entire population at risk and poses a challenge for malaria
Open Access
*Correspondence: [email protected]
1 Engineering Faculty, Mozambique Catholic University, Chimoio,
Mozambique
elimination efforts nationally. The peak of malaria occurs during and after the rainy season. Transmission inten-sity varies from region to region, with high prevalence in areas where climatic conditions are favourable to its development and transmission, whereas some drier parts of the country are epidemic-prone [6].
An association between malaria prevalence and soci-oeconomic status of households was established in Mozambique. The prevalence of malaria is 43 and 58 % in urban and rural areas, respectively. Pregnant women with high levels of education tend to be more protected against malaria (59 %) compared to non-educated (36 %). Children from better-off families tend to be more pro-tected against malaria (58 %) compared to children from poor families (43 %) [7].
There are conflicting reports regarding the impact of urbanization on malaria endemic trends. Some authors [8, 9] claim that the urbanization process results in profound socio-economic and landscape changes that reduce malaria in urban areas, while some report an increase in malaria in urban regions due to population increase, over-crowding, and poor sanitation [10, 11]. Few spatial studies of malaria have been reported for Mozambique and most studies on malaria variation are based on monthly data [6, 12]. The maps that exist on malaria were produced at the National or Continental level, such as MARA [13], and have limited operational use to support local programme activities.
The patterns of malaria transmission at the local level, especially in Chimoio, have not been studied or pre-cisely defined. This type of research is needed in order to develop cluster risk maps and identify locations and pop-ulations at risk for appropriate planning and implementa-tion of targeted and epidemiologically sound preventive and control measures against the disease.
Precision Health is defined as improving the ability to prevent disease, promote health, and reduce health dis-parities in populations by: (1) applying emerging meth-ods and technologies for measuring disease, pathogens, exposures, behaviours, and susceptibility in populations; and (2) developing policies and targeted public health programmes to improve health [14]. This technique is based on specific site observation, and measuring and responding to variability in disease trends. If related to socio-demographic characteristics, using weekly data, it can lead to decision support systems that help to eradicate disease, optimise resources, and minimise the impact on the environment.
Chimoio is a municipality in the central region of Mozambique. The major cause of death in the municipal-ity in 2013 was malaria 15 % [15]. Swaziland is a neigh-bouring country of Mozambique with landscape and
weather similar to Chimoio Municipality. Using an inte-grated strategy for malaria eradication achieved a 98 % decrease in reported malaria cases between 2000 and 2011 and seeks to eliminate malaria by 2015 [16].
The goal of this study was to determine the spatial and temporal patterns or clusters of malaria distribution and socio-demographic characteristics of malaria patients in Chimoio Municipality to help decision-making in Preci-sion Public Health strategies in malaria prevention and eradication, using weekly data.
Methods
Study area and population
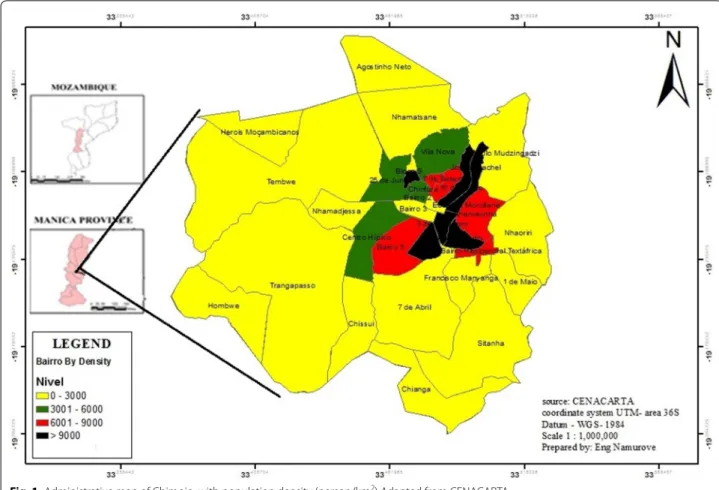
Chimoio is a municipality of Manica Province in the central region of Mozambique, −19°6′59S, 33°28′59E (Fig. 1). The population of Chimoio was 237,497 inhabit-ants in 2007, with a 3.5 % annual growth rate. Men and women represent 52 and 48 % of the population respec-tively. Population from 0 to 5 years comprises 17 % of the inhabitants [17]. The city is administratively divided into three urban districts with 33 residential areas called
Bairros, (Fig. 2) comprised of urban, suburban, and rural areas. The urban area consists of colonial buildings; one to four storey brick houses with large streets and large areas of private open space. There are sewage and sanita-tion facilities in place. The residents of these areas have medium to high-income levels. On the contrary, most of the suburbs are crowded; some housing units are made of bamboo and wooden poles, and few are of bricks and concrete. In those areas there is poor sanitation, narrow or non-existent streets, and the income levels are low to medium. Rural areas consist of scattered houses, covered with grass, and that are inhabited by low-income resi-dents. There is no electricity and running water and they are continuously expanding.
The area is 174 km2 at an altitude of 750 m. Chimoio
has a warm temperate climate with dry winters from April to July, hot and dry summer from August to Octo-ber, and hot humid summer from November to March. The average temperature in Chimoio is 21.5 °C. With an annual rainfall average of 1143 mm, Chimoio has 201 dry, 41 intermediate, and 123 wet days, and the wet period is from 26 November to 29 March [18].
Chimoio has six public health centres’, one Provincial hospital, and two private clinics. The oldest health cent-ers (more than 10 years) are Centro de Saude Eduardo Mondlane (CSEM), Centro de Saude 1o de Maio
(CS1Maio), Centro de Saude Namahonha (CSNh) and Centro de Saude Chissui (CSCh). The other two cen-tres, Centro de Saude 7 de Abril (CS7Abril) and Centro de Saude Vila Nova (CSVN) are more recent (less than 5 years).
Study subjects
In the public health centres and in the provincial hospital malaria cases and other occurrences are compiled daily to produce the Weekly Epidemiological Bulletin (BES) and then sent to the Chimoio Directorate of Health, where data are summarized into a Weekly District Epi-demiological Bulletin and channelled to the Provincial Directorate of Health (DPS). Weekly malaria data from the 9 years period (2006–2014) were collected from the district BES: missing bulletins were completed at DPS. The data collected provides information on cases of malaria, gender, and age of the patients. Total malaria cases for each week for the 9 year period (2006–2014) were added and averaged. The aggregated values starting with Week 1 to Week 52 for the 9-year period represent the variables of the study.
Data from the area of residence of the patients were collected from Centro de Saúde Eduardo Mondlane (CSEM), Centro de Saúde 1o De Maio (CS1Maio), and
Centro de Saúde Nhamahona (CSNh), (see Map1), which are the largest and oldest clinics in Chimoio Municipal-ity. Proportional randomized sample data from daily record books of the clinics (n = 35,864) were used of
which 18,292 were from CSEM, 9185 from CS1Maio, and 8387 from CSNh. Data collected were from 2009 to 2014 due to data availability and aggregated on a weekly basis.
Malaria cases from 2006 to 2009 included cases con-firmed either by microscopy or rapid diagnostic test (RDT), and also clinical malaria (fever) diagnosed by health personnel. From 2010 to 2014 malaria cases that were recorded were only from microscopy and RDT. An adjustment for clinical malaria was made for the years 2006–2009 since from 2010 to 2014 of the total fever cases, 78 % were malaria cases.
To compute the attributable fraction (AF) of malaria, monthly data from CSEM were used from 2006 to 2014 and aggregated on a monthly basis. This clinic is the oldest health centre in Chimoio accounts for 57 % of all malaria cases in the period (227,814).
The AF of malaria was calculated using the following formula:
Population estimates for Chimoio by locality, gender, and age for the years 2006–2014 were calculated based
AF (%) = Malaria Cases
Total Visits × 100.
on the 2007 national census using the mean annual popu-lation growth rate for Chimoio of 3.5 %. Average popula-tion for the study period was calculated (Table 1).
Data analysis
Total malaria cases per week were derived from the col-lected data adjusted to the population increase per year (3.5 %). The malaria incidence per 100 person-year was calculated from the total number of cases occurring in each week in each Bairro divided by the total person-week and then multiplied by 100.
Linear trend analysis, and multi-way ANOVA to test difference between years and weeks using Tukeys’ test for mean separation were performed. Chi square for
Incidence rate(%) = No. of cases
Population Size × 100.
proportion of gender and age and Phi, Cramer’s V test was used for statistical significance. Regression analysis to test association between malaria cases and population density of residential areas was performed. Temporal and spatial hierarchical cluster analysis using square Euclid-ean distance was performed to identify cluster between the weeks and between residential areas in malaria inci-dence and dendrograms were produced. All tests were performed using Microsoft Excel (Analysis Tool pak) and SPSS IBM version 20; spatial maps were produced to ana-lyse spatial variation along the years using ArcGis version 10.1.
Results
Malaria cases and incidence in Chimoio
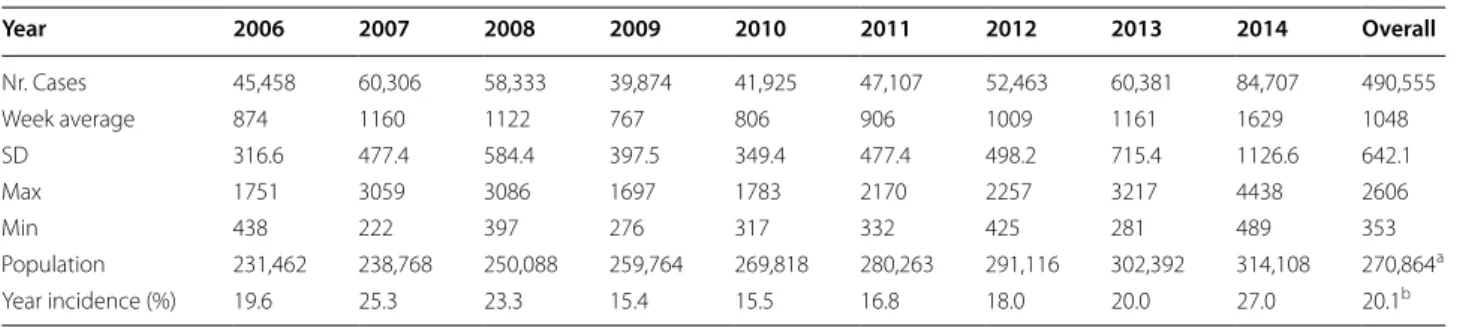
Table 1 reports that malaria cases in Chimoio between 2006 and 2014 amounted to 490,555. In 2010 the
Fig. 2 Partial view of Chimoio. 1 = Urban, 2 = Suburb, 3 = Rural Google maps, 20/4/2016
Table 1 Weekly cases of malaria in Chimoio 2006–2014
a Average Population
b average cases/divided by average population × 100
Year 2006 2007 2008 2009 2010 2011 2012 2013 2014 Overall Nr. Cases 45,458 60,306 58,333 39,874 41,925 47,107 52,463 60,381 84,707 490,555 Week average 874 1160 1122 767 806 906 1009 1161 1629 1048 SD 316.6 477.4 584.4 397.5 349.4 477.4 498.2 715.4 1126.6 642.1 Max 1751 3059 3086 1697 1783 2170 2257 3217 4438 2606 Min 438 222 397 276 317 332 425 281 489 353 Population 231,462 238,768 250,088 259,764 269,818 280,263 291,116 302,392 314,108 270,864a Year incidence (%) 19.6 25.3 23.3 15.4 15.5 16.8 18.0 20.0 27.0 20.1b
fewest cases were recorded, 41,925, and then in 2014 they almost doubled to 84,707. The incidence of malaria decreased from 2006 to 2010 and increased from 2012 to 2014. The annual average incidence of malaria was 20.5 % with a maximum of 25.3 % in 2007 and a minimum of 15.5 % in 2010.
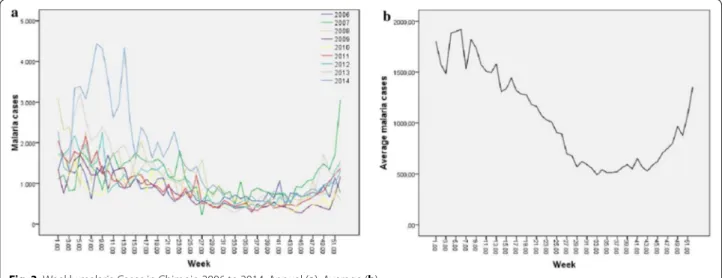
Figure 3 presents the temporal linear trend of malaria in Chimoio. Figure 3a shows the temporal distribution of Malaria for each year and Fig. 3b shows the average vari-ation over the 9 years. In terms of weeks, the lowest week recorded was 222 cases per week in week 27 in 2007 and the highest record was 4438 in week 8 in 2014. There is a high weekly variation in malaria cases ranging from 222 to 4438 cases per week, CV, 61 % (1A).
On average week 6 presents the highest cases of malaria with 1919 cases and week 33 the lowest 419 (3B). Malaria weekly average was 1048 (sd 642.1) cases ranging from 806 cases in 2010 to 1629 cases in 2014. Malaria cases (1048) presented a difference between years (p < 0.05), the calculated F value was 22.1 while the critical table value was 1.96. Malaria cases (1048) also shows a differ-ence between weeks (p < 0.05), the calculated F value was 11.55 while the critical table value was 1.38.
Table 2 presents the summary and the mean separation of malaria cases between the years. Years 2009 and 2010 differs from years 2006, 2007, 2008, 2011, 2012, and 2013; and year 2014 differs from the other years in malaria cases.
Temporal clusters of malaria in Chimoio
A temporal cluster analysis of malaria occurrence was performed and the results are summarized in the den-drogram in Fig. 4. Three temporal clusters of malaria were identified: cluster 1 comprises weeks 25–47 with an
average of weekly cases of 618 (sd = 251.9), 44 % of the total weeks, representing the dry season; cluster 2 com-prises weeks 18–24 and 48–51 with an average for weekly cases of 1066 (sd = 317.4), 21 % of the total weeks, the intermediate season; Cluster 3 comprises weeks 1–17 and 52 with an average for weekly cases of 1587 (sd = 722.4), 35 % of the total weeks, the wet season.
There is a difference (p < 0.05) between cluster 1 (618), cluster 2 (1066) and cluster 3 (1587). The calculated F value was 185.35 while the critical table value was 3.02. Table 3 presents the malaria cases mean separation between the three clusters.
Malaria cases by gender and age
In terms of gender, there is no overall difference (p > 0.05) between women (51 %), and men (49 %), between adult women (52 %) and adult men (48 %), or female children (50.3 %) and male children (40.7 %), Chi square 2, df = 1. In terms of age, out of 490,555 cases of malaria in Chimoio, 235,830 (48 %) were in chil-dren under 5 years and 254,725 (52 %) in patients over 5 years old. A difference (p < 0.001) is clear between these two groups, the calculated Pearson Chi Square was 48; df = 1.
Attributable fraction of malaria in Chimoio
Figure 5 presents the trend of malaria cases and patient visits to CSEM from 2006 to 2014 and the monthly AF. From 2006 to 2014 CSEM was visited by 1885,195 patients and 259,252 were tested positive for malaria (5A). The monthly peak of malaria was in February for years 2006, 2007, 2010, 2011, 2012, 2013, March for years 2009 and 2014, and December for year 2008 (5B). The annual average AF of malaria was 16 %.
Years 2010, 2011, and 2012 recorded the lowest AF of malaria in Chimoio, 5.7 % and the year 2009 the high-est, 27 %. There is no difference (p > 0.05) in AF malaria among years, the calculated Pearson Chi Square was 54.00, df = 48. There is a difference (p < 0.001) in AF malaria among months, the calculated Pearson Chi Square was 913.349, df = 693.
Relationship between malaria cases and population density
Figure 1 presents the Chimoio population density per bairro, and the population density varies from 28 to 17,049 (person/km2). A regression analysis was
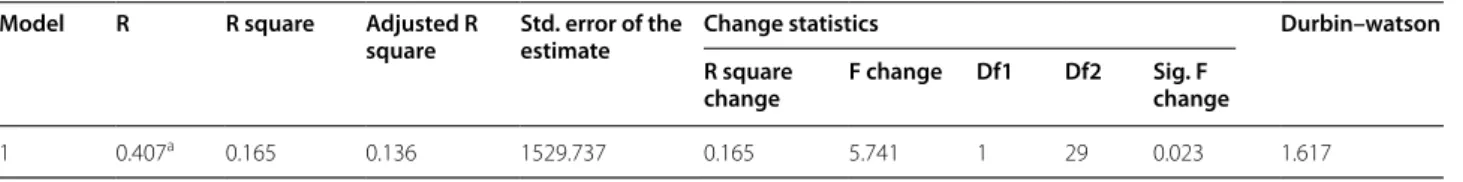
performed to determine the association between popula-tion density by residential area and malaria cases. From Table 4 it is clear that there is a medium positive corre-lation, r = 0.407 between malaria cases and population density and the r2 value indicates 0.165, which implies
that 16.5 % of malaria cases are attributed to population density. At 0.05 significance level the calculated F value is 5.741 while the critical table value is 1.344. Thus, malaria cases significantly depend on population density.
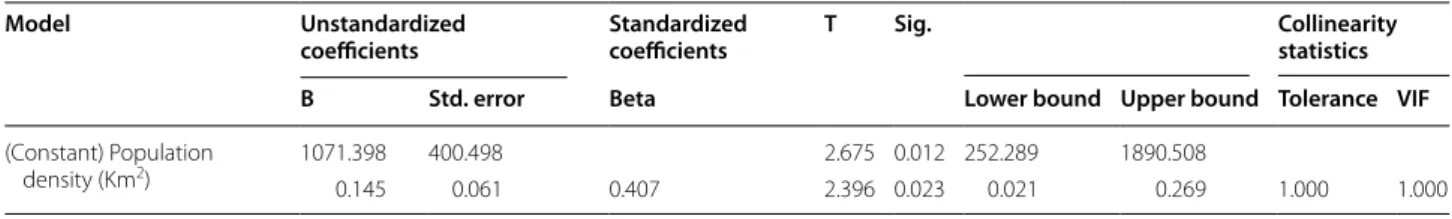
Furthermore, from the coefficients in Table 5, the beta value is positive (0.407), That is, as population density increases malaria cases increase as well.
Malaria clusters per residential area
Figure 6 presents the dendrogram clusters by residential areas. Three clusters were identified. Cluster 1 comprises the following bairros: Bairro 1, 2, 4, Herois Mocambica-nos, 7 de Abril, 7 de Setembro, Bloco 9, Nhamatsane, Tembwe, Agostinho Neto and Eduardo Mondlane. The average incidence is 10.6 % and represents 35 % of the Bairros of the municipality, most of them urban areas.
Table 2 Summary and malaria cases mean separation between years
a, b, c Different letters indicate difference between years. Tukeys’ test (p < 0.05)
(years) 2009 2010 2006 2011 2012 2008 2007 2013 2014
N 52 52 52 52 52 52 52 52 52
Mean* 767a 806a 874b 906b 1009b 1122b 1160b 1161b 1629c
SD 397.5 349.43 316.56 477.44 498.16 584.45 477.45 715.42 1126.62
Fig. 4 Temporal Cluster of Malaria in Chimoio 2006–2014
Table 3 Summary week cluster malaria mean separation
a, b, c Different letters indicate difference between years. Tukeys’ test (p < 0.05)
Groups Cluster 1 Cluster 2 Cluster 3
N 207 99 162
Mean* 618a 1066b 1587c
Cluster 2, comprises the following Bairros: Hombwa, Josina Machel, 3 de Fevereiro, Vila Nova, Mudzingazi, Bairro 3, 5, Nhamadjessa, Nhamaonha, Francisco Man-yanga, 25 de Junho, Centro Hipico, Textafrica, 16 de Junho, and Chinfura. The average incidence is 21.9 % and represents 8 % of the Bairros of the Municipality, most of them are suburbs. Finally, cluster 3 comprises the fol-lowing Bairros: Nhauriri, Chissui, Sitanha, 1 de Maio and Trangapasso. The average incidence is 28.4 % and represents 16 % of the bairros of the municipality, which are mostly rural areas. There is a difference (p < 0.05) between malaria clusters, and the calculated Pearson Chi Square was 7.99.00, df = 2.
Malaria prevalence from 2010 to 2014
Figure 7 depicts the incidence of malaria for the 5 years under analysis (2010–2014). Figure 7a–e shows the spa-tial distribution of malaria for each year and Fig. 7f shows the spatial variation over the 5 years. It is possible to see that the incidence of malaria varies spatially in the Chi-moio Municipality. The areas located in the north of
the municipality (Agostinho Neto, Herois Mocambica-nos, Tembwe, and Hombwa) show values consistently below average of up to 1.5 standard deviations whereas areas located in the southeast (Trangapasso) and south-west (Nhaurire and Textafrica) of the district show val-ues consistently above the average of up to 2.5 standard deviations.
In terms of malaria variation, from 2009 to 2014 Sitanha, the most rural bairro, presented a reduction of malaria incidence from 5 to 15 %; Nhamatsane, Herois Mocambicanos, Tembwe, and Hombwa, rural bairros, and Bairro 1, 2, 3, 4, and Bloco 9 urban bairros, presented a reduction of 4–6 %. Bairros 1o de Maio, Francisco
Manhanga and Nhamaonha, new suburbs, presented the highest increase of 7–26 % and the rest of the bair-ros, which are old suburbs had an increase from 7 to 16 %. Overall, and for the 5 years, malaria incidence has increased between 7 and 26 % in the bairros situated in the central eastern part of the municipality (suburbs) and decreased between 4 and 15 % in the other areas (rural and urban).
Fig. 5 a Malaria cases and patient visits. b Attributable fraction of Malaria
Table 4 Model summary regression malaria cases and population density
a Predictors: (constant), population density (km2) b Dependent variable: Malaria Cases
Model R R square Adjusted R
square Std. error of the estimate Change statistics Durbin–watson
R square
change F change Df1 Df2 Sig. F change
Discussion
Malaria epidemiology has never been investigated in the study area before. The overall annual incidence of malaria in Chimoio was 20.5 %. Maputo city reported 15.7 % [19] and Manica Province 43 % [7]. Incidence of malaria in Chimoio is lower than in Manica Province due to the fact that Chimoio is an urban area and residents have more resources for malaria prevention, and the weather is cooler than in many parts of the country. Overall malaria cases and incidence have been increasing in Chimoio in
recent years, especially in suburbs. After a decrease in 2010 with 41,925 cases reported and 15.5 % incidence, 84,704 cases were reported in 2014, showing an inci-dence of 27 %.
These results are in concordance with a study of pat-terns and trends of malaria conducted in Kenya that found an increase of 111.13 and 109.52 % per annum in 1988–2002 and 1998–2005 respectively for morbidity and hospitalization [20]. This increase in the Chimoio results is probably due to the 3.5 % annual increase in
Table 5 Regression coefficients
Malaria cases and population density Dependent variable: malaria cases
Model Unstandardized
coefficients Standardized coefficients T Sig. Collinearity statistics
B Std. error Beta Lower bound Upper bound Tolerance VIF
(Constant) Population
density (Km2) 1071.398 400.498 2.675 0.012 252.289 1890.508
0.145 0.061 0.407 2.396 0.023 0.021 0.269 1.000 1.000
Fig. 7 Incidence of malaria. a–e Spatial distribution. f Spatial variation. Chimoio Bairros: 1 = Agostinho Neto, 2 = Herois Moçambicanos, 3 =
population, reduced efforts to combat malaria and per-sistent poverty. However this is contrary to reports of a substantial reduction of malaria incidence in sub-Saha-ran Africa [2, 21].
The greatest number of cases occurs mostly in Febru-ary (peak of the rainy season) and the fewest number of cases in September (dry season). This is in concordance with [6] who finds that the peak of malaria in Mozam-bique occurs during the rainy season. It should the noted that the 20.5 % incidence may be overestimated as it does not consider the same people being diagnosed more than once in a year, or underestimated since generally there are cases that are not reported, especially those which are far from health centres, self medication, and use of tradi-tional healers.
It was reported that in Chimoio the land cover is changing towards less vegetation [8, 9, 22, 23, 24] claim that the urbanization process results in profound socio-economic and landscape changes that reduce malaria in urban areas, this is in line with findings of this study that the incidence of malaria is decreasing in rural areas. The results of this study differ from those in Amazonia, where the population increase resulted in occupation of more space and increases in disease incidence [11, 25]. There is a difference in malaria occurrence between years and this is in line with [1, 6].
Contrary to most research [3, 21], this study did not find any difference between women and men in malaria cases, between adult women and adult men, or between female children and male children. The chances of getting malaria are the same (gender equality) in Chimoio. This can be explained by the high malaria incidence in the area, which puts the entire population at risk [6].
There was a difference between children under 5, (48 %) and population over five (52 %). Children under five com-prise 17 % of the population of Chimoio but accounted for 48 % of the malaria cases, almost three times more. This disproportion is also reported by other authors [3,
7]. This is probably due to the fact that children under 5 years of age have little immunity to the malaria parasite.
Very few studies have been carried out using weekly data [26, 27]. Most use monthly data and differentiate malaria cases between dry and rainy season or cooler and hot seasons [28–30]. The results of this study almost coincide with the results of Westerink [18] who reported that Chimoio has 201 dry (29 weeks), 41 intermediate (6 weeks), and 123 wet days (17 weeks), suggesting that malaria cases vary in these three periods. In terms of Pre-cision Public Health, the three distinct periods should have different approaches regarding prevention and combat.
The attributable fraction of malaria was 16 %. In Mozambique 45 % of all cases in outpatient visits are due
to malaria [3] and in Manica Province 43 % [7], mean-ing that the AF of malaria in Chimoio is almost a third of the province and the country value. This may be due to the cooler weather and the fact that country averages include rural areas, where there is more malaria than in cities, and in the cities there are more malaria control interventions.
In terms of malaria cases related to population den-sity, there was a medium positive correlation r = 0.407 between the population density and malaria incidence and the R2 value indicates 0.165, which implies that
16.5 % of malaria cases are attributed to population density. The extremes of both low and high population density modify malaria transmission and have profound consequences for estimates of Chimoio´s Mozambique public health burden.
In terms of residential areas, annual malaria incidence varies from 9 to 45 %, meaning that Chimoio is an area with hypo endemic and mesoendemic malaria [31]. In terms of malaria spatiality, in rural areas malaria inci-dence is decreasing, probably due to the reduction in vegetation cover and deforestation, and in urban areas probably due to availability of better measures and liv-ing conditions. In suburban areas malaria incidence is increasing, probably due to increasing poverty, poor sani-tation and poor living conditions. Other studies report the same pattern of findings [7, 21].
Conclusions
This study concludes that in Chimoio the incidence of malaria presents a spatial and temporal pattern. Malaria cases have been increasing over the years, especially in suburbs, and there is a difference in malaria cases by year and weeks. There is no gender difference in malaria cases. Children under 5 years of age are three times more prone to get malaria than the rest of the population. There are three different periods of malaria in Chimoio: hot and rainy season, dry and cool season, and hot and dry sea-son (dry, wet, and intermediate). Sixteen percent of vis-its to the health centres are from malaria patients. The rural areas of the municipality have more malaria cases, followed by suburbs, and urban areas have fewer malaria cases. Overall, and for the 5 years studied malaria inci-dence has increased between 7 and 26 % in the bairros situated in the east central part of the municipality (sub-urbs) and decreased between 4 and 15 % in the other areas (rural and urban).
Precision Public Health strategies that target malaria weekly according to the positive cases, and temporal and spatial distribution can be formulated to combat and eradicate malaria in Chimoio Municipality. Studies on weather and climate factors affecting malaria, bed net usage, and others should be undertaken.
• We accept pre-submission inquiries
• Our selector tool helps you to find the most relevant journal
• We provide round the clock customer support
• Convenient online submission
• Thorough peer review
• Inclusion in PubMed and all major indexing services
• Maximum visibility for your research Submit your manuscript at
www.biomedcentral.com/submit
Submit your next manuscript to BioMed Central
and we will help you at every step:
Authors’ contributions
JLF was involved in the conceptualization, research design, data collection, implementation and manuscript writing. JMM and MP contributed in analysis and manuscript revision. SZJ was involved in field data collection from residences from CSEM, CS Nhamaonha, and CS 7 de Abril. All authors read and approved the final manuscript.
Author details
1 Engineering Faculty, Mozambique Catholic University, Chimoio,
Mozam-bique. 2 NOVA Information Management School, Universidade Nova de
Lisboa, Lisbon, Portugal. 3 Manica Provincial Directorate of Health, Chimoio,
Mozambique.
Acknowledgements
We would like to thank the District Director of Health Dr. Flavio Alberto for granting permission for data collection. Dr. Elisa from the Provincial Directorate of Heath of Manica for providing the provincial records of Malaria, and Manuel M. Munrova, who contributed to the maps.
Competing interests
The authors declare that they have no competing interests.
Funding
Personal resources were used to carry out the study. Received: 27 February 2016 Accepted: 2 June 2016
References
1. Centre for Disease Control and Prevention. Impact of Malaria. CDC 2014. 2. Word Health Organization. Malaria Fact sheet N°94, Media centre, 2013. 3. UNICF. Malaria. 2013. http://www.unicef.org/health/index_malaria.html. 4. Gallup JL, Sachs J. The economic burden of malaria. Centre for
Interna-tional Development at Harvard. Am J Trop Med Hyg. 2001;64:85–96. 5. Global Health Group. Malaria elimination initiative. Country Briefings
2013.
6. Zacarias OP, Andersson M. Spatial and temporal patterns of malaria inci-dence in Mozambique. Malar J. 2011;10:189. http://www.malariajournal. com/content/10/1/189.
7. Instituto Nacional de Estatística. Inquérito Demográfico e de Saúde. Moçambique: Instituto Nacional de Estatística; 2013.
8. Hay SI, Guerra CA, Tatem AJ, Atkinson PM, Snow RW. Urbanization, malaria transmission and disease burden in Africa. Nat Rev Microbiol. 2005;3:81–90.
9. Hay SI, Smith DI, Snow RW. Measuring malaria endemicity from intense to interrupted transmission. Lancet Inf Dis. 2008;6:369–78.
10. Qiuyin QM, Elyazar IRF, Gethings PW, Hay SI, Tatem JA, Guerra CA. The effects of urbanization on global Plasmodium vivax malaria transmission. Malar J. 2012;11:403.
11. Saraiva MGG, Amorim RDS, Moura DS, Marco AS, Martinez-Espinosa FE, Barbosa MGV. Urban expansion and spatial distribution of malaria in the municipality of Manaus, State of Amazonas. Rev Soc Bras Med Trop. 2009;5:515–22.
12. Thompson R, Begtrup K, Cuamba N, Dgege M, Mendis C, Gamage-Mendis A, et al. The Matola malaria project: a temporal and spatial study of malaria transmission and disease in a suburban area of Maputo, Mozambique. Am J Trop Med Hyg. 1997;5:550–9.
13. Health Geomatics. Mapping malaria risk in Africa/Atlas du risque de la malaria en Afrique. 2004.
14. Centre for Disease Control and Prevention. Precision Public health and precision medicine. Two Peas in a Pod. 2015.
15. João ZS, Ferrão JL. Causas de mortalidade em Chimoio em 2013. Proceedings 8ª Jornadas Cientificas e Tecnologias de Moçambique 2015 FNI MCTESTP. http://www.mctestp.gov.mz/?q=content/ fundo-nacional-de-investigao.
16. Global Health Science. Swaziland leads sub Saharan Africa in ending malaria, aims to eliminate by 2015. USCF. 2012. http://globalhealthsciences.ucsf.edu/news-events/
swaziland-leads-sub-saharan-africa-in-ending-malaria-aims-to-elimi-nate-by-2015.
17. Instituto Nacional de Estatística. III Recenseamento geral da população e habitação 2007. Indicadores sociodemográficos distritais da Província de Manica. Instituto Nacional de Estatística. Moçambique 2007.
18. Westerink, R M. Os Solos da parte sul do distrito de Gondola, Provín-cia de Manica. Serie Terra e Agua, Instituto Nacional de Investigação Agronómica 1995:79.
19. Oliveira MA, Muthemba R, Morgan JSE, Roberts JMM, Mabunda S. Prevalence of malaria among patients attending public health facilities in Maputo city, Mozambique. Am J Trop Med Hyg. 2011;85:1002–7. 20. Kacey CE, Kim AL, David K, Sumba PO, Dickens OK, Chandy CJ, Mark LW.
Environmental, socio-demographic and behavioural determinants of malaria risk in the western Kenyan highlands: a case–control study. Trop Med Int Health. 2009;14:1258–65.
21. WHO. World Malaria Report. Geneva, World Health Organization. 2014. 22. Mamurove, MAM, Pacheco, JAA. Analise multitemporal do uso e
cobertura do solo no Município de Chimoio. Proceedings, 8ª Jornadas Cientificas e Tecologicas de Mocambique 2015 FNI MCTESTP. 23. United Nations Human Settlements Programme. The Millennium
Devel-opment Goal and Urbun Sustainability, 30 Years of Shaping the Habitat Agenda, United Nations Human Settlements Programme 2007. 24. Kumar DS, Ramachandran AR, Rajan R, Venkatesan MS. Spatial trend,
environmental and socioeconomic factors associated with malaria preva-lence in Chennai. Malar J. 2014;13:14.
25. Tatem AJ, Gething PW, Smith DL, Hay SI. Urbanization and the global malaria recession. Malar J. 2013;12:133.
26. Kim YM, Parj JW, Cheong HK. Estimated effect of climatic variables on the transmission of Plasmodium vivax malaria in the Republic of Korea. Environ Health Perspect. 2012;120:1314–9.
27. Krefis CA, Schwarts N. Modelling the relationship between precipitation and malaria in children from a holoendemic area in Ghana. Am J Trop Med Hyg. 2011;84:285–91.
28. Omonijo AG, Matzarakis AO, Oguntoke O, Adeofun CO. Influence of weather and climate on malaria occurrence based on Human-Biometeorological methods in Ondo State, Nigeria. J Environ Sci Eng. 2011;5:1215–28.
29. Tonui WKO, Samuel CJ, Kabiru W, Ephantus W, Kiplagat WK. Patterns and trends of malaria morbidity in western highlands of Kenya. Int J Educ Res. 2013;12:1–8.
30. Yeshiwondim AK, Gopal G, Hailemariam TA, Dengela DO, Patel PH. Spatial analysis of malaria incidence at the village level in areas with unstable transmission in Ethiopia. Int J Health Geogr. 2009;8:5.
31. Worrall E, Basub S, Hansona H. Is malaria a disease of poverty? A review of the literature. Trop Med Int Health. 2005;10:1047–59.