Coordination of Independent Distributed
Generation and Controllable Load
José Alberto da Cunha Barros
Dissertation submitted to the Faculty of Engineering of University of Porto in partial fulfilment of the requirements for the degree of
Doctor of Philosophy
Supervisor: Prof. Hélder Filipe Duarte Leite Lecturer at the
Department of Electrical and Computer Engineering Faculty of Engineering, University of Porto
Co-supervisor: Prof. Nick Jenkins Professor at the
Institute of Energy
School of Engineering, Cardiff University United Kingdom
February 2013 (Original Version)
iii
This work was financially supported by FCT – Fundação para a Ciência e
v
“I have nothing to offer but
blood, toil, tears and sweat.”
vii
Abstract
The research carried out focuses on the way generators connect to distribution networks. Permission to connect a generator to the distribution system is generally obtained on the basis that the generator’s effect is limited and that the network voltages and currents remain acceptable at all times. This firm access connection policy limits the capacity of generation that can be connected.
Generators may be allowed to connect to distribution networks above the limit defined by the firm access connection policy. When there is inadequate capacity in the system, the non-firm generators are generally constrained off on a “last-in, first-off” basis (the last to connect is the first to be affected). Only the order of connection of the generators is taken into account. Different costs of operation and ability to be dispatched are not considered. Thus, the firm access connection policy does not maximise the economic value of the generators.
The coordination of independent distributed generators is formulated in this research to maximise the income received by the generators. The coordination schedules generators connected to the same circuit according to their different costs of operation and ability to be dispatched, without exceeding the power limit of the circuit. Additional income is obtained by the generators for the additional electricity sold and the substitution of expensive generators by cheaper ones. An income-sharing mechanism based on cooperative game theory to share the additional income is outlined. The objective is to provide the generators an economic incentive to be operated in a coordinated manner.
Demand side flexibility can be used to maximise the production of the generators. The coordination of generators and controllable load is devised in this research to maximise the income of the generators. Controllable load is asked to shift its consumption to allow the generators to maximise their production. The additional income resultant of the coordination is allocated to the generators and the controllable load. A bargaining approach of game theory is used to determine this allocation. The controllable load receives part of the additional income to cover the increase of its electricity bill and to incentivise its coordination with the generators. This study is then extended to consider energy storage systems instead of controllable load, in coordination with non-dispatchable generators.
A representative of the Portuguese distribution network is used to validate the coordination of independent distributed generators and the coordination of generators and controllable load. Four independent distributed generators and a load equivalent are connected to the network. A number of cases of wind power, price of electrical energy and load consumption are considered. Different costs of operation of the generators are analysed. Different levels of load flexibility and load capacity are evaluated.
ix
Resumo
A investigação desenvolvida concentra-se na ligação de geradores às redes de distribuição. A permissão para ligar um gerador à rede de distribuição é geralmente obtida no pressuposto que o seu efeito é limitado e que as tensões e correntes na rede se mantêm aceitáveis em todas as circunstâncias. Esta política de acesso firme limita a capacidade de geração que pode ser ligada.
Geradores podem obter autorização de ligação às redes de distribuição acima do limite definido pela política de acesso firme. Quando existe capacidade inadequada no sistema, os geradores sem acesso firme são geralmente restringidos segundo a regra “último a entrar, primeiro a sair”. Só a ordem de ligação à rede é tida em consideração. Diferentes custos de operação e capacidades de serem despachados não são considerados. Assim, a política de acesso firme não maximiza o valor económico dos geradores.
A coordenação de produtores dispersos independentes é formulada nesta investigação para maximizar o rendimento recebido pelos geradores. A coordenação escalona geradores ligados no mesmo circuito de acordo com os seus diferentes custos de operação e capacidades de serem despachados, sem exceder o limite de potência do circuito. Rendimento adicional é obtido pelos geradores pela energia adicional vendida e pela substituição de geradores caros por geradores mais baratos. Um mecanismo de partilha de rendimentos, baseado na teoria dos jogos cooperativos, para partilhar o rendimento adicional é delineado. O objectivo é fornecer aos geradores um incentivo económico para a sua operação de forma coordenada.
A flexibilidade da procura pode ser usada para maximizar a produção dos geradores. A coordenação de geradores e carga controlável é desenvolvida nesta investigação para maximizar o rendimento dos geradores. A carga controlável é chamada a transferir o seu consumo de forma a permitir aos geradores a maximização da sua produção. O rendimento adicional resultante da coordenação é alocado por geradores e carga controlável. Uma abordagem de negociação da teoria dos jogos é usada para determinar esta alocação. A carga controlável recebe parte do rendimento adicional para cobrir o aumento da sua conta da electricidade e para incentivar a sua coordenação com os geradores. Este estudo é em seguida estendido para incorporar sistemas de armazenamento de energia em vez de carga controlável, em coordenação com geradores não despacháveis.
Uma secção da rede de distribuição portuguesa é usada para validar a coordenação de produtores dispersos independentes e a coordenação de geradores e carga controlável. Quatro produtores dispersos independentes e um equivalente de carga estão ligados à rede. Alguns casos de potência de vento, preço da energia eléctrica e consumo da carga são considerados. Diferentes custos de operação dos geradores são analisados. Diferentes níveis de flexibilidade e de capacidade da carga são avaliados.
xi
Acknowledgements
When starting something from scratch, there is always a fine balance between doubt and thrill. This 4-year journey was really one of a kind and I would not have reached this point without the support of many.
I would like to express my gratitude to my supervisor, Prof. Hélder Leite, for his guidance, advice and practical support. His direction and motivation were fundamental for me to carry out this research.
I would like to thank also my co-supervisor, Prof. Nick Jenkins, for having me at Cardiff University and all the help and support provided. His supervision and critical input were vital for the development and outcome of this research.
My deep gratitude goes also to Dr. Jianzhong Wu, for his warm support and all the time he spent with me. I also thank Dr. Janaka Ekanayake, who kindly helped me in many ways during my stay in Cardiff.
My gratitude is extended to all researchers of the Smart Grid group of the Centre for Integrated Renewable Energy Generation and Supply (CIREGS) of Cardiff University, for their companionship and willingness to help. Many thanks to all friends I made in Cardiff, in particular Panos and Carlos. They made my stay in Cardiff even more memorable.
I express my appreciation to Prof. Peças Lopes and Prof. Pedro Flores Correia, members of my Supervising Committee, for their input in the research plan assessment meeting. Their input helped me to reroute my research towards its final outcome.
This endeavour would not have been possible without the tireless and loving care of my wife, Joana. I definitely dedicate this work to her. I could not have done this without the enormous inspiration and motivation you provided me.
Throughout this journey I always knew I could count with the priceless friendship of Bernardo, Emanuel, Francisco, Gustavo, Miguel, Vasco, Zé António and many others this space is too limited to mention you all. You know who you are. You make every mountain in my way seem much plainer.
Last but definitely not least, I am forever grateful to my parents, José and Maria Luisa, and brothers. You have always provided me the home I needed so I could pursue my hopes and dreams. I can never repay you enough.
xiii
Table of Contents
List of Figures ... xvii
List of Tables ... xxi
List of Abbreviations and Acronyms ... xxv
Chapter 1 - Introduction ... 1
1.1 - Scope of the research ... 1
1.2 - Research questions... 1
1.3 - Objectives of the research ... 1
1.4 - Distributed generation ... 2
1.4.1 - Definition ... 2
1.4.2 - Drivers for the increase of the connection of distributed generation ... 2
1.4.3 - Commercial incentives for the connection of distributed generation ... 3
1.5 – Demand-side integration ... 3
1.5.1 - Definition ... 3
1.5.2 - Drivers for the increase in demand-side integration ... 4
1.6 - Thesis structure ... 5
1.7 - Publications during the research ... 7
Chapter 2 - Background and literature review ... 8
2.1 - Introduction ... 8
2.2 - Integration of Distributed Generation ... 8
2.2.1 - Challenges to the connection of additional amounts of distributed generation ... 8
2.2.2 - Contributions to the integration of distributed generation ... 9
2.3 - Coordination of independent distributed generators ... 20
2.3.1 - Planning and economic assessment ... 20
2.3.2 - Network operator-driven coordination ... 21
2.3.3 - Market-driven coordination ... 23
2.3.4 - Comments on the reviewed approaches of the coordination of independent generation .. 25
2.4 - Applicability of game theory to the coordination of independent generation ... 25
2.4.1 - Non-cooperative and cooperative game theory ... 25
2.4.2 - Cooperative games with transferable utility ... 27
2.4.3 - Methods to solve cooperative games with transferable utility ... 27
2.4.4 - Application of game theory to electric power systems ... 31
2.5 - Demand-side integration in distribution network operation ... 31
2.5.1 - Mechanisms to implement demand-side integration ... 33
2.5.2 - Benefits of demand-side integration to the integration of generation ... 35
2.5.3 - Benefits of demand-side integration to the consumers ... 36
2.5.4 - Benefits of coordinating independent distributed generation and demand ... 36
xiv
Chapter 3 - Connection of generation to distribution networks ... 39
3.1 - Introduction ... 39
3.2 - Modelling of the distribution system analysed ... 39
3.3 - Operation of generators with firm access rights ... 41
3.3.1 - Limitation in the capacity that can be connected ... 41
3.3.2 - Technical possibility of connecting additional generation capacity ... 43
3.4 - Connection of generators without firm access rights ... 43
3.4.1 - Minimum cost operation of the distribution network ... 45
3.4.2 - Operation of the generators connected without firm access rights ... 46
3.5 - Summary ... 48
Chapter 4 - Coordination of independent distributed generators ... 49
4.1 - Introduction ... 49
4.2 - The coordination methodology ... 49
4.2.1 - Assumptions and limitations of the coordination ... 50
4.2.2 - Operation of the Aggregator ... 51
4.3 - Sharing the additional income obtained in coordination ... 54
4.3.1 - Income-sharing mechanism ... 54
4.3.2 - Assessment of the willingness of the dispatchable generators to participate in the coordination ... 56
4.4 - Application of the coordination of generators to a two-busbar distribution network ... 57
4.4.1 - Modelling of the two-busbar equivalent of the typical distribution network ... 57
4.4.2 - Description of the period of operation considered for evaluating the coordination of distributed generators ... 58
4.4.3 - Assessment of the coordination in the selected period of operation ... 60
4.4.4 - Allocation of the additional income to the generators ... 66
4.5 - Summary ... 69
Chapter 5 - Coordinating generators and controllable load ... 71
5.1 - Introduction ... 71
5.2 - Integration of a controllable load in the coordination ... 71
5.2.1 - Assumptions and limitations ... 71
5.2.2 - Operation of the Aggregator with the integration of the controllable load ... 72
5.3 - Allocation of the additional income obtained with the coordination of generators and controllable load ... 74
5.4 - Example of the coordination with a controllable load on the two-busbar distribution network ... 75
5.4.1 - Description of the price paid by the controllable load for buying electricity ... 76
5.4.2 - Assessment on the selected period of operation ... 77
5.4.3 - Sharing the additional income obtained with the coordination of the generators and the controllable load ... 83
xv
Chapter 6 - Coordinating non-dispatchable generators and energy storage
systems ...85
6.1 - Introduction ... 85
6.2 - Coordination with energy storage systems ... 85
6.2.1 – Assumptions and limitations ... 85
6.2.2 – Operation of the Aggregator ... 86
6.3 - Application of the coordination to a two-busbar distribution network ... 88
6.3.1 - Modelling of the distribution network ... 88
6.3.2 - Description of the set of extreme cases of price and wind power ... 89
6.3.3 – Distribution network operation with extreme cases of price and wind power ... 89
6.4 - Allocation of additional income obtained in coordination ... 92
6.4.1 – Allocation amongst generators ... 93
6.4.2 – Allocation amongst energy storage systems ... 93
6.5 - Sharing the additional income on the two-busbar distribution network example .... 94
6.5.1 – Additional income obtained during one year of operation ... 95
6.6 - Conclusion ... 96
Chapter 7 - Conclusions and future work ...97
7.1 - Contribution of this research ... 97
7.2 - Connection of generation to distribution networks ... 97
7.2.1 - Operation of the distribution network with generators connected with firm access rights only ... 97
7.2.2 - Operation of the distribution network with generators connected without firm access rights ... 97
7.3 - Coordination of independent distribution generators ... 98
7.3.1 - Sharing the additional income obtained in coordination ... 98
7.3.2 - Influence of different costs of operation on the additional income ... 98
7.3.3 - Influence of different technology coefficients on the additional income received by each generator ... 99
7.4 - Coordinating generators and controllable load ... 99
7.4.1 - Additional income considering a ±10% fraction of load flexibility ... 99
7.4.2 - Additional income considering a ±100% fraction of load flexibility ... 99
7.4.3 - Additional income considering different load capacities ... 99
7.4.4 - Sharing the additional income to the generators and the load ... 100
7.5 – Coordinating generators and energy storage systems ... 100
7.5.1 – Coordinated operation with extreme cases of price and wind power ... 100
7.5.2 – Sharing the additional income to the generators and energy storage systems ... 100
7.5.3 – Additional income obtained during one year of operation ... 100
7.6 - Future work ... 101
7.6.1 - Coordination of independent distribution generators ... 101
7.6.2 - Coordinating generators and controllable load ... 101
xvi
References ... 103 Appendix A - Cost-benefit analyses to determine the installed capacities of generators GenC and GenD ... 111 Appendix B - AC optimal power flow in the representative of the Portuguese MV distribution network ... 117 Appendix C - Data of the selected period of operation ... 121 Appendix D - Output powers of the generators without and with the coordination of independent distributed generators ... 125 Appendix E - Generation and consumption schedules without and with the
xvii
List of Figures
Figure 2.1 – “Last-in, first-off” access ... 15
Figure 2.2 – Pro-rata access ... 15
Figure 2.3 - One form of market-based access: capacity auction ... 15
Figure 2.4 - The concept of virtual power plant ... 23
Figure 2.5 – Classification of demand-side integration implementations by timing requirements ... 33
Figure 2.6 – Example of pricing schemes: a) time of use rates b) real-time pricing c) critical peak pricing ... 34
Figure 3.1 – 60 kV distribution network of Northeast Portugal ... 39
Figure 3.2 – Distribution network below Valpaços substation (rural distribution network) ... 40
Figure 3.3 - side, maximum load and generators not operating ... 42
Figure 3.4 - side, no load and generators operating at maximum output ... 42
Figure 3.5 - Operation of the distribution network during 24 hours, with the generators producing and with a typical load curve ... 44
Figure 3.6 - Distribution network with the four generators (GenA and GenB are firm connected, GenC and GenD have no firm access rights) ... 45
Figure 3.7 - Operation of the distribution network with the four generators in hour 23, with minimisation of the costs of producing active power (AC OPF) ... 46
Figure 3.8 - Operation of the distribution network during 24 hours, with the four generators producing and with a typical load curve ... 47
Figure 4.1 - The Aggregator operating the coordination of distributed generators ... 52
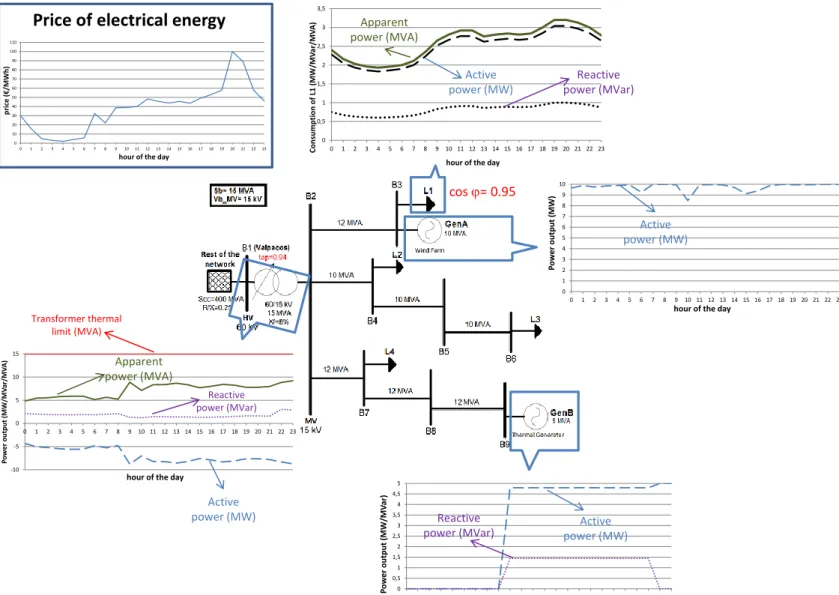
Figure 4.2 – Two-busbar distribution network used to evaluate the coordination ... 57
Figure 4.3 - Three profiles of one day of price of electrical energy... 59
Figure 4.4 - Three profiles of one day of wind power ... 59
Figure 4.5 - Two profiles of one day of load ... 59
Figure 4.6 - Output powers of the generators without coordination (day 1) ... 61
Figure 4.7 - Output powers of the generators without coordination (day 4) ... 61
Figure 4.8 - Coordinated output powers of the generators (day 1) ... 61
Figure 4.9 - Coordinated output powers of the generators (day 4) ... 61
Figure 4.10 - Output powers of the generators without coordination (day 2) ... 62
Figure 4.11 - Output powers of the generators without coordination (day 5) ... 62
Figure 4.12 - Coordinated output powers of the generators (day 2) ... 63
Figure 4.13 - Coordinated output powers of the generators (day 5) ... 63
Figure 4.14 - Output powers of the generators on days 3 and 6 - no excess power observed in the distribution circuit ... 64
Figure 4.15 - Additional income obtained on each day with different costs of fuel of GenC ... 64
Figure 4.16 - Coordinated output powers of the generators in point A ... 65
Figure 4.17 - Output powers of the generators in point B ... 65
Figure 4.18 - Additional income obtained on the selected week of operation with different costs of fuel of GenC ... 65
xviii
Figure 4.20 - Sharing of the additional income obtained on day 2 (86.49€) ... 67
Figure 4.21 - Sharing of the additional income obtained on day 4 (162.84€) ... 67
Figure 4.22 - Sharing of the additional income obtained on day 5 (211.08€) ... 68
Figure 4.23 - Effect in the additional income of GenC of its reduction to allow GenD to produce, considering different technology coefficients ... 69
Figure 5.1 – Operation of the Aggregator with the integration of a controllable load in the coordination ... 72
Figure 5.2 – Inputs, parameters and outcomes of the Aggregator in the coordination of generators and controllable load ... 72
Figure 5.3 - Price paid by the controllable load for buying electricity on days 1 and 4 ... 76
Figure 5.4 - Price paid by the controllable load for buying electricity on days 2 and 5 ... 76
Figure 5.5 - Price paid by the controllable load for buying electricity on days 3 and 6 ... 77
Figure 5.6 - Consumption schedule of the controllable load with a ±10% fraction of load flexibility on day 1 (no coordination with the generators) ... 77
Figure 5.7 - Coordinated output of the generators with a ±10% fraction of load flexibility on day 1 (without coordination with the controllable load) ... 78
Figure 5.8 - Consumption of the controllable load after the operation of the coordination of generators and controllable load, with a ±10% fraction of load flexibility on day 1 ... 78
Figure 5.9 - Consumption schedule of the controllable load with a ±100% fraction of load flexibility on day 1 (no coordination with the generators) ... 79
Figure 5.10 - Coordinated output of the generators with a ±100% fraction of load flexibility on day 1 (without coordination with the controllable load) ... 79
Figure 5.11 - Consumption of the controllable load after the operation of the coordination of generators and controllable load, with a ±100% fraction of load flexibility on day 1 ... 80
Figure 5.12 - Consumption schedule of the controllable load with a ±100% fraction of load flexibility on day 2 (no coordination with the generators) ... 80
Figure 5.13 - Coordinated output of the generators with a ±100% fraction of load flexibility on day 1 (without coordination with the controllable load) ... 81
Figure 5.14 - Consumption of the controllable load after the operation of the coordination of generators and controllable load, with a ±100% fraction of load flexibility on day 2 ... 81
Figure 5.15 – Output powers of the generators after the coordination with the controllable load, with a ±100% fraction of load flexibility on day 2 ... 81
Figure 5.16 – Additional income obtained with the coordination considering different fractions of controllable load and load capacities ... 82
Figure 6.1 - The Aggregator operating the coordination of non-dispatchable generators and energy storage systems ... 86
Figure 6.2 – Two-busbar distribution network used to evaluate the coordination ... 88
Figure 6.3 - Three profiles of one day of price of electrical energy ... 89
Figure 6.4 - Three profiles of one day of wind power ... 89
Figure 6.5 - Output powers of the generators and the energy storage system in “last-in, first-off operation” when GenB is connected last (day 1) ... 90
Figure 6.6 - Output powers of the generators and the energy storage system in “last-in, first-off operation” when GenB is connected last (day 2) ... 90
xix
Figure 6.7 - Output powers of the generators and the energy storage system in “last in, first-off
operation” when GenB is connected last (day 3) ... 90
Figure 6.8 - Output powers of the generators and the energy storage system in “last-in, first-off operation” when ES connects last (day 1)... 91
Figure 6.9 - Output powers of the generators and the energy storage system in “last-in, first-off operation” when ES is connected last (day 2) ... 91
Figure 6.10 - Output powers of the generators and the energy storage system in coordination (day 1) . 91 Figure 6.11 - Output powers of the generators and the energy storage system in coordination (day 2) . 93 Figure 6.12 – connected last ... 94
Figure 6.13 – ring one year when: i) GenB is connected last; ii) ES is connected last ... 95
Figure 6.14 – when: i) GenB is connected last; ii) ES is connected last ... 96
Figure A1 - Wind speed average time series from a Portuguese wind farm (May 2010-May 2011) ... 111
Figure A2 – Power curve of wind turbine Vestas V80 ... 111
Figure A3 – Cumulative wind power curve from May 2010 to May 2011 ... 112
Figure A4 – Price of electrical energy of the Iberian Electricity Market (Portuguese side) during one year (May 2010 to May 2011) ... 112
Figure A5 – Net Present Value at the end of the investment with different ratings of GenC ... 113
Figure A6 – Net Present Value at the end of the investment with different ratings of GenD ... 115
xxi
List of Tables
Table 2.1 – Summary of the contributions to the integration of DG ... 19
Table 2.2 – Marginal contributions of each player in a 3-player game ... 30
Table 2.3 – Marginal contribution vectors of a 3-player game ... 31
Table 2.4 - Applications of energy storage systems ... 32
Table 3.1 - Distribution substation loads and MV-connected distributed generation output, 20/12/2007 at 8.30 a.m. ... 40
Table 4.1 – Parameters of the system ... 58
Table 4.2 - Selected period of operation used for the evaluation of the coordination ... 59
Table 4.3 - Average price of electrical energy on each day of the selected period of operation ... 59
Table 4.4 - Average wind power on each day of the selected day of operation ... 59
Table 4.5 - Average load on each day of the selected period of operation ... 59
Table 4.6 - Electrical energy produced and income received by each generator without and with coordination (day 1) ... 62
Table 4.7 - Electrical energy produced and income received by each generator without and with coordination (day 4) ... 62
Table 4.8 - Electrical energy produced and income received by each generator without and with coordination (day 2) ... 63
Table 4.9 - Electrical energy produced and income received by each generator with and without coordination (day 5) ... 64
Table 4.10 - Technology coefficients used in the income-sharing mechanism ... 66
Table 4.11 - Income received by each generator without coordination and with the income-sharing mechanism (day 1) ... 67
Table 4.12 - Income received by each generator without coordination and with the income-sharing mechanism (day 2) ... 67
Table 4.13 - Income received by each generator without coordination and with the income-sharing mechanism (day 4) ... 68
Table 4.14 - Income received by each generator without coordination and with the income-sharing mechanism (day 5) ... 68
Table 5.1 – Additional income obtained with the coordination, with a ±10% fraction of load flexibility on day 1 ... 78
Table 5.2 - Additional income obtained with the coordination, with a ±10% fraction of load flexibility on days 2 to 6 ... 78
Table 5.3 - Additional income obtained with the coordination of generators and controllable load, with a ±100% fraction of load flexibility on day 1 ... 80
Table 5.4 - Additional income obtained with the coordination of generators and controllable load, with a ±100% fraction of load flexibility on day 2 ... 82
Table 5.5 - Additional income obtained with the coordination of generators and controllable load, with a ±100% fraction of load flexibility on days 4 to 6 ... 82
Table 5.6 – Income received by each generator considering a ±100% fraction of load flexibility on day 1, considering: “last-in, first-off” operation; coordination of distributed generators; coordination of generators and controllable load ... 83
xxii
Table 5.7 - Income received by each generator considering a ±100% fraction of load flexibility on day 2, considering: “last-in, first-off” operation; coordination of distributed generators; coordination of generators and controllable load ... 84 Table 6.1 - Parameters of the system ... 88 Table 6.2 - Selected period of operation used for the evaluation of the coordination ... 89 Table 6.3 - Electrical energy produced and income of each generator and energy storage system with coordination and in “last-in, first-off” operation (day 1) ... 92 Table 6.4 - Electrical energy produced and income of each generator and energy storage system with coordination and in “last-in, first-off” operation (day 2) ... 92 Table 6.5 - Income received by each generator and energy storage system as determined by Eqs. (6.13) and (6.14) when GenB is connected last (day 1) ... 94 Table 6.6 - Income received by each generator and energy storage system as determined by
Equations (6.13) and (6.14) when ES is connected last (day 1) ... 94 Table 6.7 - Income received by each generator and energy storage system as determined by
Equations (6.13) and (6.14) when GenB is connected last (day 2) ... 95 Table 6.8 - Income received by each generator and energy storage system as determined by
Equations (6.13) and (6.14) when ES is connected last (day 2) ... 95 Table 6.9 - Income received by each generator and energy storage system with coordination and in “last-in, first-off” operation during the year of operation considered ... 95 Table A1 – Parameters of the generators ... 112 Table A2 – Parameters for the cost/benefit analysis of the rating of GenC ... 113 Table A3 – Production of GenC and respective income generated during the year of operation ... 113 Table A4 – Parameters for the cost/benefit analysis of the rating of GenD ... 114 Table A5 – Production of GenD and respective income generated during the year of operation ... 115 Table B1 – Operating limits of the generators in the AC OPF ... 117 Table C1 – Values of price of electrical energy, wind power and load consumption on day 1 ... 121 Table C2 – Values of price of electrical energy, wind power and load consumption on day 2 ... 122 Table C3 – Values of price of electrical energy, wind power and load consumption on day 3 ... 122 Table C4 – Values of price of electrical energy, wind power and load consumption on day 4 ... 123 Table C5 – Values of price of electrical energy, wind power and load consumption on day 5 ... 123 Table C6 – Values of price of electrical energy, wind power and load consumption on day 6 ... 124 Table D1 - Output powers of the generators without coordination on day 1 ... 126 Table D2 - Output powers of the generators with coordination on day 1 ... 127 Table D3 - Output powers of the generators without coordination on day 2 ... 128 Table D4 - Output powers of the generators with coordination on day 2 ... 129 Table D5 - Output powers of the generators without coordination on day 3 ... 130 Table D6 - Output powers of the generators without coordination on day 4 ... 131 Table D7 - Output powers of the generators with coordination on day 4 ... 132 Table D8 - Output powers of the generators without coordination on day 5 ... 133 Table D9 - Output powers of the generators with coordination on day 5 ... 134 Table D10 - Output powers of the generators without coordination on day 6 ... 135 Table E1 - Output powers of the generators and the controllable load without coordination on day 1 (±10% load flexibility) ... 139
xxiii
Table E2 - Output powers of the generators and the controllable load (coordination of distributed generators, no coordination with the controllable load) on day 1 (±10% load flexibility) ... 140 Table E3 - Output powers of the generators and the controllable load with coordination on day 1 (±10% load flexibility)... 141 Table E4 - Output powers of the generators and the controllable load without coordination on day 2 (±10% load flexibility) ... 142 Table E5 - Output powers of the generators and the controllable load (coordination of distributed generators, no coordination with the controllable load) on day 2 (±10% load flexibility) ... 143 Table E6 - Output powers of the generators and the controllable load without coordination on day 3 (±10% load flexibility) ... 144 Table E7 - Output powers of the generators and the controllable load without coordination on day 4 (±10% load flexibility) ... 145 Table E8 - Output powers of the generators and the controllable load (coordination of distributed generators, no coordination with the controllable load) on day 4 (±10% load flexibility) ... 146 Table E9 - Output powers of the generators and the controllable load with coordination on day 4 (±10% load flexibility)... 147 Table E10 - Output powers of the generators and the controllable load without coordination on day 5 (±10% load flexibility) ... 148 Table E11 - Output powers of the generators and the controllable load (coordination of distributed generators, no coordination with the controllable load) on day 5 (±10% load flexibility) ... 149 Table E12 - Output powers of the generators and the controllable load without coordination on day 6 (±10% load flexibility) ... 150 Table E13 - Output powers of the generators and the controllable load without coordination on day 1 (±100% load flexibility)... 151 Table E14 - Output powers of the generators and the controllable load (coordination of distributed generators, no coordination with the controllable load) on day 1 (±100% load flexibility) ... 152 Table E15 - Output powers of the generators and the controllable load with coordination on day 1 (±10% load flexibility)... 153 Table E16 - Output powers of the generators and the controllable load without coordination on day 2 (±100% load flexibility)... 154 Table E17 - Output powers of the generators and the controllable load (coordination of distributed generators, no coordination with the controllable load) on day 2 (±100% load flexibility) ... 155 Table E18 - Output powers of the generators and the controllable load with coordination on day 2 (±100% load flexibility)... 156 Table E19 - Output powers of the generators and the controllable load without coordination on day 3 (±100% load flexibility)... 157 Table E20 - Output powers of the generators and the controllable load without coordination on day 4 (±100% load flexibility)... 158 Table E21 - Output powers of the generators and the controllable load (coordination of distributed generators, no coordination with the controllable load) on day 1 (±100% load flexibility) ... 159 Table E22 - Output powers of the generators and the controllable load with coordination on day 1 (±10% load flexibility)... 160 Table E23 - Output powers of the generators and the controllable load without coordination on day 5 (±100% load flexibility)... 161
xxiv
Table E24 - Output powers of the generators and the controllable load (coordination of distributed generators, no coordination with the controllable load) on day 5 (±100% load flexibility) ... 162 Table E25 - Output powers of the generators and the controllable load with coordination on day 5 (±100% load flexibility) ... 163 Table E26 - Output powers of the generators and the controllable load without coordination on day 6 (±100% load flexibility) ... 164
xxv
List of Abbreviations and Acronyms
AC – Alternate current
AHP - Analytic hierarchy process CHP – Combined heat and power
CIGRE - Conseil International des Grands Réseaux Électriques (in French),
International Council on Large Electric Systems
CO2 – Carbon dioxide
DG – Distributed generation
DNO – Distribution network operator DSI – Demand-side integration
EU – European Union
FACTS – Flexible AC transmission system
FENIX – Flexible Electricity Network to Integrate the eXpected ‘energy
evolution’
HV – High voltage
LMP – Locational marginal pricing MV – Medium voltage
OPF – Optimal power flow
PFSF – Power flow sensitivity factors p.u. – per unit
OFGEM – Office of Gas and Electricity Markets TNO – Transmission Network Operator
TU-game – Cooperative game with transferable utility UK – United Kingdom
USA – United States of America VAT – Value added tax
1
Chapter 1 - Introduction
1.1 - Scope of the research
The research carried out focuses on the way generators connect to distribution networks. Generation in distribution networks is designated in this research as “distributed generation”, following the definition given in section 1.4.1. However, this research is expected to be applicable to other network voltage levels.
Large amounts of “fit-and-forget” connection of generation are expected in distribution networks. In this policy, one generator’s effect is assumed to be limited and network voltages and currents are expected to remain acceptable at all times. This firm access connection policy limits the amount of generation capacity that can be connected. Increased difficulty to get permission to install new power system equipment (e.g, overhead lines) and the costs required are barriers to network capacity expansion [1-3]. Network capacity expansion is not considered in this research.
Permission to connect generation without firm access rights is generally obtained on the basis that when there is inadequate capacity in the system, the non-firm generators are constrained off on a “last-in, first-off” basis (i.e., the last to connect is the first to be affected). Different costs of operation and ability to be dispatched are not considered. Thus, the economic value of the generators is not maximised.
1.2 - Research questions
This research aims to address the following questions:
Can independent distributed generators be operated in a coordinated manner so that all increase their income for selling electricity?
Can the flexibility of the demand side be used to maximise the income of the generators?
1.3 - Objectives of the research
The following objectives are set to answer the research questions mentioned in section 1.2:
Definition of a methodology to coordinate independent distributed generators:
o The objective is to maximise the income of the generators for selling electricity;
Integration of controllable load and energy storage systems in the coordination to allow the generators to maximise their production;
o The flexibility of the demand side is aimed to allow the generators to maximise their income;
Establishment of an income-sharing mechanism to share the income obtained in coordination, so both generators and demand have an economic incentive to participate.
2
The definition of distributed generation and the drivers for its increased connection are presented in section 1.4. The definition of demand-side integration and the drivers for its implementation are shown in section 1.5.
1.4 - Distributed generation
1.4.1 - Definition
The definition adopted in this research for distributed generation is the one described in [2] for “embedded or dispersed generation”. Distributed generation is defined as:
Being non-centrally planned (i.e., not planned by the network operator);
Being non-centrally dispatched;
Having less than 100 MW of installed capacity; Being connected to the distribution system.
1.4.2 - Drivers for the increase of the connection of distributed generation
Connection of increased amounts of distributed generation is a result of technical/commercial, strategic/regulatory and environmental drivers [2, 3]:
Technical/commercial drivers
Smaller periods of construction, lower capital expenditure and shorter amortisation periods, when compared to centralised generators;
Possibility of modular projects;
o New generators can be added to the project along time, e.g. according to the availability of capital;
Low energy density in the case of renewable energy sources;
o Renewable generators need to be smaller and geographically dispersed.
Facility in finding sites for smaller generators;
Connection closer to demand to reduce network and operation costs; o For instance, combined heat and power schemes require close location to heat load due to the cost of transporting heat. This leads to the construction of small generation units, geographically dispersed and connected to distribution networks.
Strategic/regulatory drivers
Deregulation of electric power systems;
o Modifications in the commercial structure of electric power systems; o Open access to distribution networks;
National/international targets;
The interest of some countries to diversify energy sources (energy security concerns).
Environmental drivers
Effort to reduce the emission of greenhouse effect gases (mainly CO2);
o Many governments have programmes to support the utilisation of low-carbon energy resources for the production of electricity [4];
3
Public opposition to the construction of centralised generators and over-head transmission circuits.
1.4.3 - Commercial incentives for the connection of distributed generation
Connection Feed-in Tariffs (FITs) and quota obligations (QO) are widely adopted forms of incentives to the connection of distributed generation (renewable and low carbon). FITs are price-based mechanisms while QO are volume-based mechanisms. FITs are in place in countries as Portugal and Germany. Some examples of QO schemes are the Renewable Obligation in the UK and the Renewable Portfolio Standard in the USA. Currently both approaches tend to be technology-specific, based on “bands”. Banding has been introduced to distinguish levels of support that renewable and low carbon generators receive based on their type of technology. This has been implemented to reflect differences across technologies such as those related to planning, implementation costs and level of maturity of technology [3].
Several applications of smart grid technologies in literature introduce dynamic price or price-related control signals in distribution systems [4]. A spot pricing algorithm in radial distribution systems that takes into account power flows and circuit constraints is proposed in [5]. Nodal pricing in distribution networks with DG based on the resolution of the economic dispatch problem is formulated in [6]. Locational Marginal Pricing (LMP) with system state prediction and load uncertainty simulation is presented in [7]. Cooperative game theory is used to determine the share of each DG in the reduction of the loss element of the LMP.
1.5 – Demand-side integration
1.5.1 - Definition
The term demand-side integration (DSI) was adopted at the CIGRE Paris Session 2006 to represent the technical area focused on the demand side and its potential as a source of supply [5]. DSI covers all activities focused on advanced end-use efficiency and effective electricity utilisation, in particular:
Demand Response – mechanisms to manage the demand in response to supply conditions:
o Peak clipping – reduction of peak demand especially when it approaches the thermal limits of feeders/transformers or the supply limits of the network;
o Valley filling – introduction of load in off-peak periods in the form of energy storage;
o Load shifting – movement of loads during the day to minimise the electricity bill;
o Dynamic energy management – integrated approach that addresses permanent energy savings, permanent demand reductions and temporary peak load reductions;
4
Energy efficiency – programmes to reduce the overall consumption of energy while maintaining user comfort or level of service;
Strategic load growth – programmes to increase load in a strategic manner, e.g. to increase supply from low-carbon energy sources.
1.5.2 - Drivers for the increase in demand-side integration
The implementation of DSI is encouraged by technical/commercial, industrial, social and environmental drivers [1, 5]:
Technical/commercial drivers
System reliability concerns due to increase in demand and increased difficulty to get permission for the installation of new power system equipment;
Possibility of energy and cost savings for network operators through customer participation;
Integration of non-dispatchable generation using the flexibility of the demand side.
Industrial drivers
Increased availability of demand-side resources such as flexible loads, distributed generation and energy storage devices (including electric vehicles);
Introduction of smart metering, that allows: i) the provision of signals to incentivise customer participation; ii) the implementation of advanced control actions. Considering two-way communication is available, smart meters allow the measurement, collection, analysis and management of customer energy use. This ultimately leads to increased load flexibility which can be used to meet the power system needs [1].
Social drivers
Public opposition against capacity expansion to accommodate increased levels of demand;
Public awareness to the possibility of meeting demand by combining grid-purchased electricity with onsite energy production. This allows customers to trade electricity produced onsite and increases flexibility of demand.
Environmental drivers
Effort to decarbonise electric power and transport systems, which leads to:
o the need for conservation and energy efficiency measures;
o the integration of new electrical loads such as electric vehicles and heat pumps. This leads to an increase in demand.
5
1.6 - Thesis structure
The structure of this thesis is given in the following summary: Chapter 2
Literature review on the integration of distributed generation is presented. The challenges of the “fit-and-forget” connection of distributed generation are identified. Contributions for the mitigation of its effects are reviewed. Research on the coordination of independent distributed generators is reported. Game theory is introduced to address the allocation of the additional income obtained by independent generators in coordination. An overview of demand-side integration is provided regarding: i) the mechanisms for its implementation; ii) its benefits to the integration of generation; iii) its benefits to the consumers.
Chapter 3
The limitations of the firm access connection policy are investigated. A representative of the distribution system of Northeast Portugal is used as an illustrative example. Distributed generation with different costs of operation and ability to be dispatched is considered. The technical possibility of connecting generation capacity above the limits defined by the firm access connection policy is introduced. The economic inefficiency of the operation of the distribution network is identified.
Chapter 4
The coordination of independent distributed generators is outlined. The aim is to maximise the income of generators for selling electricity. An income-sharing mechanism based on cooperative game theory is introduced to share the additional income obtained in coordination. The coordination of independent distributed generators is evaluated on a reduced version of the distribution network introduced in Chapter 3. The coordination is evaluated during a selected period of six days. This period consists of different cases of price of electrical energy, wind power and load consumption. Comparison against the non-coordinated operation of generators is provided. The effect of different costs of operation of the generators in the value of the coordination is evaluated. The willingness of the generators to participate in the coordination considering different allocations of the additional income is analysed.
Chapter 5
The coordination of distributed generators and controllable load is presented. The operation of the Aggregator considering the flexibility of controllable load is described. The aim of the coordination of generators and controllable load is to maximise the income of generators for selling electricity. An income-sharing mechanism to allocate the additional income to the generators and the controllable load is detailed. The coordination of generators and controllable load is evaluated on the reduced version of the distribution network. The same period of six days is used. Different load capacities and fractions of flexible consumption are analysed. Comparison
6
against the non-coordinated operation of generators and controllable load is provided. Economic incentives to generators and controllable load for operating in a coordinated manner are quantified.
Chapter 6
The coordination of independent non-dispatchable generators and energy storage systems is presented. Energy storage systems are asked to change their schedule to allow generators to maximise their production. The operation of the Aggregator considering the connection of energy storage systems is described. Additional income is obtained from the coordination for the additional energy produced. This additional income is allocated to the generators and the energy storage systems using a bargaining approach of game theory. The coordination is evaluated on a two-busbar distribution network with two generators and an energy storage system connected. The evaluation is performed using a set of extreme cases of price of electrical energy and wind power. The impact on the additional income of different orders of connection to the network is analysed. Comparison against the non-coordinated operation of generators and energy storage systems is provided. Economic incentives to generators and energy storage system for operating in a coordinated manner are quantified. Then, the evaluation is extended to a year of operation to assess the impact on the additional income of different installed capacities of the energy storage system.
Chapter 7
The contribution of this research is presented. Conclusions are drawn, addressing: i) the limitations of the firm access connection policy; ii) the coordination of independent distributed generators; iii) the coordination of generators and controllable load; iv) the coordination of non-dispatchable generators and energy storage systems. Suggestions for extending the work carried out in this research are provided.
Appendices
In Appendix A are presented the cost-benefit analyses behind the determination of the ratings of generators connected without firm access rights. In Appendix B are provided details of the AC optimal power flow (OPF) carried out in the representative of the Portuguese MV distribution network introduced in Chapter 3. Details of the six days of operation used to validate the coordination of independent distributed generators and the coordination of distributed generators and controllable load are given in Appendix C. Results of the implementation of the coordination of independent distributed generators to each of the six days of operation are provided in Appendix D. Results of the implementation of the coordination of distributed generators and controllable load to each of the six days of operation are provided in Appendix E.
7
1.7 - Publications during the research
Directly related with the researchJ. A. Barros, H. Leite, "Coordinating Independent Non-Dispatchable Generation and Energy
Storage Systems," International Journal of Electrical Power & Energy Systems, accepted for future publication in April 2014.
J. A. Barros, H. Leite and N. Jenkins, “Coordinating Independent Distributed Generators”, in 3rd IEEE PES Innovative Smart Grid Technologies Conference, 2012 ISGT Europe, Berlin, 14 –
17 October 2012.
J. Barros and H. Leite, “Feed-In Tariffs for Wind Energy in Portugal: Current Status and
Prospective Future”, in 11th International Conference on Electrical Power Quality and
Utilization, IEEE EPQU 2011, Lisbon, 17 – 19 October 2011.
Collateral work
J. Carvalhosa, J. Barros, H. Leite, A. Barbosa, P. Pereira and P. Alves, “Technical and Economic Impacts of the 2010's Grid Code Requirements for Wind Energy in Portugal”, in 11th
International Conference on Electrical Power Quality and Utilization, IEEE EPQU 2011,
Lisbon, 17 – 19 October 2011.
H. Leite, J. Barros, V. Miranda and R. Fiteiro, “Application of a Methodology based on the Evolutionary Particle Swarm Optimization to Protection Coordination”, in 21st International
Conference and Exhibition on Electricity Distribution, CIRED 2011, Frankfurt, 6 – 9 June 2011.
H. Leite, J. Barros, and V. Miranda, "The Evolutionary Algorithm EPSO to Coordinate
Directional Overcurrent Relays," in 10th International Conference on Developments in Power
System Protection, IET DPSP 2010, Manchester, 29 March – 1 April 2010.
H. Leite, J. Barros, and V. Miranda, "Evolutionary Algorithm EPSO Helping Doubly Fed Induction Generator with Ride-Through-Fault," in International Conference on Power
8
Chapter 2 - Background and literature
review
2.1 - Introduction
An overview of the challenges to the connection of distributed generation is given in this chapter. Contributions to facilitate the integration of increased amounts of distributed generation are reviewed. Particular attention is paid to the coordination of independent distributed generation. Game theory is presented as a tool to encourage independent generators to be coordinated. The potential of demand-side integration to allow the integration of additional amounts of distributed generation is analysed.
2.2 - Integration of Distributed Generation
Distribution networks were traditionally designed to accept bulk power from the transmission network and to distribute it to consumers. Power flows were considered to be unidirectional, from the higher to the lower voltage levels. However, with increasing penetration of distributed generation (DG) power flows may become reversed. DG is operated on a must-run basis due to environmental, commercial and political drivers [2-4]. Increasing levels of “fit-and-forget” connection of DG are expected in distribution networks. The challenges introduced by the “fit-and-forget” connection of generation are identified in section 2.2.1. Contributions to integrate DG are covered in sections 2.2.2 and 2.3.
2.2.1 - Challenges to the connection of additional amounts of distributed generation
Concerns with the “fit-and-forget” connection of DG include [6, 7]: voltage regulation;
thermal limits of lines and transformers; effect on network losses;
behaviour of DG in the case of network perturbations (“survival” to voltage dips);
higher need of balancing and reserve services; increased harmonic distortion;
network protection issues:
o modifications in network short-circuit levels; o modifications in fault current profiles;
o impact on fault location and clearing practices;
Many DG schemes are connected in rural zones (with low demand). There are voltage constraints that limit the amount of DG capacity that can be connected [8]. Traditional line drop compensation techniques lose their effectiveness with the connection of DG.
9
The value of losses in each node depends of the penetration level of DG. Typically, losses decrease with low DG penetration levels. However, after a certain penetration level they start to increase [9].
Many DG schemes are based on intermittent energy sources (e.g., wind and photovoltaic). The massive connection of these DG schemes introduces an increased demand for balancing and reserve provision services from the transmission networks [10]. A methodology to identify the appropriate level of reserves and their cost in a power system with high penetration of wind power is presented in [11]. Performance metrics are used to clarify conflicting economic effects of wind power penetration: fuel cost reduction and reserve cost increase. It is reported that reserve costs vary significantly due to wind power uncertainty.
Thus, the “fit-and-forget” connection of further DG will be technically limited in the near future. The installed capacity of new DG schemes will be limited by this firm access connection policy. The amount of energy exported will be constrained. On the point of view of network operators, quality of supply may be affected. An increase in network operation costs is expected. Therefore, the value of DG may be reduced if no changes are made to the planning and operation of distribution networks.
Network reinforcement programmes are underway in many countries to allow the massive connection of DG [12]. However, in other countries regulation and economic reasons are likely to prevent network reinforcement to be effective in the timely connection of greater amounts of generation. For instance, in Great Britain energy regulator OFGEM only allows for generator-driven investment when there is contracted generation requiring connection [13]. Thus, Distribution and Transmission Network Operators (DNOs and TNOs, respectively) in Great Britain cannot invest ahead of need under the current regulatory framework. In addition, there is currently a “£200/kW installed” cost cap on socialised investment in any upgrade to the distribution network. This means that large upgrades to DNO’s assets to connect generation, which might benefit the DNO and the customers in the long term, should be financed in great part by the generator [13]. This is likely to impact the economic return of prospective generation projects at distribution level and deter the connection of new generation.
On the other hand, contributions are being presented to integrate DG without considering such reinforcements. These contributions aim to mitigate the issues related with the “fit-and-forget” connection of DG and allow the integration of additional generation capacity [14-16].
2.2.2 - Contributions to the integration of distributed generation
An overview of the contributions to allow the integration of additional generation capacity is provided as follows.
Voltage coordination by voltage changing devices and DG
When a DG scheme is connected, its active power export reduces the power flow from the primary substation and so it reduces the voltage
10
drop along the feeder. If the power export from the DG is larger than the feeder load, the power flows from the DG to the primary substation and this causes a voltage rise between the primary substation and the generator [2];
Several publications address the coordination between on-load tap changers, capacitor and inductor banks, FACTS (flexible AC transmission systems) and DG (active and reactive power flow) towards the regulation of network voltage profiles [17-19];
By controlling distribution network voltage profiles it is possible to integrate increased capacity of DG.
Provision of ancillary services by DG
Depending on their generation technology, DG schemes may supply several ancillary services to Distribution Network Operators (DNOs). The provision of ancillary services to DNOs by DG can lead to a more economically efficient power system [20];
These DNO ancillary services include power balance, local voltage and reactive power support, mitigation of losses, congestion management and black start (power system restoration after a fault) [21, 22];
More flexible operation of DG according to network price signals can save investment or delay network reinforcement [23];
Operation schemes for DG to mitigate fast voltage fluctuations, voltage dips and harmonic distortion are addressed in [24].
A global restoration procedure for a power system with the participation of DG is presented in [22]. The procedure allows DG schemes with black start capability to accelerate network re-energising, restoring clients faster than in the conventional procedure. The results obtained show an increased performance of the restoration procedure with the contribution of DG compared with the base case (where no DG is directly involved). No commercial mechanisms to reward this participation are presented;
Different levels of participation of DG in the provision of ancillary services can be found in Europe. In most European countries, there is little contribution of DG to network ancillary services [23]. Current contributions of DG are: to keep their power factors within certain ranges, and; through aggregators, to participate in the balancing market or provide reserves.
New Regulatory frameworks / Grid Codes
The establishment of commercial arrangements between DNOs and DG to recognize the contribution of DG to network efficiency are being sought in some countries [23]:
o Regulated payments to the owners of DG schemes (e.g. reflected in use-of-system tariff charges).
11
o Participation of DG in the markets: (i) energy balancing and reserve markets; and (ii) network related markets, such as local balancing, reactive power, congestion management and energy losses compensation;
The importance of shifting the current EU prohibition (European Directive 2003/54/EC) of DG ownership by DNOs is addressed in [25, 26];
This rule was designed to avoid that a DNO favours with a generation business within the same group. This may lead to a lack of integration between network and generation planning. The importance of allowing DNOs to deploy DG in well-defined circumstances is highlighted in [25]. These circumstances include: if deploying DG at specific network locations is more economically favourable than investing in network infrastructure; when overall network efficiency can be improved (e.g., by reducing losses) without altering market competitiveness. Other approach to consider the ownership of DG by DNOs is to adapt a USA regulatory approach that introduces an obligation for DNOs to acquire DG. This is put to DNOs as an alternative to network reinforcement [25].
The creation of carbon taxes is proposed as a form of promoting the integration of renewable DG [27]. A carbon tax addresses the carbon content of fuels used for energy production. Carbon taxes might increase the competitiveness of renewable DG when compared to conventional generation. However, this consideration depends on the price and market context of each country [27].
Modifications in the structure of electricity markets
The creation of wholesale electricity markets introduced a competitive framework for the appearance of new players in the electricity sector (as new generators and retailers). These markets appeared as a result of a deregulation process that aimed to [28]:
- provide better incentives for controlling capital and operating costs of new and existing generating capacity;
- encourage innovation in power supply technologies, and;
- shift the risks of technology choice, construction cost and operating inefficiencies from consumers to suppliers.
Existing electricity markets have been operated in various arrangements, such as electricity pools or bilateral contracts. Electricity pools enable competition in generation as they allow a merit order on the dispatch of generation. They also facilitate the mechanisms to support competition in supply where customers can freely choose their supplier. On bilateral trading, customers have the opportunity to negotiate the best energy price from suppliers and generators without being constrained by any official price [28];
Alterations in the electricity market design to enable the integration of further amounts of wind power are presented in [29, 30]:
12
May reduce costs with reserves, forecasting and increase revenues for wind power producers as they are able to make more accurate bids;
o Implementation of broader-area markets; Cooperation between control areas to:
reduce the effect of wind intermittency;
stabilise prices within control areas, regulating power flows.
o Widespread application of implicit auctioning to allocate cross-border power capacity [29];
To promote the efficient use of interconnectors of neighbouring countries:
by means of mechanisms such as market coupling and market splitting;
A market interface for the participation of DG in wholesale electricity markets is presented in [31]. DG is interfaced as an “Equivalent Power Producer” on a pool-based market. Changes to spot price computation and capacity payments are described. A mechanism to mitigate the volatility of spot prices due to the integration of DG is introduced. The market interface is evaluated on the Chilean electricity market.
Islanded operation of distribution networks
Considering network islanding operation is allowed, DG may find attractive economic opportunities [32, 33]:
o Important loads (e.g., large consumers) may be maintained in service by DG;
o Financial penalties for DNOs due to consumer interruptions and network unavailability may be reduced;
o DG may be able to continue to sell energy during islanding; Maintaining in service important loads is addressed in a number of
publications:
o A load shedding optimisation problem is formulated in [34]. The objective is to minimise the cost of load shedding after a disturbance. The optimisation problem is non-linear. Load priorities are pre-set offline and do not vary with changes in network operating conditions;
o A load shedding scheme based on a dynamic priority list is presented in [32]. The dynamic priority list is determined using the real-time decision making technique AHP (Analytic Hierarchy Process).
Non-firm access to the networks
Network operators may allow the connection of generation without firm access rights – non-firm access to the networks [35-37];
Non-firm access to the networks is aimed to allow generation to be connected in advance of necessary reinforcement works to remove a network constraint (such as circuit capacity limits, static or dynamic as
13
presented in [38]). However, on occasions the output of the generators with non-firm access may need to be curtailed;
Non-firm access to the networks implies the usage of one or more of the following strategies when there is inadequate capacity in the system [39, 40]:
o Power curtailment;
o Coordinated Voltage Control;
o Adaptive power factors for DG power plants; o Local reactive power compensation;
Power curtailment is generally associated with the partial or full reduction of the generator output in case of network constraints. Contributions presenting power curtailment as a way to integrate
further amounts of generation have been presented [36, 40-42];
Curtailment of active power to increase reactive power injection in distribution networks in proposed in [41, 42]. Results show that reactive power compensation increases the amount of generation that can be connected, especially in networks with a high reactance to resistance ratio. Active power curtailment reduces the income of the generators;
An online AC Optimal Power Flow algorithm to manage the power flows of DG when network voltage or current limits are exceeded is presented in [40]. “Last-in, first-off” power curtailment is included in the formulation.
Financial and technical impacts of the connection of further amounts of DG considering different connection policies are demonstrated in [36]. Three connection policies are considered: firm connection policy, non-firm connection policy and the “first firm then non-firm” connection policy. Five sections of the 38 kV distribution network of Ireland are used to evaluate the potential benefits of each connection policy. An optimisation procedure is presented with the objective of maximising the energy delivered per unit of investment. Capital, operation, maintenance, connection, reserve and cycling costs are considered. Significant differences in DG scheduling are reported along a year depending on the connection policy. Differences are observed also in cycling costs, emission benefits and fuel usage. The non-firm connection policy presents a greater net benefit for the case study and optimisation methodology described.
The commercial rules for allocating curtailed capacity supported by active management solutions have been designated as “Principles of Access” (POAs), following a paper from Currie et al. [43]. Such active management solutions adjust the amount and frequency of curtailment in order to provide system reliability, minimise social costs and attract DG investment. These Principles of Access are expected to promote [44, 45]:
o Cost effectiveness - for both generators and distribution network operators;