Artigo
DOI: 10.14295/2238-6416.v72i4.662SIMULATION OF WATER EVAPORATION ON
ULTIMONITORED THERMOMIX
®: POTENTIAL
APPROACH FOR STUDIES ON MILK EVAPORATION
Simulação da evaporação da água em Termomix
®multi-monitorado:
abordagem potencial de estudos sobre evaporação de leite
Rodrigo Stephani1, Júlia d’Almeida Francisquini2, Igor Lima de Paula1,
Antônio Fernandes de Carvalho2, Luiz Fernando Cappa de Oliveira1, Ítalo Tuler Perrone3*
ABSTRACT
It was simulated the industrial evaporation process using a multi-monitored
Thermomix®. To validate the hypothesis that this equipment could act as a
labora-tory-scale evaporator, we evaporated water from milk to produce dulce de leche. Using this equipment, we were able to precisely determine mass changes throughout the process, observe the effect of the exhaust system on the evaporation, obtain
dulce de leche with market composition, and determine the effect of sugar addition
on water evaporation. The error between the observed boiling point temperature and that predicted by theory was ~ 2%; as a consequence, the equipment could be used
to establish Dühring curves. It was found that the Thermomix® multi-monitored
configuration was a simple and inexpensive equipment for simulate evaporation in industrial dulce de leche production.
Keywords: laboratory scale; concentration; dulce de leche; boiling point. RESUMO
Foi simulado o processo de evaporação industrial usando um Thermomix®
multi-monitorado. Para validar a hipótese de que este equipamento poderia funcio-nar como um evaporador em escala laboratorial, evaporou-se água do leite para
1 Federal University of Juiz de Fora (UFJF), Department of Chemistry, Juiz de Fora, MG, Brazil. 2 Federal University of Viçosa (UFV), Department of Food Technology, Viçosa, MG, Brazil. 3 Federal University of Juiz de Fora (UFJF), Department of Pharmaceutical Sciences, Juiz de Fora,
MG, Brazil. E-mail: italotulerperrone@gmail.com * Autor para correspondência.
Recebido / Received: 12/04/2018 Aprovado / Approved: 27/04/2018
produzir doce de leite. Usando este equipamento, pôde-se determinar com precisão as mudanças de massa ao longo do processo, observar o efeito do sistema de escape na evaporação, obter o doce de leite com a composição do mercado e determinar o efeito da adição de açúcar na evaporação da água. O erro entre a temperatura do ponto de ebulição observado e o previsto pela teoria foi de ~ 2 %; Como consequência, o equipamento poderia ser usado para estabelecer curvas de Dühring. Descobriu-se
que a configuração multi-monitorada Thermomix® foi um meio simples e barato de
simular a evaporação na produção industrial de doce de leite.
Palavras-chave: escala laboratorial; concentração; doce de leite; ponto de
ebulição.
INTRODUCTION
Evaporation of dairy liquids is an im-portant step in the dairy industry. Sweetened condensed milk, dulce de leche, evaporated milk, and dairy powder products are the main dairy products obtained by evapora tion (SILVEIRA et al., 2013; SILVA et al., 2015; SILVEIRA et al., 2015; SCHUCK et al., 2016).
The energy expenditure is a problem involving this technique due to the removal of water by its phase change. For example, to concentrate atmospheric pressure 1 kg of 10 % sucrose solution to 20 % sucrose re-quires a total of 1439 kJ eliminating a total of 0.5 kg of water. Therefore, industries ex-plore ways to reduce energy consumption and consequently lower costs.
It is admitted that this operation of concentration induces strong modifications of the physicochemical conditions not only impacting negatively the concentrates but also the process (TANGUY et al., 2016). Upon milk evaporation, lactose crystallization, Maillard reaction and an increase in viscosity are consequences of the heating and the con-centration of the solids (SILVA et al., 2015; SOUZA et al., 2015; STEPHANI et al., 2015).
Many studies have concerned flow pro perties of concentrates, and heat transfer and industrial performance during evapo ra-tion of food, but relatively few studies address evaporation of dairy products at labor atory
scale (KIM et al., 1983; DODEJA et al., 1990; TEJINDER, 2000; RIBEIRO; ANDRADE, 2003; SILVEIRA et al., 2013; SOROUR et al., 2013; SILVEIRA et al., 2015).
In view of the above, Thermomix, which corresponds to a process simulator, appears as a tool to study the manufacture of dairy products such as dulce de leche. This equipment has the advantage of less time of manufacture, besides its ease of handling, with use of smaller amount of ingredients, re sulting in less waste. Although it has as a disadvantage the high value and need for thorough washing.
Thermomix is equipment that can be used on a laboratory scale for the purpose of developing new products. By enabling the screening of certain technologies, reducing energy and material costs thus optimizing costs.
The aim of this study was to apply and validate the Thermomix as a laboratory scale evaporator, by optimizing water evapora tion and dulce de leche production.
MATERIAL AND METHODS
To emulate the industrial evapora tion
pro cess, we used the Thermomix® TM5
(Vorwerk, Wuppertal, Germany) coupled to a load cell (Ramuza IDR 7.500, San tana de Parnaíba, Brazil) with a precision of 1 g, a PT-100 temperature sensor, and an exhaus-ter (Blower NáuticoSeaflo 3”, XIAMEN
HUILIYUAN, Xiamen, China). The process simulator can be visualized in Figure 1.
Figure 1 – Process simulator (Thermomix®
TM5)
The Sitrad software version 4.13 (Full Gauge Controls, Canoas, Brazil) was used to collect and record data from the load cell and thermometer at 1-s intervals. The supple men-tary files include a photo of the equipment. To maximize the rate of water eva poration, we analyzed evaporation in light of heating
power and the presence or absence of the exhauster. The experimental parameters are described in Table 1.
Table 1 – Design of the experiment for water
evaporation (n = 3)
Exhaustion Heating control
Treatment of Thermomix (m3.h-1) (ºC) W100 0 100 W105 0 105 W110 0 110 W115 0 115 W120 0 120 Wvaroma 0 Varoma W’100 220 100 W’105 220 105 W’110 220 110 W’115 220 115 W’120 220 120 W’varoma 220 Varoma Note: In all treatments, 900 g of distilled water were
evaporated, and the stirrer worked at 100 rotations per minute. Varoma = preset configuration of the Thermomix for maximum heating rate, n = number of repetitions.
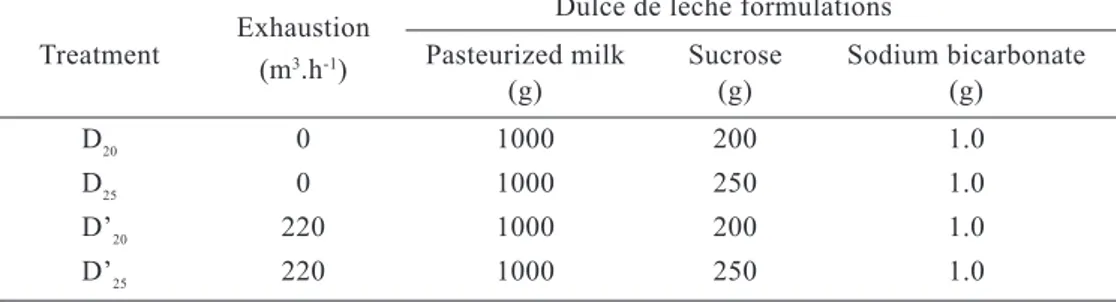
Table 2 – Experimental conditions for the dulce de leche productions (n = 3)
Exhaustion Dulce de leche formulations
Treatment Pasteurized milk Sucrose Sodium bicarbonate
(m3.h-1) (g) (g) (g)
D20 0 1000 200 1.0
D25 0 1000 250 1.0
D’20 220 1000 200 1.0
D’25 220 1000 250 1.0
Where: D20 = formulation with 20% w.w-1 of sucrose addition, D25 = formulation with 25% w.w-1 of sucrose addition, n = number of repetitions.
Aiming to evaluate the Thermomix as an emulator of evaporation in the food in dus-try, we produced dulce de leche using two different formulations. Similarly, to maximi ze the water evaporation rate, the parameters of heating power and the presence or absence of the exhauster were optimized during dul
ce de leche production. The experimental
conditions for the dulce de leche produc tions are presented in Table 2. Three repeti tions were done for each treatment.
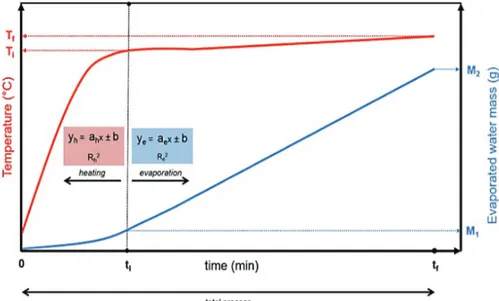
Data were collected according to Fi-gure 2.
The evaluated parameters were: initial
boiling temperature, Ti (ºC); final boiling
temperature, Tf (ºC); initial time of the
evaporation, ti (min); final time of the
evaporation, tf (min); mass of evaporated
water, M1 (g); mass of total evaporated
water, M2 (min); heating rate, ah (ºC . min-1);
constant evaporation rate, ae (g . min-1); total
evaporation rate, Er (g . min-1); and air flow
rate in the exhauster, V (m3 . h-1). The total
evaporation rate (Er) can be calculated as
2 r f M E t = (Eq. 1)
where Er = total evaporation rate (g . min-1),
M2 = mass of total evaporated water (g), and
tf = final time of the evaporation.
It is possible to divide Figure 2 in two zones. The first zone relates to the hea ting of the product or water until the boi ling tempe-ra ture (heating zone). The second part relates to the water evaporation (evaporation zone),
begins at ti (initial time of the evaporation) and
Ti (initial boiling temperature), and ends
at tf (final time of the evaporation) and Tf
(fi nal boiling temperature). The amount of evaporated water is represented by the
diffe-rence between M2 (mass of total evapo rated
water) and M1 (mass of evaporated water).
Dulce de leche composition analysis
Moisture, water activity, fat content, and percentage of soluble solids were measured
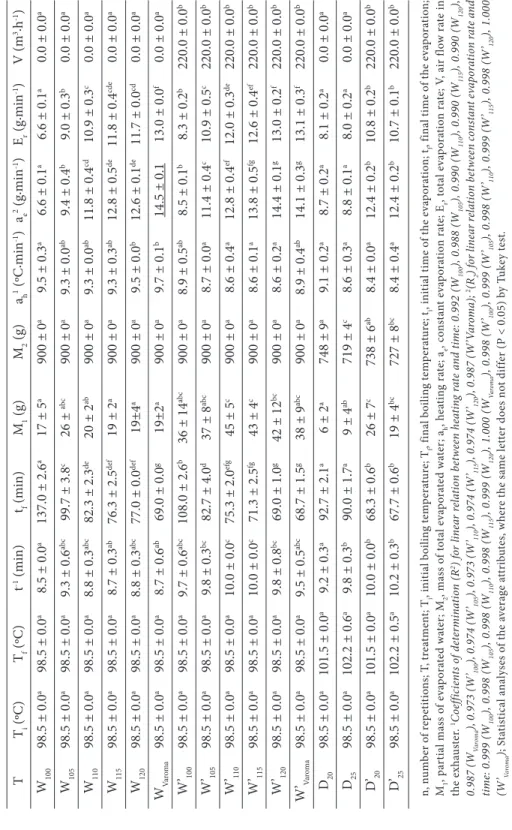
Ta bl e 3 – R es ul ts f or wa ter e va po ra tio n a nd du lce de le ch e p ro duc tio n exp er im en ts (n = 3) T Ti (ºC) Tf (ºC) t -1 (min) tf (min) M1 (g) M2 (g) ah 1 (ºC .min -1) ae 2 (g .min -1) Er (g .min -1) V (m 3.h -1) W100 98.5 ± 0.0 a 98.5 ± 0.0 a 8.5 ± 0.0 a 137.0 ± 2.6 a 17 ± 5 a 900 ± 0 a 9.5 ± 0.3 a 6.6 ± 0.1 a 6.6 ± 0.1 a 0.0 ± 0.0 a W105 98.5 ± 0.0 a 98.5 ± 0.0 a 9.3 ± 0.6 ab c 99.7 ± 3.8 c 26 ± ab c 900 ± 0 a 9.3 ± 0.0 ab 9.4 ± 0.4 b 9.0 ± 0.3 b 0.0 ± 0.0 a W110 98.5 ± 0.0 a 98.5 ± 0.0 a 8.8 ± 0.3 ab c 82.3 ± 2.3 de 20 ± 2 ab 900 ± 0 a 9.3 ± 0.0 ab 11.8 ± 0.4 cd 10.9 ± 0.3 c 0.0 ± 0.0 a W115 98.5 ± 0.0 a 98.5 ± 0.0 a 8.7 ± 0.3 ab 76.3 ± 2.5 def 19 ± 2 a 900 ± 0 a 9.3 ± 0.3 ab 12.8 ± 0.5 de 11.8 ± 0.4 cde 0.0 ± 0.0 a W120 98.5 ± 0.0 a 98.5 ± 0.0 a 8.8 ± 0.3 ab c 77.0 ± 0.0 def 19±4 a 900 ± 0 a 9.5 ± 0.0 b 12.6 ± 0.1 de 11.7 ± 0.0 cd 0.0 ± 0.0 a W Va ro m a 98.5 ± 0.0 a 98.5 ± 0.0 a 8.7 ± 0.6 ab 69.0 ± 0.0 g 19±2 a 900 ± 0 a 9.7 ± 0.1 b 14.5 ± 0.1 13.0 ± 0.0 f 0.0 ± 0.0 a W’100 98.5 ± 0.0 a 98.5 ± 0.0 a 9.7 ± 0.6 ab c 108.0 ± 2.6 b 36 ± 14 ab c 900 ± 0 a 8.9 ± 0.5 ab 8.5 ± 0.1 b 8.3 ± 0.2 b 220.0 ± 0.0 b W’105 98.5 ± 0.0 a 98.5 ± 0.0 a 9.8 ± 0.3 bc 82.7 ± 4.0 d 37 ± 8 ab c 900 ± 0 a 8.7 ± 0.0 a 11.4 ± 0.4 c 10.9 ± 0.5 c 220.0 ± 0.0 b W’110 98.5 ± 0.0 a 98.5 ± 0.0 a 10.0 ± 0.0 c 75.3 ± 2.0 efg 45 ± 5 c 900 ± 0 a 8.6 ± 0.4 a 12.8 ± 0.4 ef 12.0 ± 0.3 de 220.0 ± 0.0 b W’115 98.5 ± 0.0 a 98.5 ± 0.0 a 10.0 ± 0.0 c 71.3 ± 2.5 fg 43 ± 4 c 900 ± 0 a 8.6 ± 0.1 a 13.8 ± 0.5 fg 12.6 ± 0.4 ef 220.0 ± 0.0 b W’120 98.5 ± 0.0 a 98.5 ± 0.0 a 9.8 ± 0.8 bc 69.0 ± 1.0 g 42 ± 12 bc 900 ± 0 a 8.6 ± 0.2 a 14.4 ± 0.1 g 13.0 ± 0.2 f 220.0 ± 0.0 b W’ Va ro m a 98.5 ± 0.0 a 98.5 ± 0.0 a 9.5 ± 0.5 ab c 68.7 ± 1.5 g 38 ± 9 ab c 900 ± 0 a 8.9 ± 0.4 ab 14.1 ± 0.3 g 13.1 ± 0.3 f 220.0 ± 0.0 b D20 98.5 ± 0.0 a 101.5 ± 0.0 a 9.2 ± 0.3 a 92.7 ± 2.1 a 6 ± 2 a 748 ± 9 a 9.1 ± 0.2 a 8.7 ± 0.2 a 8.1 ± 0.2 a 0.0 ± 0.0 a D25 98.5 ± 0.0 a 102.2 ± 0.6 a 9.8 ± 0.3 b 90.0 ± 1.7 a 9 ± 4 ab 719 ± 4 c 8.6 ± 0.3 a 8.8 ± 0.1 a 8.0 ± 0.2 a 0.0 ± 0.0 a D’20 98.5 ± 0.0 a 101.5 ± 0.0 a 10.0 ± 0.0 b 68.3 ± 0.6 b 26 ± 7 c 738 ± 6 ab 8.4 ± 0.0 a 12.4 ± 0.2 b 10.8 ± 0.2 b 220.0 ± 0.0 b D’25 98.5 ± 0.0 a 102.2 ± 0.5 a 10.2 ± 0.3 b 67.7 ± 0.6 b 19 ± 4 bc 727 ± 8 bc 8.4 ± 0.4 a 12.4 ± 0.2 b 10.7 ± 0.1 b 220.0 ± 0.0 b n, n um ber o f r ep et itio ns; T , t re at m en t; T i , ini tia l b oi lin g t em pera tur e; T f , f in al b oi lin g t em pera tur e; t i , ini tia l t im e o f t he e va po ra tio n; t f , f in al t im e o f t he e va po ra tio n; M1 , p ar tia l m as s o f e va po ra te d wa ter ; M 2 , m as s o f t ot al e va po ra te d wa ter ; ah , h ea tin g ra te; a e , co ns ta nt e va po ra tio n ra te; E r , t ot al e va po ra tio n ra te; V , a ir f lo w ra te in th e exh au st er . 1Co eff ici en ts o f d et er m in at io n (R 2) f or l in ea r r ela tio n b etw een h ea tin g r at e a nd t im e: 0.992 ( W100 ), 0.988 ( W105 ), 0.990 ( W110 ), 0.990 ( W115 ), 0.990 ( W120 ), 0.987 ( WVa ro m a ), 0.973 ( W ’100 ), 0.974 ( W ’105 ), 0.973 ( W ’110 ), 0.974 ( W ’115 ), 0.974 ( W ’120 ), 0.987 ( W ’V ar om a); 2(R 2 ) f or l in ea r r ela tio n b etw een c ons ta nt e va po ra tio n r at e a nd tim e: 0.999 ( W100 ), 0.998 ( W105 ), 0.998 ( W110 ), 0.998 ( W115 ), 0.999 ( W120 ), 1.000 ( WVa ro m a ), 0.998 ( W ’100 ), 0.999 ( W ’105 ), 0.998 ( W ’110 ), 0.999 ( W ’115 ), 0.998 ( W ’120 ), 1.000 (W ’Varo m a ); S ta tis tic al a na lys es o f t he a vera ge a ttr ib ut es, w her e t he s am e let ter do es n ot dif fer (P < 0.05) b y T uk ey t es t.
to characterize dulce de leche. The de termi-tion of the moisture content was performed by the gravimetric method, while the lipid con tent was obtained by the Gerber method according Pereira et al. (2001) (both in dupli-cate). Aw analysis was performed in duplicate, and conducted on Aqua Lab 4 ATE equip ment (Pullman, USA). The quantification of solu-ble solids content was obtained in triplicate by refractometry using the Reichert AR200 equipment (Buffalo, USA).
Statistical analysis
The results were evaluated by varian-ce analysis (ANOVA) and Tukey test for comparison of means (p < 0.05). Data were analyzed using the statistical program Statis-tical Analysis System (SAS Institute Inc., 2006) version 9.2, licensed to the Federal University of Viçosa.
Theory/calculation
According to Roos (2007), the increase of the boiling temperature, as a consequence of the concentration of the product, can be calculated as 2 * ( wb) ln w b v R T a T h − ∆ = ∆ (Eq. 2)
where DTb = boiling point elevation, R = gas
constant (8.314 J . mol-1 . K-1), T
wb = boiling
temperature of water (373 . 15 K), aw = water
activity of the product, and Dhv = molar latent
heat of vaporization (J . mol-1).
The Dhv value can be calculated via
equation 3 according to Morison; Hartel (2007).
Dhv = 57222 - 44.3 * Twb (Eq. 3)
RESULTS AND DISCUSSION
Table 3 presents the results of water and dulce de leche evaporation experiments. As expected, the water evaporation occurred at a constant boiling temperature. During evaporation, the exhauster presence was related to the rate of water evaporation, and to the time at which evaporation began. In all tested configurations of the Thermomix, the exhauster delayed the beginning of eva-poration; on average the time until evapo-ration start was 11.4% higher, with the
mi-nimum from W105 (5.4%) and the maximum
from W115 (14.9%). However, during the
eva poration phase, the exhauster contributed to an increased rate of water evaporation. On average the rate of evaporation was increa sed
by 12.6%, with minimum for Wvaroma (0.76%)
reaching 25.8% for W100. The duration of the
evaporation was on average 10.7% lower,
reaching 21.2% of reduction for W100. In dulce
de leche industrial production, the presence
of the exhauster is mandatory, primarily be-cau se it increases the evaporation rate, con-sistent with the present results. Simulations of the evaporation process should investigate the exhaust system or pressure reduction (vacuum evaporation), as demonstrated by Silva et al. (2015), Silveira et al. (2013), Rovedo et al. (1991), Martinez et al. (1990), and Pauletti et al. (1990).
Silveira et al. (2015) compared the effi-cacy of a pilot scale single stage evaporator in the evaporation of water and skim milk. In this study the heat transfer coefficient did not differ according to the product, while the flow behavior was modified. It concluded that the behavior of a product during the evaporation process can not be predicted by the global coefficient of heat transfer alone, requiring a wide range of information to understand the evaporation process, such as residence time distribution, product viscosity, and surface tension.
For the dulce de leche evaporation the exhauster reduced the time of evaporation by 25.5%, increased the evaporation rate by 33.5%, and delay the beginning of boiling by 6.4%.
The rate of water evaporation during the
dulce de leche production experiments was
not affected by the amount of added sugar
(treatments D20 and D25), and no reduction in
evaporation time was detected. The values reported here for the mass of water evaporated were, on average, higher than those found by Silva et al. (2015).
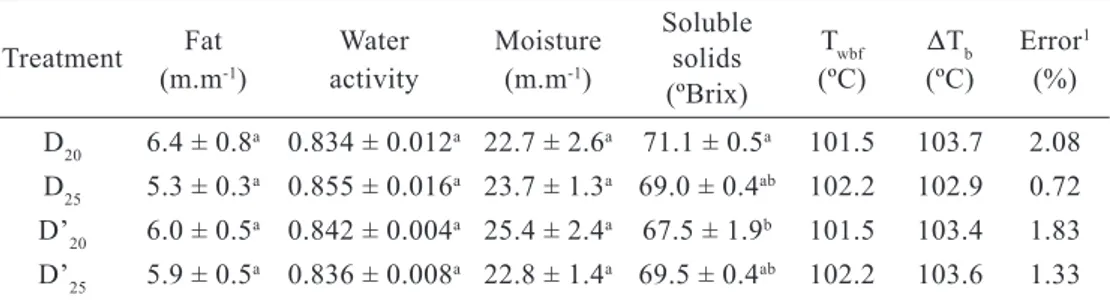
The compositions of the dulce de leche obtained in the experiment are presented in Table 4.
The dulce de leche produced using a multi-monitored Thermomix to emulate in dustrial evaporation of water presented compositions of fat, water activity, moisture, and soluble solids similar to those of indus-trial pro ducts from Brazil, Argentina, and Uruguay (GAZE et al., 2015a; ZARPELON et al., 2016). In a study by Gaze et al. (2015b) was found a variation between 3.56 g / 100 g at 6.99 g / 100 g fat and 17.49 g / 100 g at 29.67 g / 100 g moisture, while Silva et al. (2015) found a mean soluble solids content equivalent to 66.7 ºBrix (± 2.1). These results
are in agreement with the present study. Figure 3 – Comparison of total water eva-poration among the treatments.
Table 4 – Dulce de leche compositions (n = 3)
Fat Water Moisture Soluble T
wbf DTb Error1 Treatment solids (m.m-1) activity (m.m-1) (ºBrix) (ºC) (ºC) (%) D20 6.4 ± 0.8a 0.834 ± 0.012a 22.7 ± 2.6a 71.1 ± 0.5a 101.5 103.7 2.08 D25 5.3 ± 0.3a 0.855 ± 0.016a 23.7 ± 1.3a 69.0 ± 0.4ab 102.2 102.9 0.72 D’20 6.0 ± 0.5a 0.842 ± 0.004a 25.4 ± 2.4a 67.5 ± 1.9b 101.5 103.4 1.83 D’25 5.9 ± 0.5a 0.836 ± 0.008a 22.8 ± 1.4a 69.5 ± 0.4ab 102.2 103.6 1.33
n = number of repetitions. Statistical analyses of the average attributes. Where the same letter does not differ (P < 0.05) by Tukey test. 1 = error between calculated and obtained boiling temperature at the end of evaporation. where: Twbf = boiling temperature at the end of evaporation, DTb = calculated boiling temperature at the end of
Table 4 presents the relation between concentration and boiling temperature for
dulce de leche.
The maximum error between the pre-dicted value for boiling temperature, cal-culated from equations 2 and 3, and the boi ling temperature observed using the multi-monitored Thermomix was of 2.08%. This result implies that the multi-monitored Ther-momix can be used to establish Dühring curves for different foods during evaporation.
Figure 3 shows rates of water evapo-ration for different configuevapo-rations of the multi-monitored Thermomix.
Among all of the tested treatments, four sets of experimental conditions yielded
ma ximal water evaporation (W’varoma, Wvaroma,
W’120, and W120).
CONCLUSIONS
The food processor brand Thermomix®
enabled us to precisely determine the varia tion of mass during the process, show the effect of the exhaust system on the evaporation, obtain dulce de leche with market composition, and determine the effect of sugar addition on evaporation of water during production. The error between the final boiling point tem perature and that predicted by theory was ~ 2%; as a consequence, the equipment could be applied to establishing Dühring
curves. The Thermomix® multi-monitored
confi gura tion is a potential tool to emulate evaporation in the food industry, as demons-trated by our laboratory-scale production of dulce de leche. Futures studies should apply statistical methods to validate the
Thermomix® multi-monitored as an industrial
simulator of evaporation.
ACKNOWLEDGMENT
This work was supported by the Bra-zilian agencies CNPq and CAPES.
REFERENCES
DODEJA, A. K. et al. Heat transfer during evaporation of milk to high solids in thin
film scraped surface heat exchanger. Journal
of Food Process Engineering, v. 12, p.
211-225, 1990.
GAZE, L. V. et al. Preference mapping of dulce de leche commercialized in Brazilian
markets. Journal of Dairy Science, v. 98, p.
1443-1454, 2015a.
GAZE, L. V. et al. Dulce de Leche, a typical product of Latin America: Characterisation by physicochemical, optical and instrumental
methods. Food chemistry, v. 169, p. 471-477,
2015b.
KIM, K. H. et al.Factors affecting
performan-ce of brine driven evaporators. Journal of
Food Process Engineering, v. 7, p. 37-62,
1983.
MARTINEZ, E. et al. Sandiness prevention in dulce de leche by seeding with lactose
microcrystals. Journal of Dairy Science, v.
73, p. 612-616, 1990.
MORISON, K. R.; HARTEL, R. W. Eva-poration and freeze concentration. In: Heldman, D. R. & Lund, D. R. (Eds.).
Handbook of Food Engineering, 2007.
Boca Raton: CRC Press. p. 495-552. PAULETTI, M., et al. Rheological charac-terization of dulce de leche, a confectionery
dairy product. Journal of Dairy Science,
v. 73, p. 601-603, 1990.
PEREIRA, D. B. C. et al. Físico-química do
leite e derivados – métodos analíticos. 2ª ed.
Juiz de Fora, 2001.
Per-formance analysis of the milk concentrating system from a Brazilian milk powder plant.
Journal of Food Process Engineering, v. 26,
p. 181-205, 2003.
ROOS, Y. H. Phase transitions and trans-formations in food systems. In Heldman, D.
R. & Lund, D. R. (Eds.). Handbook of Food
Engineering, 2007. Boca Raton: CRC Press.
p. 287-532.
ROVEDO, C. O. et al. The effect of pH and temperature on the rheological behavior of Dulce de leche, a typical dairy Argentine
product. Journal of Dairy Science, v. 74, p.
1497-1502, 1991.
SCHUCK, P. et al. Recent advances in spray drying relevant to the dairy indus try:
A comprehensive critical review. Drying
Technology, v. 34, p. 1773-1790, 2016.
SILVA, F. L. et al. Production of dulce de leche: The effect of starch addition.
LWT-Food Science and Technology, n. 62, p.
417-423, 2015.
SILVEIRA, A. C. P. et al. Pilot-scale investigation of effectiveness of
evapora-tion of skim milk compared to water. Dairy
Science & Technology, v. 93, p. 537-549,
2013.
SILVEIRA, A. C. P. et al. Flow regime assessment in falling film evaporators using
residence time distribution functions.
Jour-nal of Food Engineering, v. 160, p. 65-76,
2015.
SOROUR, M. A. et al. A case study of orange juice concentration by recompression
evaporation techniques. Journal of Food
Process Engineering, v. 36, p. 337-342, 2013.
STEPHANI, R. et al. Evaluation of the synergistic effects of milk proteins in a rapid
viscosity analyzer. Journal of Dairy Science,
v. 98, p. 8333-8347, 2015.
TANGUY, G. et al. Calcium phosphate pre-cipitation during concentration by vacuum evaporation of milk ultrafiltrate and micro
fil-trate. LWT-Food Science and Technology,
v. 69, p. 554-562, 2016.
TEJINDER, S. Flow properties of malt con-centrate-sweetened condensed milk mixtures.
Journal of Food Process Engineering, v. 23,
p. 221-235, 2000.
ZARPELON, J. et al. Validation of an au-tomated method for the analysis of fat content
of dulce de leche. Journal of Food