CRYPTIC
SPECIATION IN THE
FIELD VOLE
(Microtus agrestis):
INSIGHTS FROM GENETIC,
KARYOTYPIC AND
MORPHOMETRIC DATA
Joana Maria Jorge Pereira de Castro Paupério
Doutoramento em Biologia
Departamento de Biologia 2012
Orientador
Paulo Célio Alves, Professor Auxiliar, Faculdade de Ciências
da Universidade do Porto
Coorientador
Nota prévia:
Na elaboração desta dissertação, e nos termos do número 2 do Artigo 4º do Regulamento Geral dos Terceiros Ciclos de Estudos da Universidade do Porto e do Artigo 31º do D.L. 74/2006, de 24 de Março, com a nova redação introduzida pelo D.L. 230/2009, de 14 de Setembro, foi efetuado o aproveitamento total de um conjunto coerente de trabalhos de investigação já publicados ou submetidos para publicação em revistas internacionais indexadas e com arbitragem científica, os quais integram alguns dos capítulos da presente tese. Tendo em conta que os referidos trabalhos foram realizados com a colaboração de outros autores, o candidato esclarece que, em todos eles, participou ativamente na sua conceção, na obtenção, análise e discussão de resultados, bem como na elaboração da sua forma publicada.
This research was supported by Programa Operacional Potencial Humano – Quadro de Referência Estratégico National funds from the European Social fund and the Portuguese Ministério de Educação e Ciência through a PhD fellowship (Fundação para a Ciência e a Tecnologia, FCT - SFRH/BD/27369/2006).
This work was developed in
This thesis should be cited as:
Paupério J (2012) Cryptic speciation in the field vole (Microtus agrestis): insights from genetic, karyotypic and morphometric data. PhD Thesis, University of Porto, Porto, Portugal.
ACKNOWLEDGEMENTS
Lots of people contributed to the content of this thesis. Either by giving samples, suggestions or support, or by making me think about things or just by being present... To all I would like to say: Thank you!
I would like to thank my two supervisors, Paulo and Jeremy, without them this thesis would not have been accomplished.
Paulo, já me aturas há bastante tempo… há mais de uma década!!! E, na verdade és totalmente responsável pelo tema desta tese. Foste tu que me puseste o ’bichinho do agrestis atrás da orelha’... mostraste-me os primeiros trabalhos realizados pela Maarit com esta espécie… Obrigada por isso! Obrigada também por me teres acompanhado todos estes anos, por todas as tuas sugestões, ensinamentos, pelo teu companheirismo, apoio e amizade e também pelo entusiasmo que sempre demonstraste com este trabalho e que sempre me deu grande ânimo.
Jeremy, it has been a pleasure to know you and work with you! Thanks a lot for being so welcoming and for sharing with me all your knowledge and experience not only in the lab but also in our field trips. You were my good luck charm for finding voles…The voles seemed to throw themselves into the pool at CIBIO whenever you were in town! I enjoyed a lot my time in York, specially our nice suppers with Sofia’s chocolate mousse and our memorable conversations about pudding... ups, sorry, I meant to say the continuous hard work! Thank you for being such a good supervisor!
I would also like to thank the institutions that made this work possible. To FCT, for the attribution of my PhD fellowship. To CIBIO and Professor Nuno Ferrand for the opportunity of developing this study in this excellent research centre. And to the University of York, for welcoming me during my stays.
I also want to express my appreciation to the institutions that gave me the appropriate permits for trapping and collecting tissue samples from field voles both in Portugal and northern Spain: Instituto da Conservação da Natureza e da Biodiversidade, Consejería de Medio Ambiente do Gobierno del Principado de Asturias, Consellería de Medio Ambiente y Desenvolvemento Sostible de Galicia, Servició Territorial de Medio Ambiente de la Comunidad Autónoma de Castilla Léon, Parque Nacional Picos da Europa, Dirección General de Biodiversidad de la Comunidad Autónoma de Cantabria, Departamento de Agricultura de la Deputación Foral de Bizkaia, Departamento de Medio Ambiente de la Diputación Foral de Álava, Dirección General de Medio Natural da Comunidad Autónoma de Cataluña.
The results presented in this thesis wouldn’t have been accomplished without the contribution of a great number of people and institutions.
First of all to Maarit Jaarola, thank you for your availability in answering my doubts and sending me some of your samples. It was a pleasure to have you as a co-author of the first paper of the thesis!
To Alejandro Centeno-Cuadros, Alfonso Ceña, Antoni Arrizabalaga and the Museum of Natural Science of Granollers, António Mira and the PERSIST project team, Augusto de Castro, Beatriz e Vasco Alves, Carlos Fonseca, Carlos Nores, Cristianne Bastos-Silveira, Enrique Castiéns, Fernando Jubete, Guilherme Dias, Hélia Gonçalves, Jacinto Róman, José António Godoy, José Manuel Grosso-Silva, Maria José Lopez-Fuster and the University of Barcelona,
the Portuguese National Tissue Bank/National Institute for Nature and Biodiversity Conservation (BTVS/ICNB), Rocio Rosa-García, Sara Afonso, Vanessa Mata, Verónica Gomes and Zbyszek Boratynski, thanks a lot for providing samples for this study! I am also grateful to Maria da Luz Mathias and the University of Lisbon, for lending some field materials. And, as not only people may contribute to a PhD thesis, I would also like to express my gratitude in a special way to Rafi (Paulo’s dog), Tomás and Manuchau (Pedro’s cats) and Fran (Guilherme’s cat).
To the York gang, Mabel, Sofia, Ellie, Rodrigo, Sophie, Natalia, Jerry, Dan, Frida, Bruce, Mike, Nancy and Ollie thank you guys for being so welcoming! Despite the rainy weather, I really enjoyed the time I spend in York!
Jerry, thank you for teaching me the ways around the lab and for getting me started in the molecular analysis. I was very happy that we could collaborate in part of the work developed in the thesis and hopefully we will continue to work together in the next projects. Natalia, the other mum in the lab, with you I shared my family homesickness and I learned a lot, especially how to be efficient in the lab! Thank you for that! Rodrigo, I really enjoyed our field trip in northern Spain. We’ve seen very nice places and trapped lots of voles, and some shrews… Thank you for all our conservations and discussions, I learned a lot with that. Mabelita, cariño… how nice was your company… I couldn’t have done it without you! Thank you for all the moments we spent at the lab and in the city… thanks a lot for keeping me company. Thanks for teaching me all about the karyotypes and working with me on the paper, it turned out to be a very promising work! I really enjoyed your visit to Porto and hope you can come and visit us soon! Sofia, a minha companheira portuguesa nas terras britânicas! Que boas as nossas conversas, os nossos jantares e passeios na cidade… Obrigado por me ajudares a superar as saudades de casa e da minha família! Com a tua companhia tudo foi mais fácil! Obrigado por tudo!!!!
Aos meus colegas do CIBIO, em especial ao gabinete do GEPE mas não só, um muito obrigado. Sónia, Peter spider man, Xico, Francisco, Raquel, Cândida, Ana, Fátima, João, Verónica, Tiago meus colegas de gabinete ou no lab, em um ou outro momento muito obrigado pelas conversas, dicas e pela companhia. Tarroso, obrigada pelas eternas ajudas no arcgis! À Ana Silva, Alexandra, Joana, Rómulo, agradeço a ajuda no trabalho de campo e na análise das egagrópilas. Ao Zef e ao Miguel Carneiro, muito obrigado pelas conversas e discussões sobre species trees e evolução dos Microtus. Zef, a tua participação nessa fase do trabalho foi essencial. À Sandra e à Sara muito obrigado por estarem sempre disponíveis e fazerem sempre todos os possíveis para tornarem o nosso trabalho mais fácil!
Aos colegas do lab da FCUP (Tiago, Sandra, Pedro e Zé Manel) obrigadinha por me terem acompanhado nestes últimos momentos de escrita. Tiago, obrigada pelo apoio, por me responderes às minhas dúvidas, mesmo as mais idiotas, pelos teus treinos de relaxamento…
Às meninas do CTM (e meninos) muito obrigado por me terem acolhido quando precisei de ir analisar os meus crânios. Diana, obrigado por tudo o que me ensinaste, a tua experiência foi fundamental para o sucesso deste trabalho!
À Hélia, por toda a ajuda que me deste no campo, pela amizade e por todas as amostras que me conseguiste, um muito obrigado. És a minha colaboradora nº 1.
Ao Ricardo Pita e ao António Mira (Universidade de Évora) por todo o apoio que sempre me deram. António, obrigada pela disponibilidade e pela maneira como sempre me apoiaste neste trabalho. Ricardo, obrigada por me ensinares a capturar os Microtus…as dicas que me deste foram essenciais para o sucesso das minhas saídas de campo.
À Soraia, tem sido um prazer trabalhar contigo! O teu companheirismo, amizade e ajuda foram fundamentais para este trabalho! Obrigado!
Catas, companheira! Demos os nossos primeiros passos na ciência juntas e apesar de termos seguido caminhos um pouco diferentes estiveste sempre presente. Muito obrigado pela tua amizade, pelos momentos de hiperventilação conjunta e por estares sempre disponível mesmo nos momentos menos bons.
A todos os meus amigos, que não vou nomear (eles sabem quem são) muito obrigado por serem quem são e por estarem presentes!
Obrigado, Mariana Sampaio, pelo desenho maravilhoso que fizeste para a minha capa. E finalmente, aos meus pais, por todo o apoio que sempre me deram! Sem eles não estaria aqui hoje. A toda a minha família pela amizade e ajuda que sempre nos deram.
Ao meu eterno companheiro e às minhas três princesinhas, vocês são a luz que ilumina os meus dias! Muito obrigado por estarem sempre presentes…
FCUP i
Resumo
RESUMO
A delimitação de ‘espécies crípticas’, espécies próximas que apresentam uma elevada divergência genética sem diferenciação morfológica aparente, contribui de forma significativa para o aumento do conhecimento relativo à especiação, bem como para a conservação da biodiversidade. Este trabalho incide sobre o rato-de-campo-de-cauda-curta, Microtus agrestis, uma espécie de pequeno mamífero com distribuição euroasiática e que apresenta pouca variabilidade ao nível morfológico e cariotípico. No entanto, estudos recentes baseados na análise de DNA mitocondrial e de intrões localizados nos cromossomas sexuais, demonstraram que esta espécie se encontra diferenciada em duas linhagens, com distribuições a norte e a sul da Eurásia e que possuem uma divergência genética suficientemente elevada para que possam ser consideradas duas espécies crípticas. Estes estudos demonstraram ainda a existência de duas linhagens mitocondriais na Península Ibérica, embora baseados num número limitado de amostras.
O objetivo geral deste trabalho consistiu no estudo da história evolutiva do rato-de-campo-de-cauda-curta através da análise de marcadores moleculares de diferentes regiões genómicas. Os padrões geográficos da variabilidade genética, cariotípica e morfométrica foram avaliados, dando-se maior enfâse à Península Ibérica, local onde foi previamente detetada uma elevada divergência ao nível do DNA mitocondrial.
Os resultados obtidos demonstraram que o rato-de-campo-de-cauda-curta consiste de facto num complexo de três unidades evolutivas distintas: Norte, Sul e Português. As análises de coalescência sugerem que a divergência destas três linhagens terá ocorrido durante o último período glaciar, o que indica um processo de especiação rápido. A linhagem Portuguesa terá sido a primeira a diferenciar-se (há cerca de 70 000 anos) e as linhagens do Norte e Sul ter-se-ão separado durante o último máximo glaciar (há cerca de 18 500 anos).
A análise cariotípica de dois indivíduos pertencentes à linhagem Portuguesa revelou a existência de alguma variabilidade na morfologia dos cromossomas sexuais, nomeadamente na estrutura do cromossoma Y e no tamanho dos cromossomas X e Y. Estes resultados sugerem ainda uma possível diferenciação cariotípica entre as diferentes linhagens e realçam o interesse de se realizar uma análise cariotípica mais extensiva das linhagens Portuguesa e do Sul.
ii FCUP
Cryptic speciation in the field vole (Microtus agrestis)
O estudo detalhado das populações ibéricas de M. agrestis através de métodos de genética não-invasivos (análise de crânios provenientes de egagrópilas e de amostras de museus) permitiu conhecer com maior rigor a distribuição espacial das linhagens do Sul e Portuguesa na Península Ibérica. Este trabalho revelou também a existência de uma extensa área de introgressão de marcadores nucleares e mitocondriais entre as duas linhagens no nordeste de Espanha. Contudo, a introgressão observada é assimétrica, indiciando um possível movimento da zona hibrida e, por outro lado, foi detetada a existência de mecanismos de isolamento pós-zigótico, evidenciada sobretudo pela não ocorrência de introgressão nos machos.
A forma das mandíbulas utilizadas no estudo molecular acima descrito, foi analisada através de métodos de morfometria geométrica, tendo revelado a existência de diferenças significativas entre as linhagens Portuguesa e do Sul. Este facto sugere que, apesar destas linhagens serem crípticas, evidenciam já uma diferenciação morfométrica subtil em estruturas como a mandibula.
A análise extensiva realizada na Península Ibérica foi possível devido à incorporação de amostras não-invasivas. De forma a otimizar a incorporação deste tipo de amostras desenvolveu-se um método de identificação molecular dos roedores da Península Ibérica. Este método permite a identificação inequívoca de todas as espécies de roedores ibéricos, com a exceção das espécies próximas, Microtus
lusitanicus e M. duodecimcostatus. A utilização deste método irá potenciar os estudos
de distribuição, dinâmica populacional e de conservação da biodiversidade nesta importante região biogeográfica.
Em resumo, todos os dados analisados suportam a existência de três linhagens de Microtus agrestis caraterizadas por uma elevada diferenciação genética (em todas as regiões genómicas), pela existência de alguma variabilidade morfológica e cariotípica, bem como pela quantidade limitada de fluxo genético nas áreas de contacto identificadas. Face a estas evidências e de acordo com alguns conceitos de espécies, estas linhagens podem mesmo ser consideradas como espécies distintas. De qualquer forma, e apesar de ser desejável a recolha de informação adicional tanto ao nível cariotípico e morfológico como genómico, estas três linhagens devem ser reconhecidas como Unidades Evolutivas Significativas para efeitos de conservação.
Palavras-chave: Pequenos mamíferos, roedores, espécies crípticas, história evolutiva, análise multilocus, evolução cromossómica, isolamento reprodutivo, morfometria geométrica, métodos não-invasivos.
FCUP iii
Summary
SUMMARY
The delimitation of ‘cryptic species’, sister forms that show substantial genetic differentiation without apparent morphological variation, is important for understanding speciation and is also relevant for biodiversity conservation. This thesis focuses on the field vole, Microtus agrestis, a Eurasian mammal with little morphological and karyotypic differentiation but which, on the basis of previous molecular studies of mitochondrial DNA and X and Y chromosome introns, was subdivided into a Northern and a Southern lineage. In the earlier work these lineages were considered sufficiently divergent to possibly represent two cryptic species and there were indications of further subdivision of the Southern lineage within Iberia, although based in few samples.
The general goal of this thesis was to study the evolutionary history of the field vole focusing on the major subdivisions previously detected and using a multilocus approach. The geographic patterns of genetic, karyotypic and morphometric variation were thoroughly investigated, with a stronger emphasis than previously on the Iberian Peninsula where high genetic variability had been detected and available information was limited.
The main results obtained here reveal that the field vole is in fact a complex of three distinct evolutionary units with neighboring geographic distributions in Eurasia, which may represent three cryptic species: Northern, Southern and Portuguese. Divergence among these lineages was inferred to have occurred during the last glacial period indicating a rapid pace of speciation. The Portuguese lineage split occurred first (at ca. 70 000 years BP) and the separation of the Northern and Southern lineages is dated to the Last Glacial Maximum (at ca. 18 500 years BP).
The analysis of the Portuguese lineage karyotypes showed some variation in sex chromosome morphology relative to previously described Northern lineage karyotypes, namely in the structure of the Y chromosome and in the size of both X and Y chromosomes. These results point to a possible karyotypic differentiation between the lineages and stress the interest in performing an extensive analysis of karyotypic variability within the Portuguese and Southern lineages.
A landscape-scale analysis of Iberian field vole populations through noninvasive genetic sampling (bones from barn owl pellets and from museum collections) revealed the existence of a wide area of introgression of nuclear and mitochondrial loci between the Southern and Portuguese lineages, suggesting possible movement of the hybrid zone formed on initial contact of these lineages. This introgression was found to be
iv FCUP
Cryptic speciation in the field vole (Microtus agrestis)
asymmetric, with a higher introgression of Southern lineage alleles into the Portuguese lineage than vice versa, suggesting a particularly large movement of the zone in favour of the Portuguese lineage. In addition, evidence of post-mating isolation mechanisms was also found; the complete absence of hybrid males suggests strong selection against them.
Analysis of the variability of mandible shape through geometric morphometrics revealed the existence of significant differences between the Portuguese and Southern lineages. These results suggest that these forms, although essentially ‘cryptic’, show some subtle morphometric differentiation in mandible shape.
The extensive and detailed landscape-scale analysis of field voles in the Iberian Peninsula was only possible due to the use of noninvasive sampling. To optimize the analysis of this type of samples, we first developed a genetic method for identifying the Iberian rodent species, which could be applied to noninvasive samples. This method allowed the unambiguous identification of all Iberian rodents with the exception of the sibling species Microtus lusitanicus and M. duodecimcostatus. The genetic method can be used in studies of distribution, population dynamics and for biodiversity conservation in this important biogeographical region.
Overall, the data in this study show consistent results, identifying three lineages of the field vole, genetically distinct (in all genomic regions), with some karyotypic and morphological variability and a limited amount of gene flow within the areas of contact of the lineages. Although collecting additional information both on karyotypic and morphological variability as well as genomic data would nonetheless be desirable, these three lineages should already be recognized as Evolutionarily Significant Units for conservation purposes.
Keywords: Small mammals, rodents, cryptic species, evolutionary history, multilocus dataset, chromosomal evolution, reproductive isolation, geometric morphometrics, noninvasive genetic sampling.
FCUP v Table of contents
TABLE OF CONTENTS:
RESUMO
i
SUMMARY
iii
TABLE OF CONTENTS
v
LIST OF FIGURES
vii
LIST OF TABLES
xi
CHAPTER 1 – General Introduction 1
1.1. Speciation and species delimitation 3
1.1.1. ‘Cryptic’ speciation 3
1.1.2. Chromosomes and speciation 4 1.1.3. Gene flow and speciation 6
1.1.4. Species delimitation 9
1.2. Molecular tools 10
1.2.1. Noninvasive sampling 12
1.3. Geometric morphometrics 13
1.4. The Eurasian field vole 14
1.5. Objectives and structure of the thesis 17
1.6. List of papers 19
1.7. References 19
CHAPTER 2 – Evolutionary history of the field vole in Eurasia
29
Paper I - Cryptic speciation in the field vole: a multilocus approach confirms three highly divergent lineages in Eurasia
31 Paper II - Giant sex chromosomes retained within the Portuguese lineage of the field vole (Microtus agrestis)
67
CHAPTER 3 – Differentiation of the two lineages of the field vole in
Iberia: insights from molecular and morphometric data
77
Paper III - Asymmetric introgression between the two lineages of the field vole in the Iberian Peninsula revealed by noninvasive genetic sampling
79 Paper IV - Morphometric differentiation of the two field vole lineages in the Iberian Peninsula: a geometric analysis of mandible shape
vi FCUP
Cryptic speciation in the field vole (Microtus agrestis)
CHAPTER 4 – A method for genetic identification of Iberian rodents
141
Paper V - Genetic identification of Iberian rodent species using both mitochondrial and nuclear loci: application to noninvasive sampling
143
CHAPTER 5 – General Discussion
187
5.1. Three cryptic lineages of the field vole in Eurasia 189 5.2. The evolutionary history of Microtus agrestis sensu lato 191 5.3. Multiple evidence suggest the revision of species status 193 5.4. The value of noninvasive sampling 195 5.5. The field vole as a model system 196 5.6. Future research prospects 198
5.7. References 199
FCUP vii
List of figures
LIST OF FIGURES:
CHAPTER 1
Fig. 1 Distribution range (green) of the field vole (Microtus agrestis). 15
CHAPTER 2
Paper I
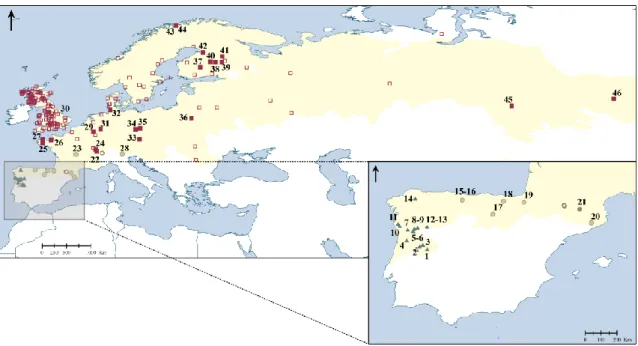
Fig. 1 Map showing in yellow shading the distribution range of the field vole (Microtus
agrestis) according to IUCN (2010), as well as the geographical location of the
sampling localities (filled symbols) and of the sequences retrieved from GenBank (empty symbols). The locality numbers refer to those in Table 1. Symbols indicate the lineages identified in the gene trees (squares – Northern; circles – Southern; triangles – Portuguese).
34
Fig. 2 Phylogenetic tree based on Bayesian inference showing the relationships among
field voles for the cytochrome b gene (n = 412). Values on branches indicate posterior probability support and bootstrap values of the maximum likelihood and neighbour joining analysis. Lineages are coloured according to their geographic distribution, as in Fig. 1
41
Fig. 3 Median-joining networks of the X-chromosome introns (DBX5 and DBX6),
Y-chromosome introns (DBY7 and SCMY7) and autosomal genes (BRCA1 and RAG1) in
M. agrestis (number of sequences for each locus in Table 2). M. arvalis included as
outgroup (n = 1). Each circle represents one haplotype and circle area is proportional to the frequency of each haplotype. Total frequency is indicated for more common haplotypes. Branches are proportional to the number of nucleotide differences between haplotypes and dots on branches indicate mutational steps. Colours indicate geographic distribution of the lineages and correspond to those used in Fig. 1.
42
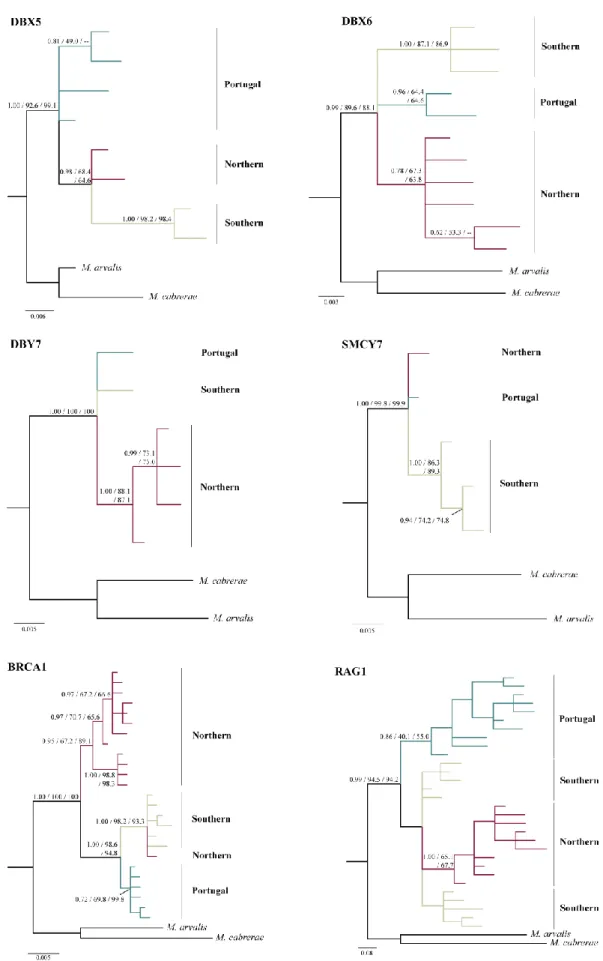
Fig. 4 Phylogenetic trees based on Bayesian inference showing the relationships
among field voles for the nuclear genes. Values on branches indicate posterior probability support for clades and bootstrap support for the maximum likelihood and neighbour joining analyses respectively. The lineages are coloured according to their geographic distributions, as in Fig. 1.
44
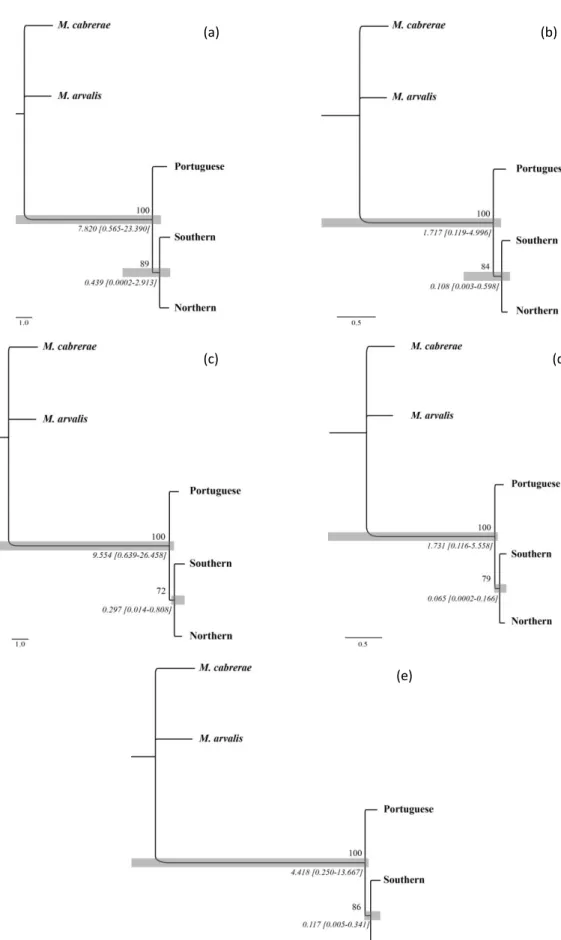
Fig. 5 Consensus species trees: (a) *BEAST species tree inference output for all 7 loci
analysed. The posterior probability of each clade is presented on each node and grey bars show 95% highest posterior density intervals for times to most recent common ancestor (tMRCA in substitutions per site; values presented below bar) of each lineage. (b) Consensus species tree inferred by ML in STEM for all loci for a θa value of 0.0118 (see text). Grey bars show 95% highest posterior density intervals of branch lengths in coalescent units (number of 2Ne generations). Bootstrap support (above) and branch lengths (mean and 95%HPD, below) are shown for each node.
46
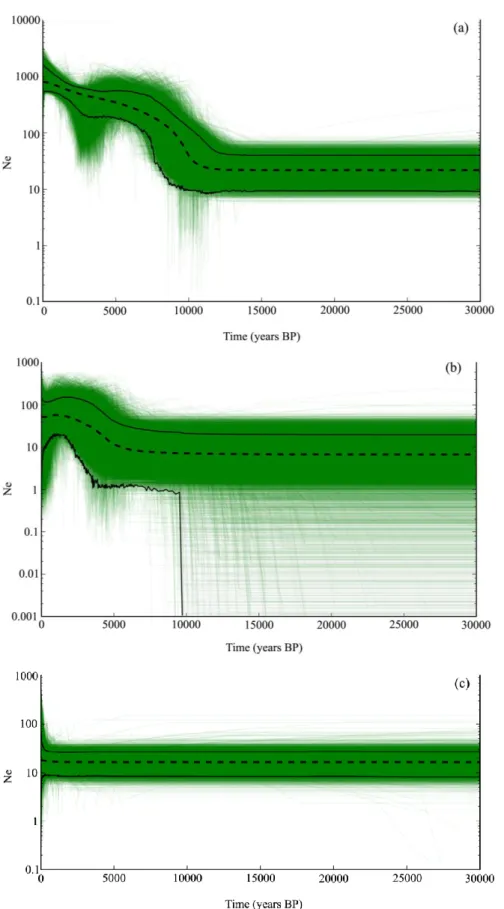
Fig. 6 Extended Bayesian Skyline plots of the effective population size through time
estimated from 1450 million post-burn-in generations from three MCMC simulations. The accumulation of thin lines gives a view of the full posterior distribution. Dashed black line is the median effective population size Ne, in thousands, multiplied by one (mean generation time in years). Solid black lines are the 95% highest posterior density
viii FCUP
Cryptic speciation in the field vole (Microtus agrestis)
limits. The y-axis is presented on a log scale for clarity. (a) – Northern lineage; (b) – Southern lineage; (c) – Portuguese lineage.
Paper II
Fig. 1 Localities where field voles have been karyotyped in Europe (adapted from
Fredga and Jaarola 1997). Yellow shading shows distribution of the field vole. Colouring of symbols indicates inferred molecular lineage, based on maps in Jaarola and Searle (2002, 2004). Blue: Northern lineage, standard karyotype. White: Northern lineage, Lund Y karyotype. Red: Southern lineage, standard karyotype. Star: our new Portuguese samples. Note that the actual density of sampling sites in southern Scandinavia is about double that shown here (Fredga and Jaarola 1997).
70
Fig. 2 Karyotypes of the female (a) and male (b) field vole from Portugal. 71
Fig. 3 Individual Y chromosomes from different metaphases from the Portuguese male
field vole. Arrow indicates an example of the distinct short arm on the Y chromosome. 72
CHAPTER 3
Paper III
Fig. 1 Median-joining networks of the molecular markers analysed in the Portuguese
and Southern lineages of M. agrestis (number of sequences for each locus in Table 1): a) Cytb gene; b) BRCA1 gene; c) DBX5 intron on the X-chromosome; d) DBY7 intron on the Y-chromosome. Each circle represents one haplotype and circle area is proportional to the frequency of each haplotype. Total frequency is indicated for the most common haplotypes. Branches are proportional to the number of nucleotide differences between haplotypes and dots on branches indicate mutational steps. Black is for Southern lineage haplotypes and white for Portuguese lineage haplotypes.
88
Fig. 2 Population structure inferred by Geneland, under the UFM, for the field vole in
the Iberian Peninsula (K=2). Dots represent sampling localities coloured according to the modal membership to each cluster (blue: Portuguese; red: Southern). The size of the dots is proportional to the number of samples analysed. X represents localities where we were able to amplify only one locus, which were not used in the analysis. The colour gradient refers to the posterior probability of assignment to each of the two clusters.
90
Fig. 3 Sampling localities in the Iberian Peninsula. Each pie chart represents one
locality and the area is proportional to the number of samples analysed. Colours indicate the frequencies of each lineage, considering the lineage assignment at all molecular markers analysed: black: Southern lineage; white: Portuguese lineage; grey: hybrid individuals. X represents localities where we were able to amplify only one locus. The dashed line corresponds to the one dimensional transect designed considering the field vole distribution in Iberia. The green shading corresponds to the distribution range of the field vole (Microtus agrestis) in the Iberian Peninsula according to Kryštufek et al. (2008).
91
Fig. 4 Detail of the frequencies of the lineage typical genetic markers per locality in the
hybrid zone: a) Cytb gene; b) BRCA1 gene; c) DBX5 intron on the X-chromosome; d) DBY7 intron on the Y-chromosome. Each pie chart represents one locality and the area is proportional to the number of samples analysed. Colours indicate the assignment of the individuals to each lineage. Black: Southern lineage; white: Portuguese lineage.
91
Fig. 5 Southern lineage allele frequencies plotted against geographic position on the
transect (Km) for the four markers analysed (only localities between km 200 and 800 of 92
FCUP ix
List of figures
the transect were plotted for ease of visualisation). Dots correspond to the observed frequencies and lines to the cline fitted; c is the cline centre and w the cline width.
Paper IV
Fig. 1 Sampling localities in the Iberian Peninsula. Each circle represents one locality
and the circle area is proportional to the number of samples analysed. Colours of the circle indicate the lineage assignment according to the existing molecular data: white - localities where only individuals from the Portuguese lineage were identified; black - localities where only individuals from the Southern lineage were identified; grey - localities where hybrids were identified. The four geographic regions used in the analysis are identified by coloured contours: Blue - Portugal; Purple - northwestern Spain; Brown - Burgos, Basque Country and Navarra; Green - northeastern Spain (see Methods for details). The green shading corresponds to the distribution range of the field vole (Microtus agrestis) in the Iberian Peninsula according to Kryštufek et al. (2008).
121
Fig. 2 Landmark configuration on the external view of the field vole right side mandible 122
Fig. 3 Box-plot of mandible CS variation (median and percentiles, 25-75%, as well as
maximum and minimum values) in the two lineages of field vole (Portuguese, n= 35; Southern, n=56) and hybrid individuals (n=4) by sex (Females, n=56; Males, n=39).
124
Fig. 4 Ordination of the samples in the space of the first two shape variables (RW1 and
RW2) based on the matrix of shape variables for the full data-set (n=226). a) Samples coloured according to geographic regions. PT - blue; NW - purple; BBN - brown; NE - green. b) Samples grouped according to the lineage assignment. Circles correspond to individuals for which genetic information exists and diamonds to samples that were not sequenced. Symbols are coloured according to the lineage assignment (circles) or populations of origin (diamonds). White - Portuguese lineage; Black - Southern lineage; Grey - hybrids. Each symbol represents one individual. Two samples from Burgos and other two samples from central Portugal are not shown as they represent outliers to the range of values of RW1 and RW2 shown in this scatter plot.
126
Fig. 5 Ordination of the samples according to the two discriminant functions (DF1 and
DF2) obtained in the analysis between geographic regions. Circles are coloured by region. PT: blue; NW: purple; BBN: brown; NE: green.
127
Fig. 6 Frequency histogram of discriminant function scores (DF) obtained in the
analysis between lineages. a) Considering the dataset of genotypic individuals (n=111). Bars are coloured according to the lineage assignment. White - Portuguese lineage; Black - Southern lineage. b) and c) TPS deformation grids showing the shape changes at DF. b) represents the extreme configuration for the Portuguese lineage and c) for the Southern lineage. The deformations were magnified three times for clarity. The mandibles in the deformation grids are stylised representations obtained by linking the pairs of landmarks (see Fig. 2). d) Considering all samples (n=226). Bars are coloured according to the lineage assignment of the population of origin. White - Portuguese lineage; Black - Southern lineage; Grey - hybrid populations.
128
Fig. 7 Population structure inferred by Geneland for the morphometric data (n=226).
Each circle represents one locality and the circle area is proportional to the number of samples analysed. Colours of the circle indicate the modal assignment of the individuals to each cluster. The four clusters are identified by different colours. The green shading corresponds to the distribution range of the field vole (Microtus agrestis) in the Iberian Peninsula according to Kryštufek et al. (2008).
130
x FCUP
Cryptic speciation in the field vole (Microtus agrestis)
and morphometric data (n=327). Each circle represents one locality and the circle area is proportional to the number of samples analysed. Colours of the circle indicate the modal assignment of the individuals to each cluster. The black and white colour refers to the two clusters identified in the analysis. The green shading corresponds to the distribution range of the field vole (Microtus agrestis) in the Iberian Peninsula according to Kryštufek et al. (2008).
CHAPTER 4
Paper V
Fig. 1 Bayesian inference tree for the cyt-b long fragment showing the phylogenetic
relationship of all 21 Iberian rodent taxa. Posterior probabilities of major nodes are indicated. Asterisks represent posterior probabilities of 1. Outgroup: Oryctolagus
cuniculus.
152
Fig. 2 (a) Histogram of K2P cyt-b divergence values (intraspecific, interspecific within
families, interspecific among families), for the 21 Iberian rodent taxa. Microtus
duodecimcostatus and M. lusitanicus were analysed as a single taxon, Microtus DL,
due to lack of differentiation in the phylogenetic analysis. (b) Summary of pairwise divergences involving sequences of each species showing mean (pale dot) and maximum (associated dash) intraspecific divergences and mean (dark square) and minimum (associated dash) interspecific divergences (comparing sequence from the named species with other species in the same family). Grey bars characterize the extent of the barcoding gap.
153
Fig. 3 Bayesian inference tree for the IRBP long fragment illustrating the phylogenetic
relationship of the 21 Iberian rodent taxa. Posterior probabilities of major nodes are indicated. Asterisks represent posterior probabilities of 1. Outgroup: Oryctolagus
cuniculus.
155
Fig. 4 a) Histogram of K2P IRBP divergence values (intraspecific, interspecific within
families, interspecific among families), for the 21 Iberian rodent taxa. Microtus
duodecimcostatus and M. lusitanicus were analysed as a single taxon, Microtus DL,
due to lack of differentiation in the phylogenetic analysis. (b) Summary of pairwise divergences involving sequences of each species showing mean (pale dot) and maximum (associated dash) intraspecific divergences and mean (dark square) and minimum (associated dash) interspecific divergences (comparing sequence from the named species with other species in the same family). Grey bars characterize the extent of the barcoding gap; dark grey bars represent the cases where there was an overlap of intraspecific and interspecific divergences and show the extent of that overlap.
156
Fig. 5 Amplification success for the IRBP and the cyt-b gene using DNA from faecal
material. For each gene, the data is divided into ‘Trap’ and ‘Field’ depending on whether the faecal samples were collected from traps or opportunistically in the field. The data are further subdivided to show the amplification success for extractions performed with one (I), two (II) or three (III) faecal pellets.
157
FCUP xi List of tables
LIST OF TABLES:
CHAPTER 2
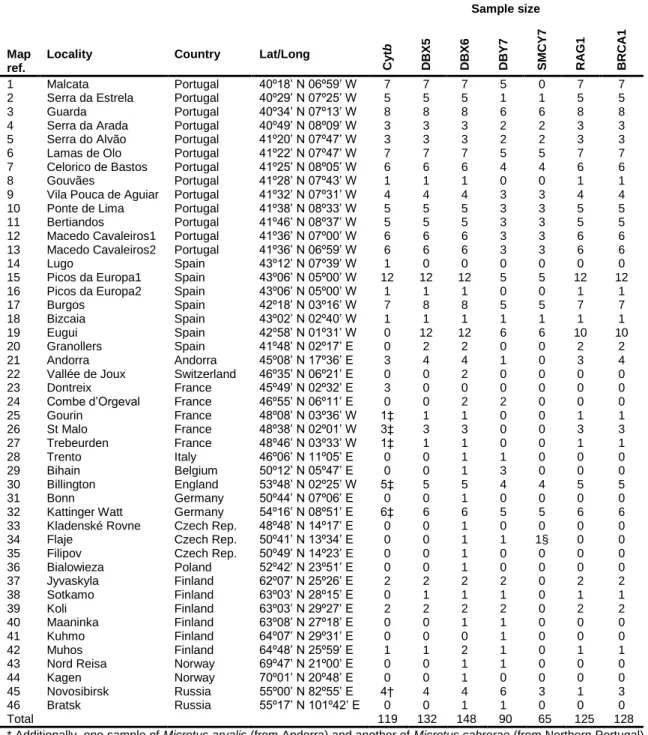
Paper ITable 1 Details of localities sampled for the field vole (Microtus agrestis s.l.) in this
study and number of samples sequenced for each locus in each locality.
35
Table 2 Species delimitation based on clocklike loci and for all loci, considering an
average theta value for all lineages (θa) of 0.0118 (see text and Table S2, Supporting information).
43
Table 3 Divergence between the three field vole lineages (standard errors based on
10 000 replicates are given in parentheses; all estimates are presented as percentages).
47
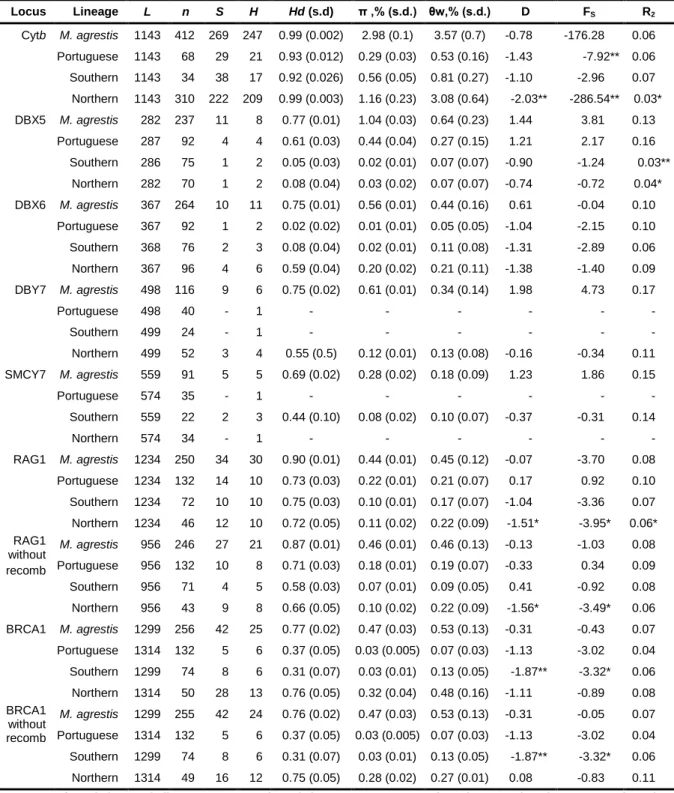
Table 4 Levels of polymorphism at each locus in the three lineages of field vole and
for Microtus agrestis s.l.
48
CHAPTER 3
Paper III
Table 1 Levels of polymorphism at each locus in both lineages of field vole. 89
Paper IV
Table 1 Effect of age, sex and of the interaction sex x age on mandible centroid size
considering the dataset of genotyped individuals (n=95).
125
Table 2 Effect of sex, lineage and of the interaction sex x lineage on the 10 shape
variables considering the dataset of genotyped individuals (n=95).
125
CHAPTER 4
Paper V
Table 1 Numbers of specimens examined for each rodent species, including number
of tissue samples used for sequencing the long fragments of the cyt-b and the IRBP genes, and number of successful amplifications of shorter fragments of these genes from faecal samples and samples of bones from owl pellets.
CHAPTER 1
FCUP 3
General introduction
1.1. SPECIATION AND SPECIES DELIMITATION
Speciation, the process by which species arise, is the force that drives biodiversity. More than 150 years has passed after the publication of Darwin’s book,
On the Origin of Species, and, although there is a large amount of literature concerning
species and speciation, understanding speciation processes still remains a major challenge for evolutionary biologists. Indeed, as Hendry (2009) has stated “In speciation, as in other fields of study, it seems that the more we know, the more we know we don’t”.
1.1.1. ‘CRYPTIC’ SPECIATION
Speciation can be considered the process of development of reproductive isolation as well as phenotypic, behavioural and molecular differences between populations through time. The differentiation process however, does not occur at all levels at the same time. Sometimes, reproductive isolation and molecular differences are observed without any perceivable morphological changes, in a process that can be referred to as ‘cryptic speciation’. ‘Cryptic species’ are forms that would previously have been described as single taxa due to the lack of visible morphological differentiation.
Probably due to the fact that most sensory information processed by the human brain is visual, morphological characteristics have been traditionally the basis of the identification and description of species. However, over the last two decades other methods for delimiting species have been developed and integrative approaches that combine morphological with molecular, ecological and developmental methods are being used (Dayrat 2005). In fact, the advances of molecular tools, has led to an exponential growth in the discovery of ‘cryptic species’, even in well studied taxonomic groups (birds: e.g. Olsson et al. 2005; bats: e.g. Ibañez et al. 2006; rodents: e.g. Gündüz et al. 2007), which has important consequences in the assessment of biodiversity and in conservation planning (Bickford et al. 2007, Pfenninger and Schwenk 2007).
Despite this boost in the detection of ‘cryptic species’ the mechanisms behind their formation are still mostly unknown. Cryptic species are mostly thought to be of recent origin, such that morphological and other traits have not yet evolved. However, there are examples of cryptic species that show apparently ancient divergences
4 FCUP
Cryptic speciation in the field vole (Microtus agrestis)
(Šlapeta et al. 2006; Bickford et al. 2007). Morphological stasis upon speciation may be also explained by directional selection on ecological, behavioural or reproductive traits that have no known morphological correlates (Bickford et al. 2007). For instance, Schröngge et al. (2002) in their study of myrmecophilous hoverflies state that specialist parasite species that exhibit behavioural or physiological adaptations to the host may be expected not to show morphological variation among species. Incongruence between genetic and morphological divergences is often also explained by convergence in morphological characters, like the ones related, for example, with feeding habitats. In a morphometric study of three taxa of bats (Myotis myotis, M.
blythi, M. punicus), Evin et al. (2008) found that although M. myotis and M. blythi were
considered sister taxa, M. myotis had a high similarity with M. punicus in skull morphology, which they interpret as morphological convergence due to similarity in feeding habits. Also, taxa that use reproductive signalling through other ways than visual may be more prone to contain cryptic species, since changes in reproductive traits do not imply morphological variation. Overall, there is still plenty to learn about ‘cryptic speciation’. It is even possible that characters previously considered of minor importance in the formation of species, will be highlighted as relevant due to the study of ‘cryptic speciation’ (Bickford et al. 2007).
Finally, although initial data suggested otherwise (Bickford et al. 2007), cryptic speciation seems to be occurring relatively homogeneously across taxa and biogeographical regions, which suggest that morphological stasis upon speciation may represent an evolutionary constant independent of phylogenetic relations or ecological circumstances (Pfenninger and Schwenk 2007).
1.1.2. CHROMOSOMES AND SPECIATION
Most animal and plant species vary greatly in their karyotypes both in the number and structure of the chromosomes. In fact, looking at the recent Atlas of Mammalian Chromosomes (O’Brien et al. 2006) we can observe a large variation in the number of chromosomes in mammals, which ranges from 6 to 102. This variation remains substantial even if we narrow it to rodent karyotypes (from 15 to 102 chromosomes; O’Brien et al. 2006). In addition to this interspecific variability in karyotypes, there are also differences in chromosome numbers and structure within species. Chromosomal races are documented in several species, from plants (e.g. Carex pachystachya, Whitkus 1988) to invertebrates (e.g. Podisma pedestris, Barton and Hewitt 1981), fish (e.g. Fundulus notatus, Black and Howell 1978), reptiles (e.g. Sceloporus grammicus,
FCUP 5
General introduction
Arèvalo et al. 1994) and mammals (e.g. Mus musculus, Nachman and Searle 1995;
Sorex araneus, Zima et al. 1996).
This diversification in karyotypes is mostly due to chromosomal rearrangements, but differences in chromosome numbers may also originate through duplication of whole chromosome sets, that is, polyploidy. Polyploidy has been considered to play an important role in plant evolution (Tate et al. 2005). However, it has been traditionally regarded as relatively unimportant in animal evolution, since it is a less frequent situation (see Otto and Whitton 2000; Mable 2004; Gregory and Mable 2005 for a review). Nevertheless it has already been reported for several vertebrates (e.g. anuran amphibians, Brunes et al. 2010; rodents, Gallardo et al. 2004). In fact, Otto and Whitton (2000) suggest that the occurrence of polyploidy may have extensively influenced the tempo and mode of evolution.
Chromosomal rearrangements, like translocations, fusions, fissions, inversions or heterochromatin additions or deletions, lead to a diversification in karyotypes and are considered likely to be important in speciation as they can contribute to reproductive isolation between populations. These chromosomal rearrangements can lead to hybrid sterility if hybrid meiosis is highly disturbed. Moreover, if the influence on hybrids is less extreme, these differences in karyotypes may still have negative effects on gene flow and therefore promote genetic divergence between populations (Searle 1998). Rieseberg (2001) considers that this reduction of gene flow may be caused by suppression of recombination in heterozygotes for the rearrangements around the position of the rearrangement.
As mentioned above, there is much variability in the karyotypes of mammals, and more specifically of rodents, both between and within species. One of the species that presents a high variability in chromosome number (due to centric fusions) is the house mouse (Mus musculus) where it has been demonstrated that the accumulation of chromosomal rearrangements may lead to reproductive isolation between populations (Piálek et al. 2005). Moreover, recent work by Lemskaya et al. (2010) that investigated the karyotypic variability of eight Microtus species and compared it with available phylogenetic information indicates that chromosomal rearrangements have played an important role in the speciation of voles.
Another striking example of karyotypic variability is the increased amount of repetitive DNA (heterochromatin) that has been detected in the chromosomes of several mammals. This variation in presence/absence and size and positioning of the heterochromatic blocks in the chromosomes has been detected both between and within species. One particularly well-studied example of this variability within species is the western hedgehog (Erinaceus europaeus) where different populations in Western
6 FCUP
Cryptic speciation in the field vole (Microtus agrestis)
Europe have large blocks of heterochromatin on different autosomes (Mandahl 1978; Searle and Erskine 1985). One other group with remarkable examples of between and within species chromosomal variability is the genus Microtus. Within this genus, several species have enlarged sex chromosomes (known as ‘giant sex chromosomes’). Other species, although not having ‘giant sex chromosomes’ show different amounts of heterochromatin on the X and Y chromosomes (Modi 1987a, Borodin et al. 1995). The most notable examples within this genus are M. cabrerae and M. agrestis, as the latter possesses the largest heterochromatin blocks on the sex chromosomes of any vole (Nanda et al. 1988; Marchal et al. 2004).
This variability and often large quantity of sex chromosome heterochromatin in
Microtus voles is associated with asynapsis of the sex chromosomes during male
meiosis, which has been confirmed in many species (Borodin et al. 1995, 2012). However, not all voles with sex chromosome asynapsis have giant sex chromosomes which indicates that this meiotic behaviour is not caused by the accumulation of heterochromatin, instead it seems that sex chromosome asynapsis may ‘allow’ for an accumulation of heterochromatin which would otherwise interfere with the meiotic process (Ashley et al. 1989; Borodin et al. 2012). Recent work suggests that X-Y synapsis at meiosis should be the ancestral condition in microtine voles (Borodin et al. 2012). However, these authors also found that X-Y synapsis has been lost independently at least three times during the evolution of microtine rodents which seems to indicate that this lack of ability of pairing by sex chromosomes does not follow any phylogenetic trend (Borodin et al. 2012).
1.1.3. GENE FLOW AND SPECIATION
As mentioned above, speciation is usually considered as a process of evolution of reproductive isolation between taxa that diverge at genetic, phenotypic and/or behavioural levels. Traditionally it was thought that this process of divergence between populations would mostly occur in allopatry (between geographically isolated populations), eventually causing the emergence of genetic incompatibilities that would prevent gene flow between the divergent taxa. However, it has been demonstrated that speciation is also possible in sympatry (without geographic separation between taxa), as Darwin had already proposed with his principle of divergence, and some putative examples are now widely accepted (Bolnick and Fitzpatrick 2007). In fact, considerable attention has recently been given in the literature to the modes and factors that facilitate the occurrence of divergence with gene flow (Bolnick and Fitzpatrick 2007;
FCUP 7
General introduction
Pinho and Hey 2010; Smadja and Butlin 2011). Even so, most biologists continue to argue that sympatric speciation is relatively rare (Hendry 2009).
When two populations become geographically isolated, genetic drift coupled with local selective pressures may lead to their differentiation. There will then be a time in this divergence process when the two populations will have differentiated to a point that, if the geographic barrier that isolates them is removed, they would not merge. Though some degree of gene flow would be possible at this point, the process of speciation would continue until full reproductive isolation would be achieved, in a process that can be considered as parapatric speciation. Nonetheless, the removal of the isolating barrier could happen at various points of the divergence process leading to an area of contact that could go from a situation of no interbreeding to one of complete admixture, which could result in two merging populations. Therefore, the study of areas where divergent taxa make contact and exchange genes - secondary contact zones - is fundamental for the understanding of speciation processes as well as for the assessment of the degree of reproductive isolation between populations.
Where there is hybridisation in secondary contact zones these are called hybrid zones (Barton and Hewitt 1985). Hybrid zones can reflect a wide variety of stages of speciation (Jiggins and Mallet 2000). Their structure depends on the degree of genetic and ecological differentiation of the hybridising populations, as well as on rates of dispersal and on the fitness of the hybrids (Harrison 1993). For instance, if the two divergent taxa interbreed in a narrow area, with a width that results from the balance between dispersal abilities of each population and of selection acting on hybrid individuals, this area of contact will represent a tension zone (Barton and Hewitt 1985). In this case, the genetic integrity of the two populations is maintained over most of the distribution area.
There are various parameters that can be estimated in a hybrid zone that are important in assessing the degree of reproductive isolation between the taxa/populations involved. For instance, the distribution of genotypic classes within a hybrid zone can be used for its classification as ‘unimodal’ or ‘bimodal’ (Jiggins and Mallet 2000). In ‘unimodal’ hybrid zones intermediate hybrid genotypes predominate, while in ‘bimodal’ hybrid zones populations consist mainly of individuals similar to the parental populations, with relatively few hybrids. However, bimodal hybrid zones also display considerable variation in the overall abundance of hybrid genotypes as well as in the relative frequency of F1 and backcross types of hybrids. For example, Arias et al. (2008) detected around 25% of hybrid individuals in mixed populations of two subspecies of the butterflies Heliconius erato, while between hybridizing populations of
8 FCUP
Cryptic speciation in the field vole (Microtus agrestis)
comparing the characteristics of unimodal and bimodal hybrid zones, Jiggins and Mallet (2000) argue that many bimodal hybrid zones show strong prezygotic isolation due to assortative mating, though postzygotic barriers to gene flow seem to be equally found in both unimodal and bimodal hybrid zones. Anyway, the detection of bimodality in a hybrid zone usually indicates that the speciation process is advanced (Jiggins and Mallet 2000).
Another feature of hybrid zones that is worth mentioning is that differential selection on different traits may lead to discrepancies in the introgression of genes. In fact, differential introgression is often related with the mode of inheritance of the genes. For example, in birds, autosomal markers usually show more introgression than maternally inherited loci in hybrid zones (e.g. Secondi et al. 2006; Martinez-Cruz and Godoy 2007). However, in mammals, mitochondrial DNA (maternally inherited) is frequently more introgressed than autosomal markers in hybrid zones, which in turn show more introgression than the Y chromosome (paternally inherited; e.g. Dod et al. 1993, Balloux et al. 2000). These differential patterns of introgression of the sex chromosomes are often related to Haldane’s (1992) rule that states that “when in the F1 offspring of the two animal races one sex is absent, rare, or sterile, that sex is the heterogametic sex”. Therefore, the loci inherited only from the heterogametic sex, which is the female in birds and the male in mammals, are expected to be less introgressed. In addition, asymmetries in introgression are often documented between populations, with the genetic traits of one population introgressing more into the other. For example, mtDNA introgresses often only in one direction, into one of the populations (e.g. Berthier et al. 2006; Alves et al. 2008; Boratyński et al. 2011). This asymmetric introgression of different genes may be caused by different factors, namely differences in population structure, fitness, cline movement or selection (Barton and Hewitt 1985). Currat et al. (2008) showed by spatially explicit simulations that massive introgression of neutral genes occurs during the invasion of an occupied territory if gene flow is not severely impeded. Actually, demographic fluctuations have been demonstrated to create patterns of substantial asymmetric introgression in three species of hares (Melo-Ferreira et al. 2005). However, the hypothesis that selection could have also favoured the massive introgression observed in hares should also not be neglected (Melo-Ferreira et al. 2007). Furthermore, it has also been demonstrated that sex biased dispersal can account for asymmetries in introgression (Petit and Excoffier 2009).
Hence, the analysis of gene flow between two divergent populations within a hybrid zone may not only help clarify the stage of the evolutionary process but also
FCUP 9
General introduction
contribute to the understanding of the demographic and selective processes that shaped speciation of those taxa.
1.1.4. SPECIES DELIMITATION
The literature on species definitions is quite extensive reflecting the long lasting debate on this subject. For some authors, species are real entities in nature, not subjective to human divisions, and have an unambiguous definition, unlike lower or higher taxonomic ranks (e.g. Coyne 1994; Coyne and Orr 2004). Others, however, agree with Charles Darwin’s view expressed in On the Origin of Species, that although species are natural groups recognised by consistent gaps (in morphology), there is a continuum with varieties within species, which do not show such gaps. In this sense, although the entities that are called species, biological groups of distinct lineages with potentially independent futures, are real, the term ‘species’ as a level of biological classification is ambiguous and amorphous, being considered a man-made grouping category developed for the ease of communication among biologists (Mallet 2008; Hendry 2009).
Apart from these different views, more than two dozen species definitions have been published and although none is unanimously accepted, one of the most frequently applied definitions is Mayr’s (1963) Biological Species Concept (BSC). According to the BSC, a species consists of a network of populations of potentially interbreeding organisms that are reproductively isolated from other such groups of populations. Reproductive isolation is clearly important in the formation and maintenance of sexually distinct taxa; however, often taxa that can and do hybridise are recognizable as different from morphological, genetic, behaviour and ecological data (Mallet 2008). Actually, some estimates state that about 25% of all plant species and 10% of all animal species hybridise successfully with at least one other species (Hendry 2009). This contributes to the fact that, at present, most evolutionary biologists rely on a more relaxed BSC, considering that different groups are considered different species if they can maintain their genetic integrity in nature, that is if they can remain distinct, which goes along with the ideas expressed by Darwin (Mallet 2008; Hendry 2009).
Regardless of the species definition considered, delimiting species boundaries is an important task in the context of understanding many evolutionary mechanisms and processes and in biodiversity assessments. In fact, the recognition of nascent
10 FCUP
Cryptic speciation in the field vole (Microtus agrestis)
divergent lineages and the designation of Evolutionarily Significant Units (ESU, Moritz, 1994), which might even be later considered as different species, are fundamental in the definition of priorities for biodiversity conservation and management.
In the last decade, species delimitation has emerged as a major topic in modern systematics. Several methods have been proposed, which handle different types of information (morphological, genetic, geographical, or a combination) and are applicable to different situations (e.g. bisexual taxa vs bisexual and asexual taxa; Sites and Marshall 2003; Wiens 2007). However, as these authors mention, most of the methods developed are strongly based on the use of genetic markers and although some highlight the need of corroboration with other types of information, only few methods explicitly include morphological data. In fact, molecular data has become a very important tool for the purpose of species delimitation. Among the different methods described, some focus on the inference of the presence/absence of gene flow, while others rely on the congruence of phylogenetic tree topologies (e.g. monophyly, concordance with geography, concordance with morphology; Sites and Marshall 2003). Indeed, multilocus sequence data in a coalescent framework, involving newly developed theoretical models can be a particularly powerful way to identify recently diverged species (Yang and Rannala 2010). Moreover, novel approaches that model the membership of individuals to evolutionary lineages have also been described (Yang and Rannala 2010; Ence and Carstens 2011; O’Meara 2010). More recently, a new method that analyses georeferenced phenotypic and genetic data under a unified model and inference framework has been developed, opening the way to robust comparisons between different types of data and possibly combined analyses (Guillot
et al. 2012).
1.2. MOLECULAR TOOLS
As described above, molecular data has become a fundamental tool in species delimitation and in the study of speciation. In fact, the analysis of multiple genetic markers is nowadays considered to be of primary importance in the study of the evolutionary history of species.
The first phylogeographic studies were mostly based in the analysis of the mitochondrial DNA (mtDNA). This is a highly abundant molecule in the cell, which is easily extracted and analysed. MtDNA has a set of characteristics that makes it very popular in evolutionary and population genetic studies, namely its high mutation rate,
FCUP 11
General introduction
the absence of recombination in most animal species (though there are studies suggesting otherwise, Tsaousis et al. 2005), and the fact that it is maternally inherited and haploid in transmission (Avise 1989).
However, there are also some problems associated with the analysis of mtDNA. There are several taxa where non-functional nuclear copies of mitochondrial genes have been found (pseudogenes or numts; reviewed in Zhang and Hewitt, 1996; Benasson et al. 2001) and although these numt sequences are valuable by themselves in evolutionary studies (e.g. Triant and DeWoody 2008), if undetected, they can also confound phylogenetic and population genetic studies based on mtDNA (Zhang and Hewitt 1996; Dubey et al. 2009). Moreover, the effective population size of mtDNA is only a quarter that of nuclear autosomal loci, which implies that mtDNA has a faster lineage sorting and a higher allele extinction rate, and can lead to oversimplification of evolutionary relationships and underestimation of genetic diversity (Zhang and Hewitt 2003). Furthermore, the sole analysis of mtDNA corresponds effectively to the study of a single locus, and as such, has some widely recognised limitations. It is well documented that individual gene trees are often different from the underlying species tree. In fact, discordance between mitochondrial and nuclear phylogenies is quite common and it can be attributed to mitochondrial introgression (e.g. Boratyński et al. 2011; Melo-Ferreira et al. 2012) as well as the retention and incomplete sorting of ancestral polymorphisms, especially in the cases of recently diverged species or populations (Avise et al. 1983; Tajima 1983; Pamilo and Nei 1988; Maddison 1997).
Thus, as an organism comprises many genes, it is important to analyse several different genealogies in order to adequately describe the organism phylogeny. Indeed, complex evolutionary processes that shape the patterns of genetic variation in animal populations can only properly be addressed through the use of several independent markers, as has been demonstrated in several studies (e.g. Godinho et al. 2008; Melo-Ferreira et al. 2012).
Genetic data is nowadays easily and rapidly attainable, allowing for the assembly of large datasets that provide high resolution. Furthermore, several sophisticated statistical methods that analyse complex datasets, and integrate data from multiple loci have been developed recently (e.g. Heled and Drummond 2010; Hey
et al. 2010). It is therefore expected that all these new methods and technological
advances will greatly contribute to our understanding of the field of evolutionary biology and population and conservation genetics.
12 FCUP
Cryptic speciation in the field vole (Microtus agrestis)
1.2.1. NONINVASIVE GENETICS
The first studies using noninvasive genetic sampling were two decades ago (Höss et
al. 1992; Taberlet and Bouvet 1992) and since then major technological advances have
been made in this area (Beja-Pereira et al. 2009).
Noninvasive approaches allow genetic studies of wild populations without the need to capture or even observe the animals, providing the opportunity to answer questions that cannot be addressed using traditional molecular methods (Taberlet et al. 1999). Noninvasive methods are particularly helpful in the study of rare and elusive species under conservation threat. Most of the studies published using these techniques refer to mammals (Beja-Pereira et al. 2009). In fact, many mammalian species have elusive behaviour, being difficult to observe and therefore to study directly. Putman (1984), some years before the first noninvasive genetic studies, had already highlighted the value of dung as ‘the most readily-available and easily collected source of information’ for field mammalogists looking for observational data on their elusive study species. Furthermore, given that many mammalian populations are declining (thus increasing the difficulty of direct observations) and that direct methods of capture and handling can be expensive and even harmful to the individuals, the use of these noninvasive techniques has great value, allowing for the collection of data on the distribution, demography and life-history information of those species (Kohn and Wayne 1997). These techniques are also considered valuable even on abundant species, since they facilitate the implementation of large scale studies and allow for the collection of data without altering the dynamic of populations in ways that are difficult to predict (Kohn and Wayne 1997).
Several types of noninvasive sample have been used for molecular analysis (faeces, hairs, urine, feathers, bones, etc.) with faeces being the most commonly used type of sample (see Beja-Pereira et al. 2009 for a review). In molecular studies of small mammals, however, in addition to faecal samples, bones from barn owl pellets are also widely used (e.g. Taberlet and Fumagalli 1996; Poulakakis et al. 2005). The majority of the studies using noninvasive genetic sampling focus on individual identification, wildlife forensics, assessment of population genetic parameters and on studies of mating systems and behavioural ecology.
Though some concern has been expressed about the shortcomings of noninvasive genetic methods, namely related with low success rates, contamination problems and genotyping errors rates (Taberlet et al. 1999; Waits and Paetkau 2005), recent advances have led to the development of techniques that provide good enough