DOCUMENTOS DE TRABALHO
WORKING PAPERS
ECONOMIA
ECONOMICS
Nº 02/2008
LOOKING FOR A BREAK IN SPANISH INFLATION DATA IN
THE EARLY EIGHTIES AND ASSESSING PERSISTENCE
Maria Teresa Mota
Universidade Católica Portuguesa (Porto)
Mariana Alves da Cunha
Universidade Católica Portuguesa (Porto)Carlos Santos
Looking for a break in Spanish Inflation Data in the early eighties and
assessing persistence
Maria Teresa Mota
Mariana Alves da Cunha
Carlos Santos
1Faculdade de Economia e Gestão, Universidade Católica Portuguesa and CEGE
ABSTRACT
Using the Bai-Perron test, we look for a shift in the conditional mean of an AR
representation of Spanish CPI inflation over the period: 1978-2006. It is clear
that Spain, as most OECD economies, experienced an inflation slowdown in the
early eithgties, which can be related to some policy measures undertook by the
government coming out of the 1982 elections. It is shown, that when the break is
accounted for, there are no signs of persistence in Spanish CPI inflation.
JEL Codes: E31; E65; C12; C22
Keywords: inflation persistence; structural breaks; monetary policy
1
Corresponding author: csantos@porto.ucp.pt Prof. Dr. Carlos Santos
Faculdade de Economia e Gestão, Universidade Católica Portuguesa Rua Diogo Botelho, 1327
4169-005 Porto Portugal
1
1. INTRODUCTION
The inflation persistence research network has produced a plethora of evidence against the hypothesis that high inflation persistence would be an intrinsic fact in industrialized economies. Notwithstanding, dispute has remained as to the exact location of breaks, due to the usage of a variety of tests in different studies. Furthermore, evidence has clearly accumulated more quickly for some countries than for others (see, inter alia, Oliveira and Santos (2007) and Santos and Oliveira (2007)).
There are relatively few studies of persistence in inflation in Spain when compared to, say, the French case. In this paper, we suggest using a standard Bai-Perron2 (1998, 2003) testing procedure to assess persistence in Spanish Consumer Price Index (CPI) inflation. The results are to be compared against those of Papadopoulos and Sidiripoulos (2003), who use a version of Perron’s (1997) test.
The methodology used here is similar to the one employed by Papadopoulos and Sidiripoulos (2003) and by Oliveira and Santos (2007) and Santos and Oliveira (2007), in that it mimics much of the Inflation Persistence Network3 (IPN) methodology: an AR representation for inflation is found and breaks in the constant of the AR process are tested for in a location-scale model4. As suggested by Andrews and Chen (1994), the sum of the autoregressive coefficients is our purposed measure of persistence (see Marques, 2004, for a debate on different measures of persistence).
The objective of this paper is therefore threefold: one the one hand, we wish to check whether or not inflation has been persistent in Spain; secondly, we are interested in determining break
2
Carlos Santos wishes to thank Jack Luchetti for the development of an Ox code to perform the Bai-Perron test.
3
See Santos and Oliveira (2007) for more on the Inflation Persistence Network.
4
The Bai-Perron test cannot be performed with lagged variables when there is autocorrelation in the data, as acknowledged by the authors (Bai and Perron, 2003).
2 dates with a more standard method than the one used by the aforementioned authors; finally, we are also interested in relating the findings of this paper to events in Spanish Economic History, in order to determine whether or not the results of the Bai-Perron test are reliable in this particular data set.
The structure of the paper is as follows: section 2 describes the data to be used; section 3 applies the Bai and Perron (1998, 2003) test to Spanish CPI inflation data; section 4 compares our findings with those of the benchmark study of Papadopoulos and Sidiripoulos (2003); section 5 suggests a congruent AR representation of Spanish inflation and assesses persistence. Section 6 concludes.
2. Data
The sample period comprises the years from 1978 to 2006. It consists of yearly CPI Spanish inflation data obtained from the World Bank series. The sample period was chosen bearing in mind the comparison with the study of Papadopoulos and Sidiripoulos (2003) (the authors have used monthly data from 1980 to 1999). Furthermore, data from earlier in the 70’s might reveal effects from the first oil shock, which we have chosen to leave out of this analysis (in a similar choice to that made by, inter alia, Levin and Piger, 2004). Figure 1 plots the data used in this paper.
<insert figure 1 about here> 3. Bai-Perron Test Results
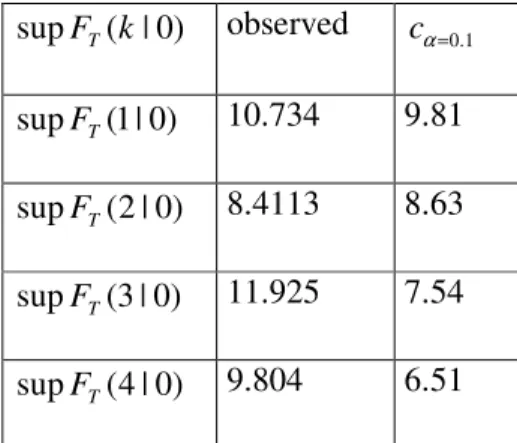
Results from the Bai and Perron (1998, 2003) test are reported in the following tables5. In particular, table (1) reports the results of the supFT(k|0) test, k =1, 2, 3, 4 . That is, a maximum of 4 breaks is allowed. The choice of maximum number of breaks is not irrelevant in the Bai-Perron test. Bai and Perron (2003) discuss the need to loose some observations in order to obtain a better non-parametric HAC variance estimate. A trimming factor ε =0.05is
5
The Ox code to implement the Bai-Perron test was written with the invaluable help of Jack Luchetti, and is available upon request.
3 suggested in Bai and Perron (1998), but the authors’ 2003 paper acknowledges that a higher trimming factor might be needed for small samples with serial correlation. Santos and Oliveira (2007) discuss this issue in detail.
For practical purposes, the choice of a maximum number of breaks of M = 4 (allowing for, at most, 5 inflation regimes in the sample period) was combined with a trimming factor of
0.15
ε = , allowing for a minimum distance of 4 years between consecutive breaks. This is more demanding than the trimming factor used in Santos and Oliveira (2007): the minimum distance, with quarterly data, was set at 12 in that paper.
<insert table 1 about here>
From table 1, it is straightforward to conclude that there is statistical evidence to reject the null of no breaks against the alternative of 1 break, at a 10% critical level. Clearly, supFT(1| 0)exceeds cα=0.1. Table (2) shows that the UDmax and the WDmax test statistics
confirm this finding even at a 5% critical level (Bai and Perron, 2003, had acknowledged the possibility of conflicting evidence between these test statistics). In conclusion, we are on safe ground when claiming that there is at least one break in the data. For the model with one break, the Ox 5.0 (Doornik, 2007) routine suggests 1982 as the break point, with sum of squared residuals of 22.0829.
<insert table 2 about here>
The natural question then becomes: what is the estimated number of breaks? Following the authors’ advice we use the supF lT( +1| )l statistic to address this issue. Table (3) reports the
results, using the sequential bottom-up procedure.
<insert table 3 about here>
Table 3 provides support for the claim that, even at 10% significance level, there is no evidence of further breaks in the data. In fact, the output from the Ox 5.0 routine suggests [1980:1984] as the 90% confidence interval for the break date. The middle point is clearly
4 1982. Notwithstanding, as argued by Bai and Perron (2003), these confidence intervals are not necessarily symmetric around the break date estimate.
In conclusion, we shall argue in favour of the existence of a break in 1982 in Spanish yearly CPI inflation data, when considering the period 1978-2006, using the Bai-Perron test for multiple breaks at unknown dates.
4. Comparison with other studies
As argued before, the IPN did not produce as many studies for Spain as it did for other countries (namely for France). Nonetheless, Papadopoulos and Sidiripoulos (2003) using Perron’s (1997) earlier sequential test for a break in the conditional mean, found two breaks between 1980 and 1999: one located in February of 1984 and another in November of 1996. However, a number of Spanish authors would argue that 1982 was indeed the key to understanding the change in Spanish economic policy history (Sequeira, 2001). In particular, Prados de la Escosura and Sanz (1996) argue that restrictive monetary policy measures had been undertaken in Spain since 1977, with the goal of driving inflation to stable and low levels. Furthermore, the fiscal system had changed by the late 70’s towards a more progressive income taxation regime. At the same time, wage growth was kept at moderate levels. Futhermore, the 1982 general elections led to a deepening of all of these reforms, in particular to an even tighter monetary policy. Adding to this, financial markets liberalization was reinforced, and Spain became more open to foreign trade (increasing price competition in the domestic market). In short, it does not seem to be the case, as argued by Papadopoulos and Sidiripoulos (2003) that only in 1984 were the Spanish monetary authorities committed to a stable inflation policy. Inflation stabilization started years before, with the goal of allowing the entrance of the Spanish Peseta in the European Monetary System.
5 We would suggest that figure 1 makes a strong case for a break in 1982 instead of 1984. Notwithstanding, it is probably the case that the sample the authors are working with (starting at 1980), combined with the trimming factor implied in Perron’s (1997), test are such that the number of observations required for a break have not been obtained until 1984, rendering the method useless to find the 1982 break. Indeed the problem with trimming factors and small samples has led to the development of a different class of break tests based on impulse saturation (Santos, 2008; Santos and Hendry, 2006).
5. Modelling Spanish CPI inflation
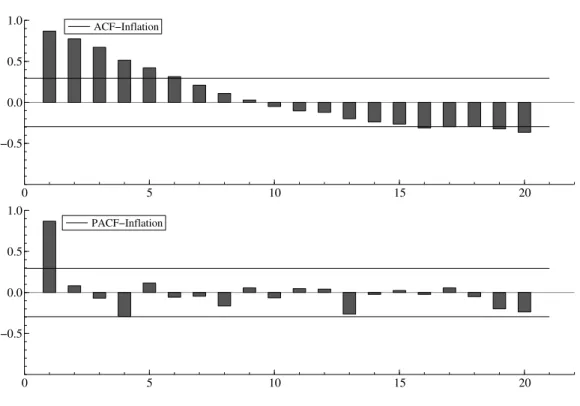
We have used PcGive 12.0 (Doornik and Hendry, 2007) to provide an answer to the challenge of building a congruent AR representation of Spanish CPI inflation over the sample period. At the same time, we were looking to assess persistence in inflation once the 1982 break had been accounted for by means of a step dummy. Figure (2) plots the autocorrelation and the autocorrelation functions, clearing providing support for the claim that Spanish inflation can be modelled as an AR(1) process over the sample period.
<insert figure 2 about here>
Equation (1) reports the estimated model. The variable “step” had been defined as 1 from 1978 to 1982 and 0 afterwards. As it can be seen, both the constant, the lagged inflation and the indicator variable are statistically significant at 5% (estimated standard errors between brackets).
1
(0.376) (0.05621) (0.8579)
ˆt 1.09518 0.722829 t 1.8749stept
π = + π − + (1)
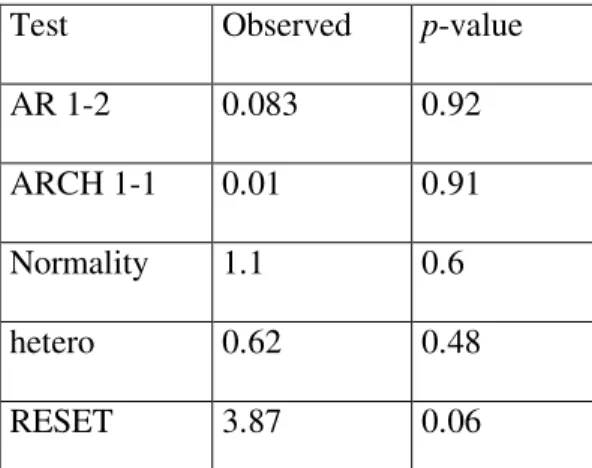
Tables (4) and (5) report the results of a plethora of diagnostic tests. Table (4) refers to Hansen’s (1992) stability tests, and it can be seen that null of stability is never rejected for individual parameters, for joint parameters or for the variance. Table (5)6 allows us to conclude that there are no signs or autocorrelation, ARCH effects, nonnormality,
6
In table 5, AR stands for the Breusch-Godfrey autocorrelation test (Breusch (1978) and Godfrey (1978)), ARCH stands for Engle’s (1982) test and RESET stands for Ramsey’s (1969) test for mis-specification errors. The normality test used is the one suggested by Hansen and Doornik (1994), whilst White’s (1980) test without cross-products is used to check homoscedasticity.
6 heteroscedasticity or mis-specification. In short, we have achieved in equation (1) a congruent representation of Spanish CPI inflation over the sample period (see Hendry, 1995, for a discussion on congruence).
Equation (1) further allows us to conclude that there are no signs of persistence in Spanish CPI inflation. In fact, Andrews and Chen’s (1994) measure of persistence would be 0,72, well below a unit root7.
6. Conclusion
In this paper we have used Bai and Perron’s (1998) test to find structural breaks in Spanish CPI inflation data. A break was found in 1982 and economic policy reasons were suggested to justify the claim that this was a reasonable break date estimate. Furthermore, the step dummy constructed on the basis of this break date estimate allowed us to build a univariate AR congruent representation of Spanish Inflation, and to conclude that there are no signs of persistence in the sample period. Such information is deemed to be relevant as there are relatively few studies of persistence in Spanish inflation in the IPN network, and because it further reinforces the belief that the findings of Pivetta and Reis (2007), with respect to a unit root in inflation, are specific to the US and to the sample period they have covered: unit roots in inflation are by no means a generalized fact among OECD economies.
REFERENCES
Andrews, D. K. and Chen, H.-Y. (1994) Approximately Median Unbiased Estimation of Autoregressive Models, Journal of Business and Economics Statistics, 12, 187-204.
Bai, J. and Perron, P. (1998) Estimating and Testing Linear Models with Multiple Structural Changes, Econometrica, 66, 47-78.
Bai, J. and Perron, P. (2003a) Computation and Analysis of Multiple Structural Change Models, Journal of Applied Econometrics, 18, 1-22.
Breusch, T. S. (1978) Testing for Autocorrelation in Dynamic Linear Models, Australian
Economic Papers, 17, 334-355
Doornik, J. A. (2007) OX, An Object Oriented Matrix Programming Language, 5th edition, London: Timberlake Consultants Press.
7
Results not reported here for space constraints reveal that the null of a unit root is rejected when a likelihood ratio-based test is used for a canonical representation of type 2, at a 5% critical level.
7 Doornik, J. A. and Hendry, D. F. (2007) Empirical Econometric Modelling with PcGive12, London: Timberlake Consultants Press.
Engle, R. (1982) Autoregressive Conditional Heteroscedasticity with Estimates of the Variance of United Kingdom Statistics, Econometrica, 50, 1, 987-1007.
Godfrey, L. (1978) Testing Against General Autoregressive and Moving Average Error Models when the Regression Includes Lagged Dependent Variables, Econometrica, 46, 1293-1302
Hansen, B. E. (1992) Tests for Parameter Instability in Regressions with I(1) Processes,
Journal of Business and Economic Statistics, 20 (1), 45-59.
Hansen, H. and J. A. Doornik (1994) A Practical Test for Univariate and Multivariate Normality, Nuffield College Discussion Papers, Oxford.
Hendry, D. F. and Santos, C. (2006) Saturating Autoregressive Models, Notas Económicas, 24, 9-19.
Hendry (2005) Dynamic Econometrics, Oxford: Oxford University Press.
Levin, A. and Piger, J. (2004) Is Inflation Persistence Intrinsic in Industrial Economies?, Working Paper 334, European Central Bank.
Marques, C. R. (2004) Inflation Persistence: Facts or Artefacts, Working Paper 371, European Central Bank.
Oliveira, M. A. and Santos, C. (2007) Looking for a change point in French Monetary Policy in the Early Eithgties, Applied Economics Letters, Forthcoming.
Papadopulos, A. P. and Sidiropoulous, M. (2003) Central Bank Independence, Exchange Rate Policy and Inflation Persistence: Empirical Evidence on Selected EMU countries, University of Crete, Department of Economics Working Papers 0107
Perron, P. (1997) Further Evidence on Breaking Trend Functions on Macroeconomic Variables, Journal of Econometrics, 80, 355-385
Pivetta, F. and Reis, R. (2007) The Persistence of Inflation in the United States, Journal of Economics Dynamics and Control, 31 (4), 1326-1358.
Prados De La Escosura, L. and Sanz, J. C. (1996), “Growth and Macroeconomic performance in Spain, 1939-93” em Economic Growth in Europe since 1945, Crafts e Toniolo, eds, Cambridge University Press, Cambridge, UK, pp.355-387
Ramsey, J. B. (1969) Tests for Specification Errors in Classical Linear Least Squares Regression Analysis, Journal of the Royal Statistical Society, series B, 31, 350-371
8 Santos, C. and Oliveira, M. A. (2007) Assessing French Inflation Persistence with Impulse Saturation Break Tests and General-to-Specific Modelling, Applied Economics, Forthcoming. Sequeira, T. (2001) Crescimento Económico no Pós Guerra, os casos de Espanha, Portugal e Irlanda, Textos para Discussão, DGE-05/2001
White, H. (1980) A Heteroscedasticity Consistent Covariance Matrix Estimator and a Direct Test of Heteroscedasticity, Econometrica, 48.
9 TABLES: ) 0 | ( supFT k observed cα=0.1 ) 0 | 1 ( supFT 10.734 9.81 ) 0 | 2 ( supFT 8.4113 8.63 ) 0 | 3 ( supFT 11.925 7.54 ) 0 | 4 ( supFT 9.804 6.51
Table 1: Bai-Perron supFT(k|0) test for 1 break: observed test statistic and 10% critical values
Test Observed cα=0.05 UDmax 11.9248 11.7 WDmax 16.361 13.83
Table 2: Further evidence on one break −: Dmax and WDmax observed statistics and 5% critical values ) | 1 ( supFT l+ l Observed 1 . 0 = α c ) 1 | 2 ( supFT 2.59936 9.81 ) 2 | 3 ( supFT 7.53441 11.4 ) 3 | 4 ( supFT 3.51588 12.29
Table 3: supFT(l+1|l) using global optimizers under the null −: observed test statistics; 10% critical values;
10 Instability tests Observed statistics Variance 0.44 Joint 0.89 Constant 0.08 1 t π − 0.16 Step 0.06
Table 4: Hansen’s Stability Tests for model (1): observed statistics Test Observed p-value
AR 1-2 0.083 0.92
ARCH 1-1 0.01 0.91
Normality 1.1 0.6
hetero 0.62 0.48
RESET 3.87 0.06
11 FIGURES 1980 1985 1990 1995 2000 2005 2.5 5.0 7.5 10.0 12.5 15.0 17.5 20.0 Inflation
Figure 1: Spanish yearly CPI inflation (World Bank data)
0 5 10 15 20 −0.5 0.0 0.5 1.0 ACF−Inflation 0 5 10 15 20 −0.5 0.0 0.5 1.0 PACF−Inflation