EFFECTS OF MESSAGE DESIGN AND CONTENT
ON THE PERFORMANCE OF EMAIL
MARKETING CAMPAIGNS
Ana Teresa Neves de Carvalho
Dissertation submitted in partial fulfillment of the requirements for the degree of MSc in Business Administration at Católica-Lisbon School of Business & Economics
ADVISORS: Ana Isabel Almeida Costa, Fernando Santos Jorge June 2014
ABSTRACT
With the evolution of digital technologies, new ways of carrying out marketing communication activities have emerged. For most businesses today, the Internet is the cheapest and most effective means of reaching broader audiences, target specific market segments and guide individual consumers to the last stages of their decision making journey.
Meanwhile, the development of online advertising activities such as promotional emails, display ads and social networks brought about new opportunities and challenges. Emailing, in particular, is both the number one activity of Internet users and the most prevalent form of online marketing. Email marketing campaigns are cheap, fast, highly targetable and highly customizable, and are thus claimed to generate twice as much the return on investment of other online advertising media.
Marketers are thus now better equipped to monitor campaign progress, continuously adapt their messages according to audience response and measure their returns on advertising investment. But such developments still share the same crucial challenge with traditional marketing activities: How to get viewers to pay attention and respond to promotional messages in the desired way?
The ability of email marketing to produce leads and sales depends, to a large extent, on email ad messages’ potential to generate high click-through rates. These, in turn, are claimed to be highly affected by message design features. Yet, extant studies have produced little evidence of such design effects.
In view of this, the main aim of the present dissertation was to evaluate the effects of message design features on the effectiveness of email marketing campaigns. To this end, 43 email marketing campaigns were analyzed. Quantitative information about each campaign was analyzed with statistical means.
The results of secondary data analysis and A/B test performance showed significant positive effects of the number of words and the presence of an explicit call-to-action in a message on CTR. Under the light of extant literature, which suggested opposite effects for written message size, these results indicate that although additional information may be an important factor of persuasiveness at a later stage, it actually works as an attention deterrent when email messages are first opened.
SUMÁRIO
Com a evolução das tecnologias digitais, surgiram novas formas de execução de atividades de comunicação. Hoje em dia, para a maioria dos negócios, a Internet é a mais barata e eficiente forma de alcançar audiências mais vastas e conduzir os consumidores aos últimos passos da tomada de decisão.
Por sua vez, o desenvolvimento das atividades de publicidade online, tais como, emails promocionais, exibição de anúncios online e redes sociais trouxeram novos desafios e oportunidades. Enviar emails é a atividade número um na Internet e a mais predominante forma de marketing online. As campanhas de email são baratas, rápidas, fáceis de se definir o público alvo e facilmente customizáveis, capacitando assim duas vezes mais retorno ao investimento do que qualquer outro meio de publicidade online.
Os marketeers estão, agora, melhor equipados para monitorizar o progresso contínuo das suas campanhas e adaptar o seu conteúdo à resposta da audiência e medir o retorno do seu investimento. Mas tais desenvolvimentos partilham do mesmo desafio que os meios mais tradicionais: Como podem os utilizadores prestar mais atenção e responder da forma mais desejada às mensagens promocionais?
A capacidade das campanhas de email marketing gerarem conversões e vendas depende, em larga escala, no potencial destas mensagens produzirem um elevado CTR. Isto, por sua vez, é muito afetado pelas características de design das mensagens. No entanto, os estudos recentes revelaram pouca evidência dos efeitos do design.
Deste modo, o principal objetivo desta dissertação prende-se com perceber como os efeitos das características de design na eficiência das campanhas de email marketing. Com este fim, 43 campanhas de email marketing foram analisadas. Informação quantitativa acerca de cada campanha foi estatisticamente analisada.
Os resultados obtidos com a análise dos dados secundários e testes A/B mostraram efeitos significativamente positivos do número de palavras e na presença de um botão call-to-action no CTR de uma mensagem de email marketing. De acordo com a literatura existente, que sugere que mensagens maiores têm um impacto mais positivo na eficiência dos emails, quando as mensagens de email são abertas pela primeira vez, este pode ser um elemento de distração.
ACKNOWLEDGEMENTS
This thesis is the last stage of my academic life. There were challenges, moments of stress, demotivation, setbacks and other sad issues during this path. However, I had the pleasure of having in my life very important people that helped me overcome these problems, and keep the motivation high.
First, to my parents Luis Carvalho and Anabela Neves, to my older brother Gonçalo Carvalho, to my friends Rita Soares, Ana Marcelino, Catarina Amorim and Joana Oliveira a big thank you for all the support you gave me through all the stages that I surpassed.
Secondly, I thank my best friend Tomás Alves for every single day since the first day of the Undergraduate degree until this last stage of my Master degree. You have been a source of help, motivation and persistence.
Thirdly, I express my thankfulness to Professors Ana Isabel Almeida Costa and Fernando Santos Jorge for their valuable academic contribution, constant availability, dedication and friendship, which are all crucial for a good performance.
Lastly, I must thank Revshare employees’ for their perseverance and patience providing the crucial inputs for the elaborations of this thesis.
2 TABLE OF CONTENTS CHAPTER 1: INTRODUCTION ... 7 1.1 Background ... 7 1.2 Problem statement ... 10 1.3 Aim ... 11 1.4 Scope ... 11 1.5 Research method... 11
1.6 Academic and managerial relevance ... 12
1.7 Dissertation Outline ... 12
CHAPTER 2: LITERATURE REVIEW AND CONCEPTUAL FRAMEWORK ... 14
2.1 Advertising ... 14
2.1.1 Advertising in digital media ... 16
2.1.2 Advertising through email ... 16
2.2 Email message components ... 19
2.2.1 Structure ... 20
2.2.2 Format ... 21
2.2.3 Source ... 22
2.3 Metrics for evaluating the efficacy of promotional email marketing campaigns ... 22
2.4 Conclusions and research hypotheses ... 24
CHAPTER 3: METHODOLOGY ... 26 3.1 Research Approach ... 26 3.2 Secondary Data ... 27 3.2.1 Design Variables ... 29 3.2.2 Content Variables ... 29 3.2.3 Control Variable ... 31 3.2.4 Dependent Variable ... 32
3.3 Preliminary Data Analysis ... 33
3.3.1 Secondary Data ... 33
3.3.2 Primary Data ... 34
CHAPTER 4: RESULTS AND DISCUSSION ... 36
4.1 Secondary campaign data ... 36
4.1.1 Results of the univariate descriptive analyses ... 36
3
4.2 Primary Data Analysis – A/B Testing ... 39
4.2.1 Results of the univariate descriptive analyses ... 39
4.2.2 Cross-Tabs analyses ... 39
4.3 Summary and discussion of the statistical analyses results ... 40
4 TABLE OF FIGURES
FIGURE 1.1 – DO US BUSINESSES BELIEVE THAT ONLINE MEDIA PRODUCE A GOOD ROI? BY
RETAILDIVE... 11
FIGURE 1.2 - US BUSINESSES’ ADVERTISING SPENDING PLANS FOR 2014 BY RETAILDIVE. ... 11
FIGURE 2.1 – STUDY ABOUT THE EFFECTIVENESS OF EMAIL MARKETING, MARKETINGSHERPA’S (2012). ... 21
FIGURE 3.1 – GRAPHIC SHOWING THE DISTRIBUTION OF CLICKS FOR ONE ALREADY LAUNCHED CAMPAIGN, DURING THE FIRST 18 DAYS. ... 31
FIGURE 3.2 – GRAPHIC SHOWING THE NUMBER OF CAMPAIGNS THAT HAVE WORDS ON EACH INTERVAL.. ... 33
FIGURE 3.3 – EXAMPLE OF THE PART OF THE MESSAGE WHERE IS THE NUMBER OF WORDS THAT WERE COUNTED ... 33
FIGURE 3.4 – EXAMPLE OF THE TEXT THAT WAS NOT TAKEN INTO ACCOUNT ... 33
FIGURE 3.5 – IMAGES OF A CAMPAIGN PRESENTING THE HOTSPOTS. ... 35
FIGURE 3.6 – SCHEME OF THE DIVISION OF A MESSAGE IN POSITIONS (LEFT), AN EXAMPLE OF A CAMPAIGN DIVIDED WITH ITS RESPECTIVE HOTPOTS (MIDDLE) AND THE POSITION OF CALL-TO-ACTION (RIGHT). ... 36
FIGURE 3.7 – VERSION A OF A/B TEST: 1-30 WORDS. ... 37
FIGURE 3.8 – VERSION 2 OF A/B TEST: 81-150 WORDS. ... 38
FIGURE 4.1 – FREQUENCIES OF THE NUMBER OF COLORS. ... 40
5 TABLE OF TABLES
TABLE 1.1 - TYPES OF EMAIL MARKETING (SATHISH ET AL., 2011). ... 12
TABLE 2.1 - IMPORTANCE OF EMAIL MARKETING AND SOME OF ITS FACTORS THAT INFLUENCE CTR. ... 17
TABLE 2.2 - DECISION MAKING MODEL OF ADVERTISING (MACKAY, 2005; BARRY, 1990). ... 18
TABLE 2.3 - ONLINE ADVERTISING FORMATS AND EXAMPLES FOR EACH (LORRIE, 2011)... 19
TABLE 2.4 - ADVANTAGES AND DISADVANTAGES OF EMAIL MARKETING (MCCORMICK AND MEDIA, 2013). ... 20
TABLE 2.5 - MAIN EMAIL MESSAGE COMPONENTS (HUBSPOT, 2012). ... 22
TABLE 2.6 - MESSAGE PROCESSING DEPENDS ON THE LEVEL OF INVOLVEMENT OF CONSUMERS (CLOW AND BAACK, 2013). ... 22
TABLE 3.1 - PRESENTATION OF THE MEASURE USED BY THE PLATFORM TO CALCULATE EACH VARIABLE. ... 31
TABLE 3.2 – BENCHMARKED VALUES FROM MAILCHIMP, 2012 ... 34
TABLE 3.3 – CHOSEN VARIABLES FOR THE LINEAR REGRESSION. ... 36
TABLE 4.1 – DESCRIPTIVE STATISTICS REGARDING THE POSITION OF THE HOTSPOTS, CTR AND THE NUMBER OF HOTSPOTS, PER CAMPAIGN (N=43). ... 39
TABLE 4.2 – DESCRIPTIVE STATISTICS REGARDING THE NUMBER OF WORDS, PER CAMPAIGN (N=43). ... 40
TABLE 4.3 – UNSTANDARDIZED BETAS AND SIGNIFICANCE OF INDEPENDENT VARIABLES ON THE DEPENDENT VARIABLE. ... 41
TABLE 4.4 – MAIN INDICATORS OF THE REGRESSION’S MODEL QUALITY... 41
TABLE 4.5 – DESCRIPTIVE STATISTICS OF A/B TESTING. ... 42
6 TABLE OF ANNEXES
ANNEX 1 – EXAMPLES OF DIFFERENT TYPES OF EMAIL MARKETING. ... 45 ANNEX 2 – INFORMATION REGARDING THE SEND DATA AND DATABASE VOLUME OF EACH CAMPAIGN ANALYZED. ... 48 ANNEX 3 – EXAMPLE OF ONE E-MAIL MARKETING CAMPAIGN. ... 49 ANNEX 4 – FLOW CHARTS CONCERNING THE THREE DIFFERENT PROCESSES THAT MAY BE FOLLOWED TO SEND AN EMAIL MARKETING CAMPAIGN. ... 50
7 CHAPTER 1: INTRODUCTION
1.1 Background
Technology development enabled the distinction between two main forms of marketing communication: traditional and digital. Traditional communication, or outbound marketing, typically employs broadcasting media like TV, radio and printed media, which reach many customers simultaneously (Rust and Oliver, 1994), but are costly and not amenable to individual targeting or interaction (Bezjian-Avery et al., 1998). The effectiveness of traditional advertising media is thus hard to measure and returns on advertising investment can be fairly modest (Chao et al., 2012). Digital marketing communication, or inbound marketing, on the other hand, employs mainly online media, such as websites, display ads, commercial emails, online catalogues, search engine marketing and videos. These also have a very broad reach, but display considerably lower set-up costs than traditional media. Moreover, being highly interactive and operating in real-time, digital marketing communications can be targeted to the individual level and are highly amenable to the precise and continuous measurement of advertising results, as well as to the continuous improvement of the efficacy of on-going campaigns (Hairong, 2011). A 2014 survey of B2B and B2C companies showed that there is a significant shift from the money spent on traditional communication toward online media (Figure 1.2) (Hairong, 2011).
Emailing is the number one activity performed over the Internet, being widely used by people to communicate with their family, friends, acquaintances and co-workers (Phelps et al., 2004). Email accounts grew from 2 million in 1983 to 891.1 million in 2001. Email marketing campaigns produce near twice the return on investment of the other kinds of online marketing communication (Cho and Khang, 2006). A significant part of email traffic is composed by commercial emailing, which is used by marketers to reach current and potential customers with information about offers (Phelps et al., 2004). According to a survey conducted by RetailDIVE, from 1095 companies and industries from all over the world, email marketing produces ROI in the majority of the instances (Figure 1.1).
There are several types of emails (see Annex 1), such as newsletters, email discussion and subscripted email marketing channels (Sathish et al., 2011) (Table 1.1). Other sources suggest additional types of email marketing, such as Educational emails (Hubspot, 2012). This type of email is intended to help customers solving a problem or looking for an answer to a particular question. They should be sent whenever there is a new piece of content, a popular blog article, a series of blog articles from the last quarter, or any type of educational-based content (Kilens,
8 2011).
Figure 1.1: Do US businesses believe that online media produce a good ROI? by RetailDIVE.
Figure 1.2: US businesses’ advertising spending plans for 2014 by RetailDIVE. 52% 46% 41% 0% 10% 20% 30% 40% 50% 60% Email marketing Social media Search (SEO/PPC) Percentage of respondents 52% 46% 41% 36% 32% 21% 16% 13% 10% 9% 16% 3% 2% 2% 4% 5% 2% 15% 21% 7% 32% 17% 41% 1% Email marketing Social media Search (SEO/PPC) Online display advertising Mobile marketing Trade shows and events Direct mail Public relations Print advertising Radio/TV advertising None Others
% of Respondents planning to increase spend % of Respondents planning to decrease spend
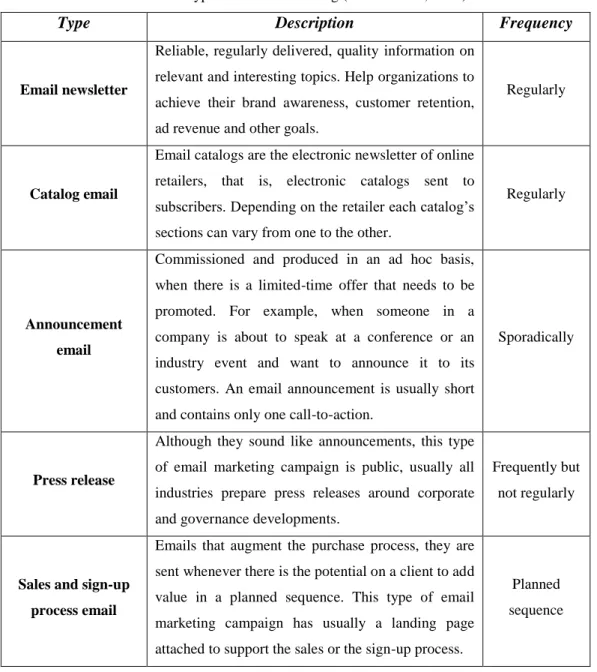
9 Table 1.1: Types of email marketing (Sathish et al., 2011).
Type Description Frequency
Email newsletter
Reliable, regularly delivered, quality information on relevant and interesting topics. Help organizations to achieve their brand awareness, customer retention, ad revenue and other goals.
Regularly
Catalog email
Email catalogs are the electronic newsletter of online retailers, that is, electronic catalogs sent to subscribers. Depending on the retailer each catalog’s sections can vary from one to the other.
Regularly
Announcement email
Commissioned and produced in an ad hoc basis, when there is a limited-time offer that needs to be promoted. For example, when someone in a company is about to speak at a conference or an industry event and want to announce it to its customers. An email announcement is usually short and contains only one call-to-action.
Sporadically
Press release
Although they sound like announcements, this type of email marketing campaign is public, usually all industries prepare press releases around corporate and governance developments.
Frequently but not regularly
Sales and sign-up process email
Emails that augment the purchase process, they are sent whenever there is the potential on a client to add value in a planned sequence. This type of email marketing campaign has usually a landing page attached to support the sales or the sign-up process.
Planned sequence
Marketing should focus on educating, rather than manipulating, consumers. Marketers must become more creative, in order to gain consumers’ interest. Digital media, like search engines or social networks, are useful in helping companies to be found by consumers. The traditional model of the conversion funnel was composed of five stages: Awareness, Familiarity, Consideration, Purchase and Loyalty (Court et al., 2009). However, such model does not include the new changes brought about by the digital revolution. For that reason, a more recent decision making model was proposed – the consumer decision journey (Court et al., 2009). There are, again, five major steps: Initial consideration set, Active evaluation, Moment of purchase, Post-purchase moment and the Loyalty Loop. The last one is related with the Moment of purchase, meaning that such model is no longer static, but rather dynamic – a circular journey.
10 One of the main objectives of emails as promotional tools is to drive customers to a company’s digital presence (e.g., corporate websites, sales websites, social media pages). Therefore, digital marketing managers design their emails as to maximize the chance that targeted viewers will open them, read them and, most importantly, become so engaged with their content that they will direct themselves (by clicking on the hyperlinks contained in the message) to a corporate landing page, in the search for further information on the advertised offer. A landing page is defined as a standalone web page distinct from a main website, which has been designed with a single focused objective (Hinz et al., 2011). The main reason to build a landing page is to guide visitors towards an intended conversion goal. Emails’ Click-Through Rates (CTR), that is, the division of total number of clicks by the number of total ad message impressions (Vaughan, 2012), is thus an important measure of the success of an email marketing campaign, which digital marketing managers hence actively attempt to maximize (Ansari and Mela, 2003).
Ad message design is thought to significantly affect emails’ CTR. In fact, it is believed that the response rates of email surveys could be increased by 62% by customizing the email design (Ansari and Mela, 2003). Email design aspects includes bolding of letters, capitalization, font size, font colors, images and the way messages are built (in HTML versus plain text)(Hubspot, 2012). Email message features include variables like headlines, placement of content, call-to-action, type of content, placement of social media links, number of images, number of links and the length of email) (Hubspot, 2012). Email message design and content features can thus increase sales by increasing CTR and in this way generate important sales revenues for companies. Since email marketing activities are also less costly than other types of online advertising, such as display or paid keyword search ads, they have to potential to generate higher ROI and profit if conducted well (Hubspot, 2012).
1.2 Problem statement
Previous studies on the design features of online advertising and their impact on performance have exclusively focused on display ads (Manchanda et al., 2006) and corporate websites . Studies of online marketing in general rarely address email marketing campaigns (Cho and Khang, 2006).
Although there is a study (Ansari and Mela, 2003) proposing that the design of email marketing (number of links, order of links and email type) may affect the number of times people click on links inside the message, there is yet no research on the effects of written
11 message size, number of message images and presence of call-to-action button on the efficacy - measured by CTR - of email marketing campaigns.
1.3 Aim
The main aim of this dissertation was to evaluate the effects of email message features on the effectiveness of email marketing campaigns. In order to achieve this aim, the following research questions were formulated:
RQ1: Which design features of email messages will positively influence the CTR of email marketing campaigns?
RQ2: Which content features of email messages will positively influence the CTR of email marketing campaigns?
1.4 Scope
In order to achieve the proposed aim, the ad copies and the performance data of 43 pure email marketing, business-to-consumer (B2C) campaigns conducted by Revshare in Portugal between December 2013 and March 2014 were studied in detail. Revshare is a Portuguese integrated, strictly digital, performance-based marketing agency, operating in several country markets, which has established a protocol with Católica-Lisbon in order to collaboratively advance research in the field of online advertising. The present dissertation was conducted under this protocol and benefited greatly from Revshare’s technical and market expertise, as well as from access to their campaign data and other relevant market intelligence information. The campaigns were commissioned to Revshare by client advertisers from very different sectors: Business and Finance, Insurances, Telecommunications, Healthcare services and equipment, Wellness and Fitness, Beauty and personal care, Culture and Arts, E-commerce, Travel and transportation, Home Improvement, and Non-profit organizations. They also varied in launching schedule and duration, so for the sake of simplicity, only the final, cumulative campaign performance data were analyzed.
1.5 Research method
In order to answer the proposed research questions, both primary and secondary quantitative data analysis was employed. For each of the 43 email marketing campaigns studied (see Annex 3), cross-sectional data on selected message design features, CTR and relevant control variables were compiled and statistically analyzed, to uncover potentially significant effects of design features on email effectiveness.
12 Some of the significant effects uncovered were then further investigated through the performance of A/B tests and the statistical analysis of the corresponding primary data. A/B testing is a process where two versions of a communication object are tested simultaneously to see which performs better (Burk, 2006). Hence, and for the purposes of this dissertation, two email marketing campaigns were created, where one design variable (written message size or the presence or absence of call-to-action buttons) was manipulated while controlling for all others. These campaigns were then launched to different sub-samples of email recipients and their performance results compared.
1.6 Academic and managerial relevance
Customers are the center of today’s marketing conversations (Suther, 2010), since they are now able to select the information they want to process and to engage, in real time, in a two-way communication with companies and other consumers. Instead of being passive recipients, as they were with traditional advertising, consumers can now actively participate in the advertising and marketing process by accessing digital media (Liu and Shrum, 2009).
Broadcast is a reach-based strategy, where marketers send a message to a large audience and hope that a portion of that message reaches the target audience (i.e. email marketing). Contrary, narrowcasting is the paradigm that enables marketers to use insights to best reach the most desired audience with greater certainty (Suther, 2010). Narrowcasting allows marketers to identify high-prospect segments online and to present them with targeted offers, which, in turn, improve ROI eleven-fold (Suther, 2010).
By configuring email design it is proved that the number of clicks that a message returns is positively influenced. The design of email is thus crucial in determining CTR (Ansari and Mela, 2003). Through the study of this topic, marketers will understand better how to change marketing design features in order to generate more clicks and thus, increasing ROI of online marketing. By learning how to increase CTR, companies can increment visits to the website and so, engage consumers and boost online sales. Also, customers will be more satisfied if they receive emails that stimulate their curiosity, and increase their interactivity with the company.
1.7 Dissertation Outline
Chapter 2 presents a review of extant sources on advertising, advertising design and advertising efficacy. Based on the conclusions of this review, three research hypotheses are proposed for further statistical testing. Chapter 3 describes the research methods, data sets and
13 statistical analysis used. Chapter 4 presents and discusses the results obtained and assesses the confirmation of the hypotheses proposed. Chapter 5 presents the main conclusions that can be drawn of the research developed in this dissertation and derives its main academic and practical implications, as well as its most important limitations. Finally, some suggestions some future research in the area of digital marketing in general, and online advertising in particular, are made.
14 CHAPTER 2: LITERATURE REVIEW AND CONCEPTUAL FRAMEWORK
This chapter presents the results of a literature review performed on the topic of online advertising, with a special focus on email marketing campaigns, their design and performance assessment. At the end, research hypotheses are formulated to help answering the proposed research questions.
2.1 Advertising
Advertising is a powerful technique to communicate offers and brand value to consumers in order to achieve marketing objectives. Statistics, by different known companies in this industry, show how important email marketing can be to increase CTR and how some factors influence CTR based on their historic (see Table 2.1).
Table 2.1: Importance of email marketing and some of its factors that influence CTR.
33% of open rate in email marketing is based on subject (from www.convinceandconvert.com);
The presence of social sharing buttons increase CTR by 158% (from www.getresponse.com);
Email marketing was the third overall lead generation source for marketers in 2013, producing 13% of all leads (from www.hubspot.com);
Saturday and Sunday are the two days in a week which have the higher CTR (from www.hubspot.com);
6 a.m. has the highest CTR of any hour (from www.hubspot.com);
People who buy products marketed through email, spend 138% more money than people who do not receive email offers (from www.convinceandconvert.com);
88% of people prefer to receive HTML messages rather than plain text messages (from www.hubspot.com);
Subject lines with 30 words or less perform above average on opens and clicks (from www.adestra.com);
91% of people check their email daily (from www.exacttarget.com).
Thus, to serve different objectives, advertising itself can have different goals. It can be a means to provide information about a product/service, remind the public about the existence of some products in the market, change a specific social attitude, induce the public or
15 customers for direct purchase or merely encourage salesmen and facilitate its job of selling a product (Amjed, 2010).
Advertising has several functions, and therefore there are models describing the steps followed to achieve different goals (Table 2.2).
Table 2.2 – Decision making model of advertising (Mackay, 2005; Barry, 1990).
Model Steps Source
AIDA Awareness - Interest - Desire - Action (Strong, 1925) DAGMAR Awareness - Comprehension -
Conviction - Action
(Colley, 1961) Hierarchy of effects Awareness - Knowledge - Liking -
Preference - Conviction - Purchase
(Lavidge & Steiners, 1961)
The first model consists of 5 major steps that consumers must pass during the buying process, after being exposed to the advertisement. There is a linear relationship between steps, meaning that in order to move to the other step, the previous one must have been completed. The second one has its focus on understanding how consumers act after an advertisement exposure. Again, there is a linear relationship between steps. In this case, measurable objectives must be defined for advertising. Finally, the last model also assumes a linear progress along several decisions stages. However, the different levels of considerations may depend on the product or service.
For many years, marketing’s main presence was in newspapers, TV, magazines, direct calls and Radio (Ashe-Edmunds, 2012). Media choice was guided by the available budget and the target segment wanted for a specific product. With the development of Internet and digital media, traditional media has become relatively more expensive, because a company has to buy TV spots and pay for the development of the commercial, something that can be foregone in the online ad industry. Moreover, market response to this kind of advertising is also relatively slower. In the majority of industries, the marketplace is very aggressive and companies must change their strategy from one day to another in order to respond to competitors (Personal Communication, 2014). Changing the broadcast ads require too much time and investment. Segmentation in traditional advertising is mainly based on audiences’ socio-demographic profiles. Nevertheless, once a magazine or newspaper is printed and mailed there is no information about who actually read it (Chao et al., 2012). With modern media is possible to deliver personalized content at a more individual level, based on past online behavior. Lastly, the amount and message diversification that offline media can deliver is also considerable less when compared with online media. For instance, while print media
16 has few square inches and a TV spot has around 30 seconds, the online ad formats’ possibilities are endless (Chao et al., 2012).
2.1.1 Advertising in digital media
Digital Media have been used not only as an alternative channel to traditional advertising formats, but also as a platform for the emergence of new forms of advertising (Hairong, 2011). There are various types of online advertising, and understanding how they work is the foundation to know how to make profit out of marketing (Thomas, 2011).
Vertical Search is a streamline solution that helps Internet users to find what they need on search engines (i.e. Google). Scholars, to categorize online advertising, have used several ways. Thomas Lorrie (2011), for instance, divides them into ten different formats (Table 2.3).
Table 2.3 - Online advertising formats and examples for each (Lorrie, 2011). Online advertising formats Examples
Vertical Search Online yellow pages, job/local and product searches Display Advertising Banner ads, like images or video, on websites
Email Marketing Newsletter
Viral Marketing Any marketing message massively spread by consumers News Sites Google Ad Words, AdSense, Yahoo! Publisher Network
Blog Marketing BlogHer, SocialSpark
Behavioral Advertising Retargeted ads
Social Media Marketing Facebook ads
Contextual Advertising Specific words on a website have a link Affiliate Marketing Amazon Associates
2.1.2 Advertising through email
Emailing is the number one activity on the Internet. Companies use it to communicate with their potential and actual customers (Phelps et al., 2004). The process of sending an email marketing campaign has three phases, Annex 4 shows the three options of processes with the subjects and the phases. The Introduction phase is where the client and the online marketing
17 company discuss the needs and next steps. The second phase - the Production - is when the email and the landing page are built. And the last phase is the Delivery, which is when the campaign is sent to the subscribers. An email marketing forecast from Forrester Research, 2012, stated that the amount spent on email marketing, in the United States from 2011 to 2016, would increase by $1 billion. Thus, companies need very good measures of their campaigns to know whether they should change or eliminate any of them.
Table 2.4 summarizes some of the main strengths and weaknesses of promotional email messages.
Table 2.4 - Advantages and disadvantages of email marketing (McCormick and Media, 2013)
Advantages Disadvantages
Broad audience High clutter Low cost per contact Low carryover & recall Image & Legitimacy Impersonal Pervasive & expressive High cost per ad
Flexible Little dialogue
In addition to these weaknesses of email marketing, email messages can also be characterized as spam by mail servers. If an email recipient did not granted permission to receive that message, or if the same/equivalent message was sent to a large group of recipients (i.e. some newsletters), it will most likely be considered spam (Spamhaus, 2013). To send a message effectively, email specialists spend great time understanding and improving the effectiveness of the delivery and the content itself (Thomas, 2011). Although the some knowledge is required to conduct good campaigns, email marketing has the advantage of costing very little in terms of variable costs (Table 2.4). According to a Mailchimp Benchmark, 2013, an email marketing platform that provides databases, reports and tracking on its clients’ campaigns, the cost per email sent for a number of subscribers between 100k and 105k is around 0,30 cents. Many companies look at email marketing as an easy tactic to increase sales on the short run (Hopkins, 2011). Other, however, incorporate it also in other, more strategic areas of marketing. According to a MarketingSherpa’s (2011) report, email marketing can serve many different objectives, such as:
Increase website traffic
18
Increase sales revenues
Generate leads
Improve customer relationship/retention
Supporting offline marketing programs
Increasing the size of customer databases
Engage social media audiences.
The same study concludes that email marketing is the most effective way of driving traffic to a website or building brand awareness (Figure 2.1) This study consists of a benchmark done in December 2012 to 1095 companies to understand how was the effectiveness of email marketing campaigns for different objectives.
Figure 2.1 - Study about the effectiveness of email marketing, MarketingSherpa’s (2012)
Among digital media, email marketing continues to be a very way to generate leads. However, certain practices should be followed to ensure success (Goulart, 2014):
Recipients: gather the most information regarding the target audience, not only their names and email addresses. Database segmentation is crucial for effective targeting and hence performance.
Subject line: enhance the main benefit and do not announce something that is not linked with the email content.
Message: make sure the message is important. The more relevant a message, the higher the response to it will be.
0% 20% 40% 60% 80% 100% Not effective Somewhat effective Very effective
19 In order to maintain the database quality, companies may use the re-targeting strategies, which consist of sequentially showing ads in multiple networks, based on email subscriptions (Laja, 2013). This entails two processes:
1. A cookie is left on the subscriber’s browser after opening the email
2. Every time that subscriber visits a networked website he or she is re-targeted with ads from the same brand or company
This is a very good mechanism to allow brands to stay top of mind, increasing the possibility of selling an offer (Laja, 2013).
2.2 Email message components
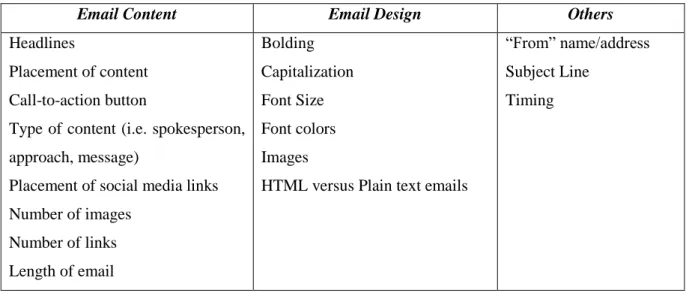
According to Hubspot, 2012 report email features can be divided in three categories (Table 2.5).
Table 2.5 – Main email message components (Hubspot, 2012)
Email Content Email Design Others
Headlines
Placement of content Call-to-action button
Type of content (i.e. spokesperson, approach, message)
Placement of social media links Number of images Number of links Length of email Bolding Capitalization Font Size Font colors Images
HTML versus Plain text emails
“From” name/address Subject Line
Timing
Beside these elements, other message features may influence the CTR of an email campaign. If and how marketing messages are processed by consumers depends on both attentional and motivational factors. The selection of message appeal (Table 2.6) to serve as basis for a marketing message is thus mainly dependent on the target consumers’ predicted level of knowledge about, and involvement with, the offer (Clow and Baack, 2013). These levels predict how exactly marketing information will be processed, product evaluations formed and buying decisions made.
Table 2.6 - Message processing depends on the level of involvement of consumers (Clow and Baack, 2013). High-Involvement (or Standard) Learning Hierarchy
20 Cognition Affect Behavior
Low-Involvement (Habitual) Hierarchy Cognition Behavior Affect Experiential Hierarchy
Affect Behavior Cognition
Low-involvement (Behavioral) Hierarchy Behavior Cognition Affect
Three main types of appeals characterize different marketing messages – Cognitive, Emotional and Behavioral appeals (Clow and Baack, 2013).
Rational appeals trigger standard learning hierarchy of decision making by presenting information about the benefits of the product and its usefulness. This links the message to the target audiences’ self-interest and utilitarian value perceptions, thereby increasing their level of cognitive involvement with the ad and the offer (Clow and Baack, 2013). Emotional appeals, on the other hand, trigger the experiential hierarchy of decision making by generating emotions and feeling in target audiences and strengthening their association to the ad and the offer. This generates a high level of emotional involvement with consumers. Lastly, behavioral appeals are designed to trigger either habitual behavioral responses or impulse buying, both of which are the result of a low level of cognitive and/or affective involvement with the ad and offer (Vaughan, 2012). Examples of the latter are the scarcity appeals (Clow and Baack, 2013), that is, appeals that urge consumers to buy a particular product due to some limitation (e.g. limited number of stock or limited editions). These are mainly used in combination with other types of behavioral appeals. Scarcity appeals are often used in promotional email marketing campaigns, because they drive consumers directly to the sales objective of a campaign. When this happens, emailing becomes a very effective channel of direct marketing activities (Clow and Baack, 2013).
2.2.1 Structure
Structure is about how a promotional message is able to convey the selected content or appeal. There are three main approaches to structuring ad messages – informational approaches (aka cognitive strategies), transformational approaches (aka affective strategies) and behavioral approaches (aka conative strategies). Informational approaches are typically employed when appeals are rational (but not exclusively). They raise awareness by making claims or offering solutions. Transformational approaches elaborate on unique and tangible benefits, showing convenience of usage, new product features. Behavioral approaches use
21 normally action appeals (but again, not exclusively). Most effective ad messages, however, use more than one type of strategy: they start by appealing to the heart, to capture attention and end with an informational structure, to deliver the persuasive content (Vaughan, 2012).
2.2.2 Format
Messages have several elements that may differ from one campaign to the other, according to the level of involvement of the target audience. An important question is when should marketers use words and when should they use images. Marketers should use words in high involvement decision-making processes and images in low-involvement decision making processes (Clow and Baack, 2013). This is because visuals capture the attention and enhance recall better than words, and factual information about the attributes of a product deliver the message better.
A previous study (Valenzuela and Raghubir, 2009) indicates that offers placed in the center of an online retailer’s display are the most popular among consumers, because they are more salient and receive more attention. This is due to the social belief that an object placed in a central position is necessarily the most popular one, the so-called center-stage effect. The center advantage is attenuated when position does not convey information, which is less relevant for choices, and when people’s intrinsic product preferences are made accessible by the context (Valenzuela and Raghubir, 2009). Moreover, if people pay more attention to the salient center position, their judgments should best reflect that performance of objects in a central position are easier to recall than those in non-central positions (Fiske, 1989). This central-stage effect that happens in online retail stores, might be applied to email marketing campaigns relatively to call-to-action button. Meaning that the button in a central position might be more efficient to the message CTR than in any other part. However, there are studies showing that display ads on the top and left side of a page are more effective than in the other parts.
DoubleClick, an Internet advertising agency, recommends the use of bright colors to capture attention and so, generate more clicks (Lohtia et al., 2003). The first banner advertisements were simply static images containing advertising content. On a study about banner advertisements, it was proved that for low-involvement situations, banners with animation attract more attention and hence are clicked more. Moreover, studies for different companies conducted by ACNielsen also suggest that animated ads have a higher CTR than static ones (Lohtia et al., 2003).
22 2007 (Robinson et al., 2007). In this study the length of messages – number of words – was coded into dummies and clustered around a few lengths. The reason why they were coded into dummies was that the effect of adding a word or two to the message on CTR is likely to be small, whereas larger differences are likely to be seen in messages with different lengths (Robinson et al., 2007). This study showed that very long messages in banner advertisements have higher CTR than short messages, because bigger display ads are the most visible and are the most of the times adjusted to content, meaning that if the ad is big then it is because it has a very long message (Robinson et al., 2007). Is this conclusion the same for email marketing campaigns, since an email is not more visible just because of its length? Actually, if people receive about 80 email messages per day (Radicati, 2011), then it is normal that they prefer shorter messages, to be easier and faster to read them.
2.2.3 Source
A source or spokesperson is someone that gives his face for a cause or a campaign (Clow and Baack, 2013). Celebrity spokespersons, for instance, help create emotional bonds with brands, improve brand awareness and define a brand’s personality. CEOs, experts (i.e. physicians, lawyers, doctors and accounts) and typical persons (i.e. good-looking people that portray or resemble everyday people) can also represent a brand or a product. Different types of spokespersons are more effective with different market segments. Older consumers, for instance, are less likely to be influenced by celebrities than younger ones (Clow and Baack, 2013).
2.3 Metrics for evaluating the efficacy of promotional email marketing campaigns Key performance metrics are crucial instruments to marketing managers, so that they can learn whether advertising campaigns are providing a satisfactory return on the investment or not. Traditional media campaigns’ results are hard to measure, because it is difficult to learn how many consumers saw an ad on the TV or an outdoor. This has changed considerably with the development of the online advertising industry (Ashe-Edmunds, 2012).
Several key metrics can be used to assess whether a promotional email marketing campaign outperformed or underperformed according to its initial goals (Vaughan, 2012).
Bounce Rate is the percentage of total emails sent that could not be delivered to the recipient’s inbox, a phenomenon known as a “bounce”. There are two kinds of bounces: hard bounces and the soft bounces. Hard bounces are the result of an invalid, closed, or non-existent email address, meaning that these emails will never be successfully delivered. These
23 emails should be immediately removed from the email list. Otherwise the company can be seen like a spammer in the eyes of an Internet Service Provider (ISP). Soft bounces, on the other hand, are the result of a temporary problem with a valid email address, such as full inbox or a problem with the recipient’s server. The recipient’s server may hold these emails for delivery once the problem clears up, or the company may try to re-send the email campaign in the future. This variable has a strong impact on the value of CTR (Vaughan, 2012).
Delivery Rate is the percentage of emails that were actually delivered to recipients’ inboxes. It is calculated by subtracting hard and soft bounces from the gross number of emails sent, then dividing that number by gross emails sent. This metric sets the stage for email success or failure, since to have any chance of engaging a potential or actual customer with an email campaign, the message must first get into his inbox (Vaughan, 2012). To achieve success, delivery rates should be of 95% or higher. If the delivery rate is constant or decreasing over time, it might be because the company has too many invalid addresses. If one particular campaign has a low average delivery rate, it is important to examine the subject line and content of that message (i.e. some element of that message might have been flagged as spam by corporate firewalls or ISPs) (Vaughan, 2012).
The Growth Rate of an opt-in email address list is calculated by subtracting opt-out subscribers and hard bounces from the number of new email subscribers gained in a given month, and then dividing this figure by the size of the original address list. For a well-structured marketing program, the lists of new names and email addresses must be continually growing (Vaughan, 2012).
The Click-Through Rate is the rate at which viewers click on an advertisement (Vaughan, 2012) and it is calculated by dividing the number of unique clicks by the number of emails delivered, or by dividing the number of total clicks – including the multiple clicks by the same recipient – by the number of emails delivered. Both methods work as long as the company is consistent in its choice (Vaughan, 2012). CTR values are crucial to evaluate whether a message is relevant enough, and the offer compelling enough, to encourage email recipients to take action. The advertiser’s industry and the type of marketing goal behind an email campaign – educational, informational, promotional, transactional – are factors known to affect significantly its CTR (Vaughan, 2012).
The Conversion Rate is the ultimate measure of an email campaign’s effectiveness and is defined as the percentage of recipients who clicked on a link within an email and completed the desired action of that message – filling out a lead generation form or purchasing a product
24 in the advertiser’s landing page (Vaughan, 2012). The more relevant and compelling an offer is to an audience, the higher the corresponding lead or sales conversions will be. Nevertheless, it is important to notice that conversions rely heavily on both email message and landing page features (Vaughan, 2012). The measurement of Conversion Rates requires integration between the email service provider (ESP)’s and web analytics’ platforms. To perform this integration it is necessary to create unique tracking URLs for email links that will help identifying the source of the click (Vaughan, 2012).
Revenue per Email Sent is the measure of the Return on Investment (ROI) of a particular email campaign, being calculated by dividing the total revenue generated from the campaign by the number of emails sent (Vaughan, 2012). This metric is ideal for ecommerce marketers who generate a lot of direct sales from email campaigns. However, it also requires close integration between ESP and ecommerce or web analytics platforms (Vaughan, 2012).
Open Rate is a measure that accounts for the number of emails that were opened only when the recipient also receives the images embedded in the message. The problem is that a large percentage of email users might have an image blocker on their account. This means that each time they open the email these users will not be accounted for. Open Rates are thus an unreliable and inaccurate metric, as it under-reports the true numbers of opened emails (Vaughan, 2012).
Many customers get tired of receiving email campaigns from a company, but generally do not bother to go through the formal un-subscription process. Most of them simply stop opening, reading and clicking on the email messages. Un-subscription Rates are hence fairly unreliable metrics, which only be of any help to evaluate campaign performance when one needs to track sudden spikes occurring after a particular email marketing campaign (Vaughan, 2012).
2.4 Conclusions and research hypotheses
Two research questions were formulated in chapter 1: “Which design features of email messages will positively influence the CTR of email marketing campaigns?” and “Which content features of email messages will positively influence the CTR of email marketing campaigns?”. Regarding the first research question, the review of previous studies in this area had shown that bright colors are better in generating CTR than soft ones. Since this is a very subjective topic, it will be tested if more colors generate higher CTRs than messages with fewer colors:
H1: Messages with more colors (color of the call-to-action, background, and font)
25 Regarding the second research question, the review of previous studies in this area has shown that very long messages in display ads and animation (measured, in this case, by the number of images) are better in generating CTR. Besides a previous study on display ads state that longer messages are better to generate CTR, for email marketing campaigns, as already explained in sub-chapter 2.2.2, less words are expected to influence positively the CTR.
H2: The CTR of email marketing campaigns is higher when the corresponding
message has fewer words.
H3: The CTR of email marketing campaigns is higher when the corresponding
message has more images.
H4: The CTR of email marketing campaigns is higher when there is a presence of a
typical person as a spokesperson.
H5: The CTR of email marketing campaigns is higher when the corresponding message has a behavioral approach.
The next chapter details the research approach and methods undertaken to statistically test these research hypotheses.
26 CHAPTER 3: METHODOLOGY
After formulating the hypothesis in the previous chapter based on literature, this chapter provides detailed information regarding methodology used to answer research questions. Information about the secondary data used is presented followed by the presentation of the collection of primary data through A/B testing technique.
3.1 Research Approach
Research Approaches can be exploratory, descriptive and/or explanatory (Saunders, 2007). Exploratory research typically involves secondary data sources, expert interviews and the performance of focus groups. Its main goals are to get more insight and clarify current understanding about problems that are yet not well explored, although not intending to provide final answers. It is very flexible because new data can be added at any time. However, this approach is usually limited to the collection and analysis of qualitative data. Descriptive approaches, on the other hand, allow the computation of a detailed profile of events, people and situations in a certain point of time. This enables the generation of a clear picture of the phenomena under research prior to data collection. Contrary to exploratory research, descriptive approaches are expected to draw stronger conclusions based on the statistical analysis of data. Lastly, explanatory research aims to find causal relationships among the variables under study. Its main objective is to demonstrate which specific factors lead to or influence the occurrence of a particular phenomenon. Therefore, it always requires the collection of primary quantitative data and its statistical analysis.
In order to achieve the goal of this thesis, a descriptive approach encompassing the statistical analysis of secondary, cross-sectional data from past email marketing campaigns was first conducted. This enabled the identification of design features that have a significant positive impact on CTR, the effects of which were subsequently tested through an experimental research, namely the performance of A/B tests. A/B testing is a process where two versions of an object are tested simultaneously to see which performs better (Burk, 2006). Thus, in the context of this dissertation, it consists in creating two email marketing campaigns controlling which is the variable that will change within both options (e.g. Option A: an email marketing campaign with the presence of a call-to-action button; Option B: the exact same email marketing campaign sent on option A, but where there is no call-to-action button). There are three types of experiments: controlled, natural/quasi-experiments and field. Controlled experiment uses control groups to guarantee that the responses are equal in groups probabilistically equivalent. The term experiment usually implies a controlled group, but
27 sometimes this is not possible, as for, natural experiment. These experiments rely uniquely on the groups under study. Field experiments, often used in social sciences and in some economic analysis, have the advantage that the outcomes are observed in a natural setting rather than in a contrived laboratory experiment (Vaughan, 2012).
3.2 Secondary Data
Revshare is an Online Marketing Portuguese company that gently provided all datasets. 43 campaigns will be analyzed (Annex 2).
All campaigns had the goal of driving traffic to a website and increase conversions. Campaigns were sent to a database of an average of 102703 users. Since there is not just one platform with all information gathered in Revshare, to collect the information needed it was used: Doctor Sender and Hasoffers that complement each other. Hasoffers is the platform where it is introduced the main indicators about the campaign - client ID, offer ID, affiliate payout, revenue model, email marketing kit, among others (Personal Communication, 2014). It counts the number of impressions, clicks, conversions, costs, revenues and profit for each campaign. However, due to technical problems, this platform does not display all parameters (Personal Communication, 2014). Doctor Sender is the platform where Revshare has its own list of email subscribers’. This platform is used to launch/schedule email marketing campaigns, and it provides a big collection of data:
CTR
Number of emails sent
Number of opens
Open Rate
Number of clicks
Unique clicks
Hard and Soft bounces
Unsubscribes
Heatmaps
Clicks and Open distribution
The platforms used for the data collection receive on daily basis information regarding: number of emails sent, viewed, clicks and soft bounces (see Table 3.1).
28 Table 3.1: Presentation of the measure used by the platform to calculate each variable.
Variable Measure
Number of emails sent Total
Number of emails viewed Total
Number of clicks Total
Soft Bounces Average
Campaign duration was deemed to have a negligible impact on ad effectiveness by Revshare (Personal Communication, 2014), since the distribution of email message clicks is typically concentrated in the first five to ten days after launch (Figure 3.1).
Figure 3.1: Graphic showing the distribution of clicks for one already launched campaign, during the first 18 days.
Each campaign has links sending receivers to a landing page on each company’s website. However, not all receivers open the campaign and click on links. So, to take this in account, it was calculated one more variable - CTR: 𝑁𝑢𝑚𝑏𝑒𝑟 𝑜𝑓 𝑐𝑙𝑖𝑐𝑘𝑠
𝑁𝑢𝑚𝑏𝑒𝑟 𝑜𝑓 𝑒𝑚𝑎𝑖𝑙𝑠 𝑣𝑖𝑒𝑤𝑒𝑑.
Besides being very complete it records data for only 20 days, cleaning up the records as the time goes by. As previously mentioned, campaigns were not sent all at the same time. They were launched between 2nd December 2013 and 14th March 2014, thus data used is of cumulative values for each campaign. Data was provided by Revshare to help conducting a descriptive research.
There are 15 online advertisement companies in the Portuguese market, and Revshare is one of the only 3 that sell an integrated offer, meaning to launch campaigns in every online
0 5 10 15 20 25 Number of Clicks
29 channel. Per year there are from 350 to 400 email marketing campaigns launched on the Portuguese market by Revshare. The company will provide historical data from 43 campaigns sent to different users – number of emails sent, respective CTR and the percentage of soft bounces. To complete the information needed about the other variables the images of all campaigns were collected as the example in Annex 3.
Information from previews campaigns was collected from both platforms, with the number of emails sent, percentage of emails viewed, CTR and soft bounces. However, to help answering research questions and confirm hypothesis, it was also important to gather information about other variables and divide them in two groups: Design and content.
3.2.1 Design Variables
Number of colors. As the classification of bright or soft colors is subjective, the number of colors per campaign will substitute this element, a higher number of colors will be considered equivalent to bright colors.It was not counted gradient where the number of colors would be obviously endless. As any other study report the number of colors, the best, simplest and more homogeneous way to do it, was to count the number of main colors presented for each message, meaning that colors within pictures and logotypes were not counted. Also, since white is the color on the most of the backgrounds, so it was only counted as a color when there letters in white were present.
3.2.2 Content Variables
Number of images. Not all messages have images, some of them only have symbols and some do not even have any image. For this variable only photos and images of the products were counted.
Number of words. Each campaign was analyzed individually and it was counted the number of words in the body of the message (Figure 3.3), meaning that words on the logotype, slogan, call-to-action and mandatory endnotes were not counted (Figure 3.4). The number of words was divided in three intervals in a way that each interval had the approximate same number of campaigns (see Figure 3.2).
30
Figure 3.2: Graphic showing the number of campaigns that have words on each interval.
Figure 3.3: Example of the part of the message where is the number of words that were counted.
Figure 3.4: Example of the text that was not taken into account.
0 10 20
[1-30] [31-80] [81-150] Frequency
31 Call-to-action button. Call-to-action is considered for the analysis as the button where users click to go to a website, to fulfill a form or to complete any other desired action.
Type of approach. As explained in the previous chapter, the type of approach can be informational, transformational and behavioral. The type of approach can influence the response of the customer to the message - increase or decrease the CTR.
Type of spokesperson. The type of spokesperson, as stated in the literature review, can influence the response customers have to the email message. This study does not take, however, into account the characteristics of receptor, which can have impact on this effect. According to Kenneth E. Clow, 2012, typical persons are likely to have a more positive impact on the CTR of email marketing campaigns because consumers believe in people with whom they identify theirselves with (Vaughan, 2012).
3.2.3 Control Variable
CTR depends on the industry the company is in and the type of message – newsletter, email marketing campaign or transaction message. According to an email platform – MailChimp, 2012 - CTR normal values (see Table 3.2).
Industry Open Click Soft
Bounce
Arts and Artists 27.97% 3.28% 1.17%
Beauty and Personal Care 20.72% 2.82% 0.82%
Business and Finance 20.68% 3.14% 1.18%
eCommerce 17.35% 3.0% 0.48%
Entertainment and Events 20.93% 2.51% 0.88%
Health and Fitness 24.27% 3.64% 0.83%
Home and Garden 26.44% 4.40% 1.04%
Insurance 19.72% 2.37% 1.15%
Medical, Dental, and Healthcare 22.76% 3.07% 1.25%
Non-Profit 25.12% 3.25% 0.79%
Other 22.58% 3.18% 1.37%
Professional Services 21.72% 3.21% 1.69%
Telecommunications 19.77% 2.38% 1.84%
Travel and Transportation 20.0% 2.77% 1.12%
Table 3.3: Benchmarked values from MailChimp, 2012.
The advertising industry could be used as a control variable for this dataset of 43 campaigns, which has 12 types of industries. As in 43 campaigns, being 12 industries is very heterogeneous and the dataset collected had few number of campaigns per industry, this variable was not considered for the Linear Regression ran in the statistical analysis.
32 3.2.4 Dependent Variable
The analysis of the performance of the 43 campaigns collected was based on two variables: CTR and hotspots. Each time the user clicks on the message, that click is recorded on a heatmap, where the places where all user clicked since the launch of a campaign are displayed in hotspots. The position of hotspots can be very spread or very condensed, it has a great relationship with the place where the call-to-action button is on a message.
CTR.
Number of hotspots. The number of hotspots can tell how spread focus points on the message are. Are the attentions all focused on a single point or spread out in the message? The more clicks the link had, the darker the hotspot’s color is (see Figure 3.5). The problem with this variable is that it uses the number of clicks, and what is trying to be tested on this thesis is how design features can improve CTR.
Figure 3.5: Images of a campaign presenting the hotspots.
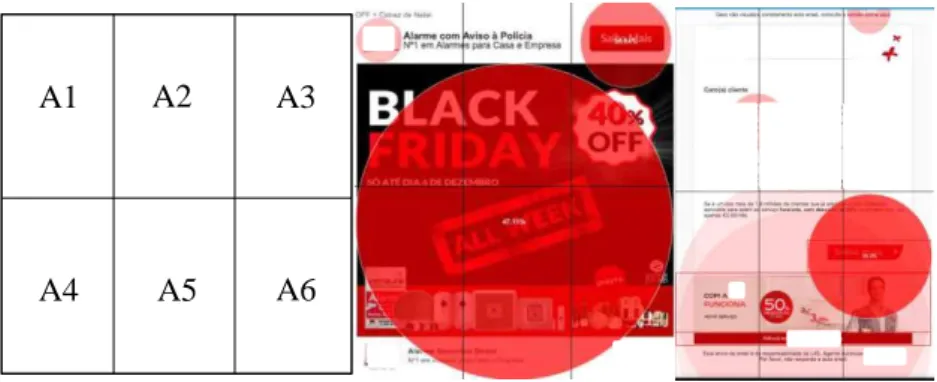
Percentage of hotspots per position in the message and the position of call-to-action. This variable allocates the percentage of hotspots to six divisions of the message. The message was divided in six parts as shown in Figure 3.6. To represent the central position it was considered positions A2 and A5.
33 Figure 3.6: Scheme of the division of a message in positions (left), an example of a campaign divided with its
respective hotpots (middle) and the position of call-to-action (right)
3.3 Preliminary Data Analysis
3.3.1 Secondary Data
After compilation in an Excel spreadsheet, the secondary data collected on the variables of interest were subject to extensive descriptive analysis and data cleaning/transformation procedures, when required, using the IBM SPSS Statistic 20 software. After outliers were excluded and the distribution of the dependent variables was normalized, multivariate regression analyses were conducted using the same software.
To identify which of the design features hypothesized had a significant impact on campaign CTR, a stepwise OLS linear regression method was employed. The variables included in the regression model are depicted in Table 3.3. This regression aims to answer to both research questions.
Colors is the variable representing the design features, because it is the factors, which can be seen by the receptor of the message. And images, words, type of spokesperson and type of approach represent the content features that will be used to answer research question 2. All the analysis will be done on SPSS Statistics.
Multivariate Regression
To analyze whether message design and content characteristics have influence on CTR, it was computed an OLS Linear Regression with all variables presented below being independent and CTR the unique dependent variable (see Table 3.3).
Table 3.3: Chosen variables for the Linear Regression. Dependent Variable Independent Variables
CTR Colors Number of words Number of images Type of Approach Type of Spokesperson A1 A2 A3 A4 A5 A6
34 3.3.2 Primary Data
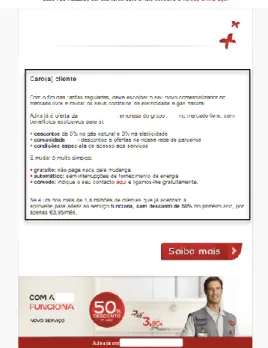
In order to test the number of words’ effect on the CTR, one campaign was launched and sent to a database of 99774 subscribers from Revshare. The data of this campaign was collected during 6 days, which is the number of days where the campaign has the highest responses as seen in Figure 3.1. The experiment consists of an A/B test, which consists of sending two versions of the same email marketing campaign to half of the database each.
Both versions vary solely on the number of words they present. The version A has 29 words (see Figure 3.7), belonging to the interval of 1-30, and it was sent to 49887 subscribers.
Figure 3.7 Version A of A/B test: 1-30 words
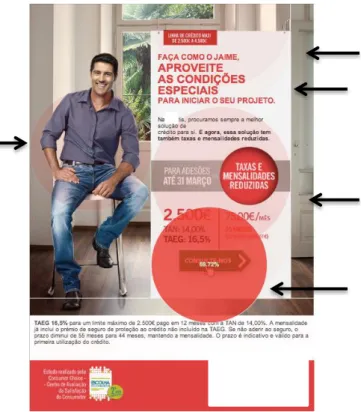
The version B was sent to the same number of subscribers as the other version but has 84 words 81-150 (see Figure 3.8).
35 Figure 3.8: Version B of A/B test: 81-150 words