Equity Valuation:
Ryanair Holdings PLC
Miguel Pereira
Dissertation written under the supervision of Professor José Carlos
Tudela Martins
Dissertation submitted in partial fulfilment of requirements for the MSc in Finance, at the Universidade Católica Portuguesa, 1st June 2018.
I
Abstract
The main goal of this dissertation is to arrive at a fair value of Ryanair’s equity. Ryanair Holdings Plc is a low cost carrier and one of the strongest in the airline industry in Europe: transporting more than 130 million passengers per year, with thousands of flights per day and offering the cheapest fares, on average.
To reach into a final estimated price for the company’s stock value, this dissertation used three methods: the Discounted Cash Flow (DCF) methodology, the Economic Value Added (EVA) and the Multiples/Relative methodology. We will, then, compare the estimated price for each method with the current market price (16,00€) and give relative weights to each in order to land to the final target price: 17,25€. Hence, we give recommendations to investors to “Hold” their positions.
Moreover, a sensitivity analysis was performed in order to study the impact on projected forecasts on both DCF and EVA, resulting from shifts on some key variables and
assumptions.
Ultimately, a comparison between this dissertation’s conclusions and the ones reached by Credit Suisse Research team was studied. Analogous to our recommendations, the bank endorsed for a “Neutral” conclusion, leading investors to “Hold” their positions. The investment bank target price for 12 months, starting at 22 Jan 2018, was 17,91€.
II
Resumo
O principal objetivo desta dissertação é chegar ao valor justo de capital da Ryanair. A Ryanair Holdings Plc é uma companhia aérea “low-cost” e é uma das mais fortes na indústria de transporte aéreo na Europa: transportando mais de 130 milhões de passageiros por ano, através de milhares de voos por dia e oferecendo os preços mais baratos, em média.
De modo a estimar o preço final do valor por ação para a empresa, esta dissertação estudou três métodos: o método de Discounted Cash Flow (DCF), o Economic Value Added (EVA) e o método de Múltiplos. De seguida, compararemos o preço resultante de cada método com o preço atual de Mercado (16,00€) e iremos conceder diferentes importâncias a cada método com o intuito de calcular o preço-alvo: 17,25€. Portanto, nós damos recomendações aos investidores para “Segurar” as suas posições.
Para além disso, uma análise de sensibilidade foi feita nos métodos DCF e EVA para estudar o impacto nas nossas projeções, resultando em mudanças nalgumas variáveis de maior importância e nas respetivas suposições.
Por fim, comparámos as nossas conclusões com as da equipa do Credit Suisse. Similar às nossas recomendações, o banco adotou uma postura “Neutra” relativamente às ações da Ryanair, dirigindo os investidores para “Segurar” as suas posições. O preço-alvo deste banco de investimento, começando em 22 de Janeiro de 2018 e com duração para os 12 meses seguintes, foi de 17,91€.
III
Acknowledgments
First of all, I would like to thank to Professor José Carlos Tudela Martins for his availability and valuable insights taught both in the dissertation seminar and in “Firm Valuation” classes. In second place, I would like to honor my family, girlfriend and friends for all the kind words of motivation expressed in the last months, that made me dedicated to this work and were truly important to keep focus on delivering a good final project.
Last but not least, I want to acknowledge to all my colleagues and professors from the Universidade Católica Portuguesa who made part of my academic life, during the Bachelor and the Master’s degree, over the last 5 years.
IV
Contents Index
1. Executive Summary ... 1
2. Literature Review ... 2
2.1 Discounted Cash Flow Methodology ... 2
2.1.1 Free Cash Flow to Firm ... 3
2.1.2 Free Cash Flow to Equity ... 5
2.1.3 Adjusted Present Value ... 6
2.2 Dividend Discount Model ... 7
2.3 Economic Value Added ... 8
2.4 Multiples/Relative Valuation Model ... 10
2.4.1 The Peer Group ... 10
2.4.2 Different types of multiples ... 11
3. Overview ... 12
3.1 Industry Overview ... 12
3.1.1 LCCs Market ... 14
3.1.2 LCCs vs FSAs ... 16
3.1.3 Porter’s Five Forces Analysis ... 18
3.2 Company Overview ... 19 3.2.1 SWOT Analysis ... 22 4. Forecasts ... 23 4.1 Operating Revenues ... 23 4.2 Operating Expenses ... 25 4.3 Payout Policy ... 27 4.4 Capital Expenditures... 29
4.5 Net Working Capital ... 31
4.6 Debt ... 32
4.7 Tax Rate ... 32
4.8 Key Metrics ... 33
5. Valuation ... 34
5.1 DCF Valuation ... 34
5.1.1 Free Cash Flow to Firm ... 34
V
5.1.2.1 Cost of equity ... 36
5.1.2.2 After Tax Cost of debt ... 37
5.1.2.3 Market Value of Equity and Debt ... 37
5.1.2.4 Weighted Average Cost of Capital ... 40
5.1.3 Terminal Value ... 40
5.1.4 Estimated Price ... 41
5.1.5 Sensitivity Analysis ... 42
5.2 Economic Value Added ... 43
5.2.1 Estimated Price ... 44
5.2.3 Sensitivity Analysis ... 45
5.3 Multiples ... 46
5.3.1 Peer Group ... 47
5.3.2 Estimated Price ... 48
5.4 Final Target Price ... 49
6. Credit Suisse Research Comparison ... 49
7. Conclusion ... 52
8. Appendixes ... 53
VI
Graphs Index
Graph 1: Evolution of Revenues (billions of dollars) and Net Margins (%) (source: IATA)..13 Graph 2: Evolution of WACC vs ROIC as a % of invested capital in airlines (source:
IATA)………14 Graph 3: LCC share of total seats by region (source: Innovata 2017 FEB and Boeing)……..15 Graph 4: Evolution of LCCs vs FSAs in terms of market share (source: StatFor)…………...17 Graph 5: Operating lease fleet in absolute numbers and as a % of total fleet 1990-2017
(source: KPMG and Flight Ascend Consultancy)……….20 Graph 6: Ryanair’s share price performance 2013-2018 (source: Thomson Reuters)……….21 Graph 7: Weight of each expense on total operating expenses (Source: 2018FY Ryanair Results)………25 Graph 8: Peer Group selection (source: Own computations)………...47
VII
Tables Index
Table 1: Forecast of Scheduled Revenues 2017-24 (source: Own computations) ... 23
Table 2: Forecast of Total Revenue 2017-24 (source: Own computations) ... 24
Table 3: Forecast of Operating Profit on absolute terms in M€ (source: Own computations) 27 Table 4: Forecast of Operating Profit on a per passenger basis (source: Own computations) 27 Table 5: Historical Ryanair's payouts (Source: 2018FY Ryanair Results) ... 28
Table 6: Historical Payout, Number of shares, DPS and Dividend Yield (source: Own computations) ... 28
Table 7: Forecast of Payouts 2017-24 (source: Own computations) ... 29
Table 8: Planned closing fleet 2018-24 (source: Ryanair 2017FY Annual Report) ... 30
Table 9: Forecast of Capital Expenditures 2018-24 (source: Own computations) ... 30
Table 10: Forecast of Net Working Capital 2019-24 (source: Own computations) ... 31
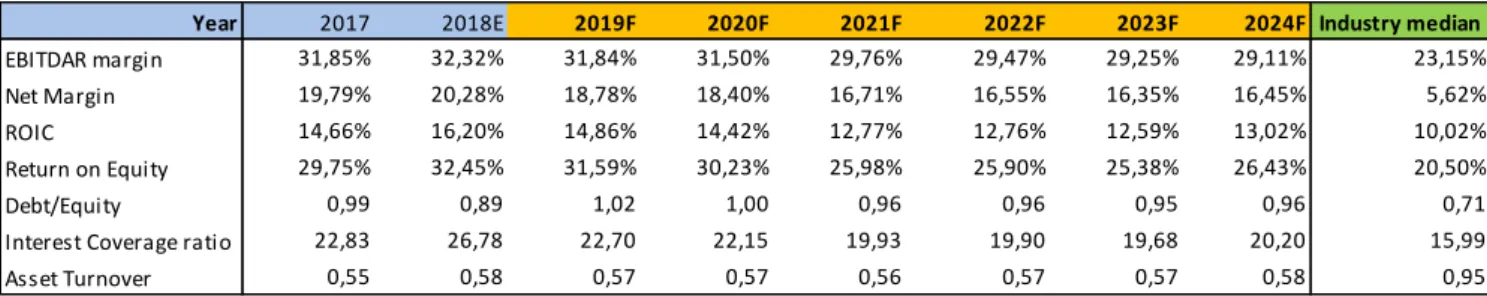
Table 11: Forecasts for Key Metrics 2017-24 and industry comparison (source: Own computations and Thomson Reuters) ... 33
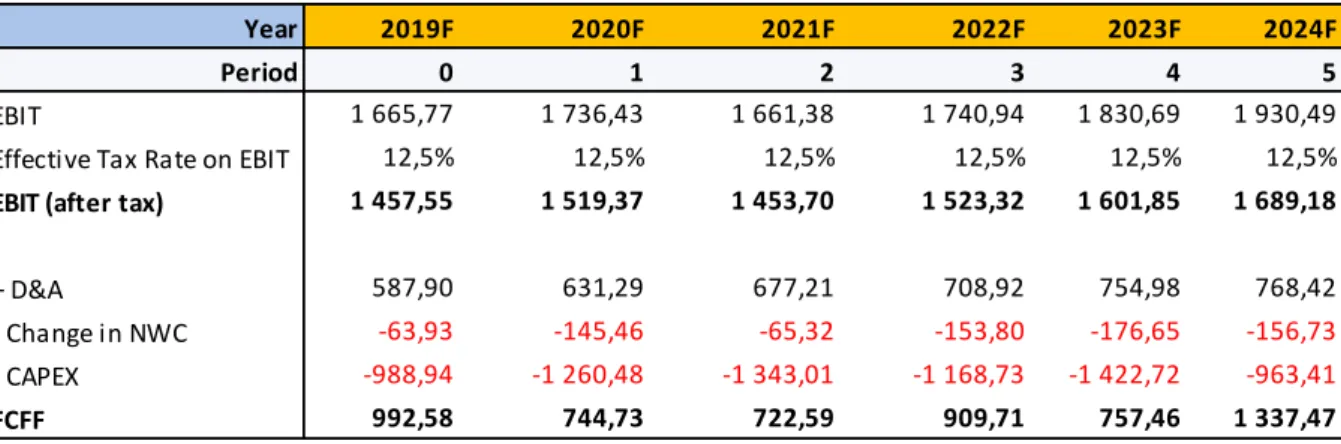
Table 12: FCFF calculations 2019-24 (source: Own computations) ... 35
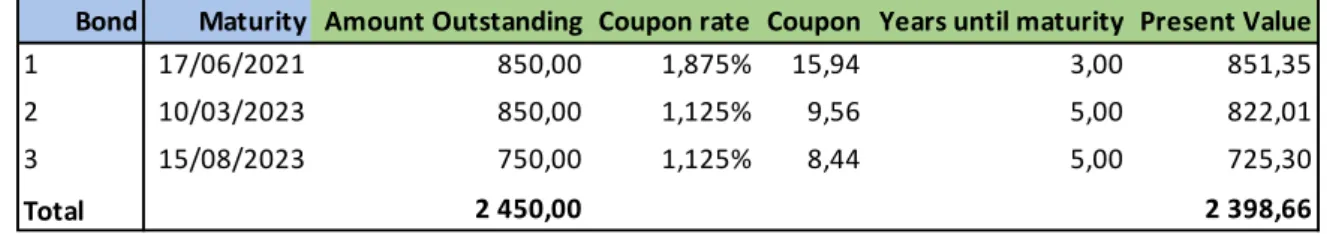
Table 13: Present Value of Ryanair's bonds for FY18 (source: Own computations) ... 38
Table 14: Debt Present Value of Operating Leases for FY17 (source: Own Computations) .. 39
Table 15: Total Debt commitment and Average maturity for NTD in FY17 (source: Own computations) ... 39
Table 16: Discounted Terminal Value and FCFFs calculations 2019-24 (source: Own computations) ... 41
Table 17: Financial sensitivity analysis for DCF (source: Own computations) ... 42
Table 18: Operational sensitivity analysis for DCF (source: Own computations) ... 43
Table 19: Economic profit and Terminal Value calculations 2019-24 (source: Own computations) ... 44
Table 20: Net Present Value of economic profits calculations (source: Own computations) .. 45
Table 21: Financial sensitivity analysis for EVA (source: Own computations) ... 46
VIII
Table 23: Estimated price from EV/EBITDAR (source: Own computations) ... 48
Table 24: Estimated price from P/E (source: Own computations) ... 49
Table 25: Forecasts comparison between Dissertation and Credit Suisse 2019-24 (source: Own computations and Credit Suisse Equity Research) ... 50
Table 26: Valuation comparison between Dissertation and Credit Suisse 2019-24 (source: Own computations and Credit Suisse Equity Research) ... 51
Appendixes Index
Appendix 1: Income Statement 2017-24 in M€ (source: Ryanair FY18 Results and own source) ... 53Appendix 2: Balance Sheet 2017-24 (source: Ryanair FY18 Results and own source) ... 54
Appendix 3: Cash Flow Statement 2017-24 (source: Ryanair FY18 Results and own source) ... 55
Appendix 4: Change in Operating Expenses (%) 2017-24 (source: Ryanair FY18 Results and own source) ... 56
Appendix 5: Change in Operating Expenses on a per passenger basis (%) 2017-24 (source: Ryanair FY18 Results and own source) ... 56
Appendix 6: Depreciations 2017-24 in M€ (source: Ryanair FY18 Results and own source) 57 Appendix 7: Sales by Geography FY2017 (source: Ryanair FY17 Annual Report) ... 57
Appendix 8: Implied Default Spread by Credit Rating (source: Damodaran) ... 58
Appendix 9: Credit Suisse DCF model (source: Credit Suisse Equity Research) ... 59
1
1. Executive Summary
Ryanair Holdings PLC is currently the leading airline in Europe, transporting more than 130 million of customers per year on over two thousand flights every day, connecting 215
destinations in 36 countries. Ryanair has currently a fleet of over 400 Boeing 737 aircraft and it is set to expand with further 240 aircrafts, in order to achieve its primary goal of achieving a traffic of 200 million passengers by Fiscal Year 2024, while keeping the lower fares.
As of 2018, Ryanair is still the lowest fare/lowest cost carrier in Europe with the most customers and it is considered to be one of the greenest and cleanest airlines in this region. This work will focus in analyzing Ryanair past, present and future performance based on the information available, with the purpose to value the company’s business to achieve a final share price target. After reaching this value, we will be able to compare it to the market and we will conclude that investors should “Buy”, “Hold” or “Sell” their positions.
The dissertation will be divided in four major topics. The first one is the Literature Review and it will explain the concepts behind the valuation, including the most relevant models. In second place, we chose to provide an overview of both the airline industry and the company to give a closer perception of how the market is settled and what differs Ryanair from its competitors. The third part is the Methodology, as it will include forecasts for the next years as well as the valuation, using DCF and EVA methodologies, with respective sensitivity analysis, and the Multiples/Relative approach. Finally, we will compare our findings to the ones achieved by Credit Suisse Equity Research Team, exploring the main differences and similarities.
2
2. Literature Review
Valuation is a key instrument in a way that investors and analysts can assess the true value of a company and, therefore, leading to possible gains by comparing their own price with the one in the market.
According to Damodaran (2006), it is most important to determine where such value is
coming from. It relies in strong assumptions and the models that each one uses. So, the best fit here to find the most adjustable valuation is to use more than one model.
According to Fernandez (2013), a company value may not be the same for sellers and buyers and for different buyers. That is why this topic is very subjective and it’s almost impossible to reach a certain right price as the future is unpredictable and it depends on how the company will react to the environment.
Damodaran (2002), also states that “Valuation plays a key role in many areas of finance” as it can be applied to corporate finance, portfolio management and mergers and acquisitions. Throughout this section, we will theoretically explain the main methods used for any non-financial company: Discounted Cash Flow methodology, the Dividend Discount model, the Economic Value Added model and the Multiples/Relative valuation model. We will reason, as well, why some methods will not be used to value Ryanair.
2.1 Discounted Cash Flow Methodology
The Discounted Cash Flow methodology (DCF) attempts to seek the intrinsic value of a company based on the expected cash flows from its business, discounted by a risk rate of these cash flows. In other words, the value of a company right now is equal to the present value of future cash flows. This value can differ from the firm’s price in the market, according to Damodaran (2002).
This method is most suited for companies that have positive and more stable cash flows. When the company is in its early stages (still unstable) or have negative cash flows, the DCF model becomes more difficult to apply. Same difficulties can be encountered if a company is
3 cyclical, meaning that its cash flow pattern follows the economic cycle, or private firms that have few or none publicly information available.
Since Ryanair has a stable capital structure over the last years with positive cash flows, we are going to use this method to compute the target value of the firm using the Free Cash Flow to Firm (FCFF) and the WACC as a discount factor.
2.1.1 Free Cash Flow to Firm
The Free Cash Flow to Firm (FCFF) is a measure of financial performance that expresses the net amount of cash that is generated from operations for a firm after taxes and before interest payments and all the company investments (working capital and capital expenditures). When breaking down to its formula (equation 1), we can see that it starts with the EBIT (firm’s earnings before interests and taxes), deducting taxes (T), adding depreciations and amortizations (D&A) as it is a non-cash expense, and, finally, deducting all investments – changes in net working capital (Δ NWC) and capital expenditures (CAPEX) – because they are not reflected in the income statement for the EBIT calculations and they can be a form of cash outflow, as an increase in cash requirements will most likely occur when investing:
FCFF=EBIT(1-T)+D&A-ΔNWC-CAPEX (1)
Next, we need to compute a discount rate for the FCFF and the correct variable is the WACC. The WACC values all sources of financing taking into consideration its own risk: equity cash flows discounted at cost of equity (Ke) and debt cash flows discounted at cost of debt (Kd), the latter deducting taxes (T). However, this discount rate can’t be considered a “cost of capital” because it isn’t a cost. Fernandez (2011) considers WACC to be “a weighted average of a cost and a required return”. Equation 2 describes the WACC formula:
4 To calculate Ke, we have some models that we can use to estimate it, as it is very difficult to exactly predict returns. One of the most used and reliable models is the Capital Asset Pricing Model (CAPM). It is a model that calculates the cost of equity based on the risk-free rate (Rf), a levered Beta, which is described as a systematic risk measuring a stock's sensitivity of returns to changes in the market (β levered) and the Market Risk Premium (MRP), which is the difference between the expected return on a market portfolio and the risk-free rate (MRP = Expected Return – Rf):
Ke(levered)=Rf+β(levered)*MRP (3)
The cost of debt, Kd, is the weighted average of Internal Rate of Return (IRR) of different debts and it should be computed on an after tax basis. Following Damodaran (2016), this after-tax Kd is equal to the Default Spread, associated to long-term bonds investment rating, plus the Risk-free rate, deducting the marginal tax rate:
After tax Kd=(Default Spread+Rf)*(1-T) (4)
Now that we have all sufficient tools to estimate the value of a company per year, we need to have a terminal value that is really important to value the following years of our explicit forecasted period and it is measured as a perpetuity. When we reach the terminal period, it means that the company reached a steady state with stable growth afterwards. Using the Gordon method, we should take into account the FCFF of the last year of our explicit period and add a permanent growth rate per year (g), discounted by the difference between a stable perpetuity WACC and that same growth:
Terminal Value=FCFF*(1+g)
5 Finally, we need to sum all this equations into one which is going to determine the company’s value. As equation 6 shows, the present value of a firm, according to the DCF model, is the sum of the expected FCFF for every year of the explicit period and the terminal value, all discounted by the same WACC:
Firm’s Present Value=∑ FCFFt (1+WACC)t+
Terminal Value (1+WACC)N N
T=1 (6)
2.1.2 Free Cash Flow to Equity
The Free Cash Flow to Equity (FCFE) is a measure of how much cash is available to the equity holders of a company after all expenses, investments and debt are paid. So, basically, the cash that is left after payment to all other stakeholders of a firm, other than shareholders. This method is similar to the FCFF, however the discount rate will be only the cost of equity (Ke), since the objective is to determine the equity value. To determine FCFE, we should begin with the Net Income (NI) and add it non-cash charges: Depreciations and Amortizations (D&A), then deduct changes in net working capital (Δ NWC), capital expenditures (CAPEX) and, finally, add in the net borrowing (NB = New Debt – Debt Repayment):
FCFE=NI+D&A- Δ NWC-CAPEX+NB (7)
Now, discounting in the same way that we did for the FCFF but using Ke instead of WACC, we will reach a similar formula and the same reasoning applies for the terminal value formula. Overall we will reach a final Present Value of Equity show by equation 8:
Firm’s Present Value=∑ (1+Ke)FCFEtt+
𝐹𝐶𝐹𝐸∗(1+𝑔) 𝐾𝑒−𝑔
(1+Ke)N N
6
2.1.3 Adjusted Present Value
Using WACC in the DCF methodology has some limitations: the main one being that capital structures are considered stable over the years and, although that can be true for some
companies, for many it is not the case, as leverage can be very unstable for a firm depending on its investments and projects. Luehrman (1997) considers that “the weighted-average cost of capital (WACC) is now obsolete. Today's better alternative, adjusted present value (APV), is especially versatile and reliable.” So, the APV is created as a more recent method that allows improvements in the DCF model, because it captures changes in the capital structure of a company and it is not discounted by a weighted average of cost of capital (WACC). APV is essentially the net present value of a company if solely financed with equity plus the
present value of any financing benefits (effects of leveraging) minus the expected costs of financial distress (in cases of exaggerated leverage).
Therefore, the APV will calculate the value of a firm in three steps: Firstly, we need to compute the company’s value as if it was totally financed with equity, using the unlevered cost of equity (Ke unlevered) to discount each FCFF.
Secondly, we will look at the benefits of leveraging a firm, namely the gains with the tax shields that a company holds by having some level of debt. Fernandez (2011) states that “The value of tax shields (VTS) defines the increase in the company’s value as a result of the tax saving obtained by the payment of interest.” These Interest Tax Shields (ITS) are discounted at cost of debt, although the literature has some different theories regarding this. Harris and Pringle (1985) propose discounting tax savings with the unlevered cost of capital (same in the first step). However, the most used and common is the cost of debt (Kd). If we see these tax benefits as a perpetuity, then its value is:
ITS=Tax rate*Kd*DebtKd =Tax rate*Debt (9)
The third and final step before computing the company’s value is to discover the present value of financial distress costs or the expected bankruptcy costs. We will need to have a probability of default (PD), the direct and indirect costs of bankruptcy and the unlevered firm
7 value. Although the direct costs of bankruptcy can be easily estimated (legal, administrative and advisory fees paid by the firm in this scenario), the indirect costs are the ones most subjective and difficult to measure. The latter includes “lost sales, lost profits, and possibly the inability of the firm to obtain credit or to issue securities”, (Gruber and Warner, 1977). Equation 10, shows the formula for the present value of financial distress costs (FD):
FD = PD*(Indirect + Direct costs of bankruptcy)*Unlevered Firm Value (10)
Finally, we just need to join the above steps into one final equation, like we did on the DCF WACC:
Firm’s Present Value=∑ (1+Ke unlevered)FCFFt t+
𝐹𝐶𝐹𝐹∗(1+𝑔) 𝐾𝑒 𝑢𝑛𝑙𝑒𝑣𝑒𝑟𝑒𝑑−𝑔
(1+Ke unlevered)N N
T=1 + 𝐼𝑇𝑆 + 𝐹𝐷 (11)
Now regarding the methods that we are going to use on Ryanair, it is useful to note that the capital structure have been relatively stable historically and it is going to continue steady according to future projections. Therefore, the APV method is not as useful as the DCF using WACC and FCFF, which is the most relevant model to determine this company’s value. In fact, using APV or WACC should grant a similar value.
2.2 Dividend Discount Model
The Dividend Discount Model (DDM) is somewhat close to the DCF model using FCFE in a way that we want to compute the value of equity as well. The difference here is that the cash flows are considered to be the dividends that the company is expected to pay. Gordon (1962) created this model where the value of a share would be all the future dividends per share (DPS) throughout perpetuity discounted at the cost of equity (Ke). The first DPS relates to the expected from the next period and the following DPS grow with a constant rate (g). However, this model only can be applied to companies in steady states with dividends growing at a rate that in theory can be sustained forever and cannot surpass the required cost of capital:
8 Stock Value=DPSt+1
Ke-g (12)
Damodaran (2002) points out that any expected stock price “is itself determined by future dividends, the value of a stock is the present value of dividends through infinity.” And so, the general model for the DDM should be like the following:
Stock Value=∑t=∞t=1E(DPSt)(1+Ke)t (13)
Although this general model can be more accurate, as the DPS can be assumed to be inconstant through time, it’s very hard to predict exactly what will be the future payout dividend policy for each company since this decision is very political and there can be extraordinary dividends declared. This model have another big drawback, as it doesn’t take into consideration share buybacks and, nowadays, this is a more common practice. Firms use a mix of dividend and share repurchase policies, therefore the value of a stock should reflect the value of share buybacks as well.
Ryanair has an unstable dividend payout policy. Usually they distribute extraordinary dividends that don’t follow a regular timeline and share repurchases. So, there is not any pattern about when and how much the dividends are distributed. Thus, we are not going to use the DDM to value Ryanair’s target share price.
2.3 Economic Value Added
The Economic Value Added (EVA) is a method that uses profitability of a firm and “it is computed as the product of the "excess return" made on an investment or investments and the capital invested in that investment or investments”- Damodaran (2002).
We want to compute the asset value as well and, then, deduct the net debt in order to find the equity value. The asset value is calculated by the following formula, similar to the DCF:
9 Firm’s EVA=∑ (𝑅𝑂𝐼𝐶−𝑊𝐴𝐶𝐶)∗𝐼𝐶𝑡(1+WACC)t +
Terminal Value (1+WACC)N N
T=1 (14)
With a terminal value that follows the next equation:
Terminal Value = (𝑅𝑂𝐼𝐶−𝑊𝐴𝐶𝐶)∗𝐼𝐶
𝑊𝐴𝐶𝐶−𝑔 + 𝐼𝐶𝑙𝑎𝑠𝑡 𝑝𝑒𝑟𝑖𝑜𝑑 (15)
Where IC is the invested capital, ROIC is the return on invested capital, WACC is the same weighted average cost of capital that we compute on the DCF and g is the profit growth in perpetuity. This terminal value is basically the net value of assets adding the economic value provided by future investments.
EVA creates the idea that a business is only profitable when it sets up wealth and returns for shareholders, therefore requiring performance above a company's cost of capital (measured by the WACC).
This method has its own flaws like every other. The assets and invested capital can be
manipulated just to have a “better-looking” overall economic value added. Damodaran (2002) states that “economic value added is an approach skewed toward assets in place and away from future growth”, thus, it is possible that managers attempt to increase economic value by reducing the capital invested or making riskier investments, at the expense of lower future growth.
However, we decided to use this method in order to see if there is creation or destruction in value, according to our forecasts. Looking at the final target price, we should expect a similar one compared to the DCF valuation as both models share the same mindset due to its
10
2.4 Multiples/Relative Valuation Model
Following Damodaran (2002) reasoning, “In discounted cash flow valuation, the objective is to find the value of assets, given their cash flow, growth and risk characteristics. In relative valuation, the objective is to value assets, based upon how similar assets are currently priced in the market”. We can conclude that the relative valuation takes a different approach to value a company and in practice is much more simple and intuitive than a DCF approach. However, “they are also easy to misuse” and we should choose the most appropriate multiples based on our chosen company and its industry and competitors.
The most challenging part in this model is to find similar firms to ours, since there are no identical firms within the same industry. We have to be careful when choosing a criteria having into account the risk, growth potential and cash flow differences between peers. There are pros and cons regarding the use of Multiples/Relative Valuation. In fact, it is a quick and easy method that relies in few assumptions, however, it can be challenging when there are no good direct peers or when these companies have negative earnings. Furthermore, this approach is easier to manipulate and assumes that the market is correct and we know that, often, it is a wrong assumption. Moreover, this model does not capture company-specific details, because it is based on other companies’ valuations.
2.4.1 The Peer Group
Choosing the peer group is the most difficult but important step in any Multiples Valuation. Koller et al. (2010) argue that the choice of peers should be based on companies within the same industry and then narrowing that list, refining “the sample to peers that have similar outlooks for long-term growth and return on invested capital (ROIC)”.
So, we should not only select our peers just because the industry or the countries they operate are the same and they are direct competitors.
11
2.4.2 Different types of multiples
According to Suozzo et al. (2001) there are two types of multiples:
Equity multiples: Also known as Price multiples, they express the market value of equity holders’ stake in a firm, relative to a key statistic relating to that value.
Examples of these multiples are the Price to Earnings Ratio (P/E), Price to Sales (P/S), Price to Book Value (P/BV) and Price to Cash Flow (P/CF).
Enterprise Multiples: These are related to the Enterprise Value of a company, thus they evaluate the entire business in respect to a value driver related to the whole firm. Examples of these multiples are Enterprise Value to EBITDA (EV/EBITDA),
Enterprise Value to Sales (EV/SALES) and Enterprise Value to EBITDAR (EV/EBITDAR).
The most popular multiples from the ones listed are P/E and EV/EBITDA.
The first one, is the most used since it links company value to profit and, usually, it takes into account risk and earnings per share (EPS) growth. However, whenever EPS is negative, it is very difficult to do a valuation. It is best to use when companies are more stable and surprises are not expected to occur.
The EV/EBITDA is the most popular among the enterprise multiples as it works like a price to cash flow multiple (EBITDA is a good proxy for operating CF). It is also more similar to a DCF valuation, because it uses the firm capacity to have a positive cash-flow and we perform an equity valuation by computing asset value and subtracting the net debt. The most
significant drawback related to this multiple happens when the used current CF is negative and, therefore, it is impossible to do a valuation.
For the airline industry in specific, we can still use the P/E multiple since it is still widely used, however, the best enterprise multiple is the EV/EBITDAR. It is similar to EV/EBITDA, yet, it adds the aircraft renting costs to the EBITDA, meaning that we use the earnings before interests, D&A and rent/lease expenses. It is particularly useful, since this rent is also a
non-12 cash expense and, thus, it shouldn’t be included when we look into an airline’s operational performance.
Despite being a more static and inaccurate method, with all the other downfalls that we have discussed, we are still going to use the multiples model to value Ryanair’s share value and compare it with the value from the DCF WACC, using the EV/EBITDAR and P/E multiples.
3. Overview
In this section we will discuss in detail the major issues and historical performance of the airline industry, with particular focus on the low-cost carriers. Then, we will compare these LCCs with the full-service airline and, to complete this macro environment study, we will do a Porter’s Five Forces analysis related to this industry.
Afterwards, a brief company overview will be addressed as well, including a SWOT analysis, in order to analyze the impacts of historical data and future strategy on Ryanair’s forecasts. Both of these elements will be useful to understand our forecasts and the impact that can have in our assumptions.
3.1 Industry Overview
The airline industry is known for its intense competition between companies with a greater focus on the price and cost reduction, which leads to more efficiency. In terms of number of passengers, it has been rising since people are willing to travel more often. Huge reduction in fare tickets compared with previous decades shaped a new perception to the general public in which air travelling can be even cheaper than travelling by other mean of transportation. New business models and technological improvements, that lead airlines to achieve greater
efficiency, have been helping this overall customer growth all around the world and, therefore, a rise in total market.
13 From the beginning of commercial air traffic, this industry have been growing a lot, and surpassing crisis times where recession had greater impact on other transportation industries (e.g. the automotive industry).
The air transportation industry has increased their revenues worldwide in the last ten years from 510 billion dollars in 2007 to around 754 billion dollars in 2017. As opposed to previous years until 2014, where net margins were negative or up to about 2%, profit margin increased from 1,8% in 2014 to 5% in 2015, and it has been more stable since then (4,6% in 2017):
Graph 1: Evolution of Revenues (billions of dollars) and Net Margins (%) (source: IATA)
There is still a lot of room to improve since this value is not convincing enough, as an industry average. It occurs because of the intense competition between airlines (intense fares competition) and the high costs that the industry is subject to, mostly dependent on the high volatility in fuel and oil prices.
It was also since 2014 that investors finally saw their investment being returned on an average rate above its cost of capital. The following graph shows us that ROIC achieved an expected value of 8,8% in 2017 while WACC is expected to be 7,9% relatively to the whole return on capital invested in airlines all over the world:
-6% -4% -2% 0% 2% 4% 6% 0 100 200 300 400 500 600 700 800 900 2007 2008 2009 2010 2011 2012 2013 2014 2015 2016 2017E
14
Graph 2: Evolution of WACC vs ROIC as a % of invested capital in airlines (source: IATA)
The decline in ROIC from 2016 to 2017 was driven by a rise in breakeven load factors, as unit costs are now rising, and a moderate fall in achieved load factors, as demand slows more than capacity growth. Nevertheless, the level of profitability is still very high for the standards of the industry and it’s following the recent trends with much more focus on generating an adequate Return on Capital.
3.1.1 LCCs Market
Low Cost Carriers (LCCs) are one of the newest business models in the industry. They have been increasing its significance since the 1990s and have played a big role in the expansion of the airline industry. This low cost model focus on reducing costs: secondary airports, quick transfers in airports, no-frills fares and charges on all extra services, from reserved seat to early check in. LCCs usually fly on short-haul routes, so they can return to its hub and avoid unnecessary costs on other airports.
As explained before, LCCs are growing in percentage of total share of seats, but this number differs between regions:
15
Graph 3: LCC share of total seats by region (source: Innovata 2017 FEB and Boeing)
Analyzing graph 3, we notice the predominance of budget airlines in Southeast Asia, which is the only region that has more LCCs than any other type of airline. In this region, the whole air transportation market is growing a lot due to tourism and the biggest LCC player is AirAsia. In other regions like Europe, North America and Oceania (all developed economies), we can conclude that the LCCs have a good representation in market share of about one third of the whole market and it is expected to further increase in the upcoming years.
Africa, Middle East and China still have the highest room to improve as budget carriers are clearly not so relevant especially because of liberalized air spaces and market access barriers. If regulation in these regions change over time, we can expect a tremendous evolution of LCCs and less share of traditional airlines.
The three biggest companies in Europe – by order Ryanair, EasyJet and Norwegian -
represent more than half of all LCC movements in this continent. It was rumored in 2017 that these three big players could partner and join forces in order to rival with Full Service
Airlines like British Airways and Emirates and go to long-haul routes as well, but still keeping the low-cost model. These synergies could be useful and serve as a barrier for upcoming competition, however, Ryanair and Norwegian disagreed on this subject and the “low-cost alliance” didn’t go through.
16 Regarding airports, we can highlight the top five with the largest numbers of LCC movements per day in Europe, according to EuroControl: Barcelona (with 201 000 flights), London Gatwick, London Stansted, Dusseldorf and Istanbul Sabiha Gokcen (with around 130 000 arrivals and departures).
A new segment is looming in this market: the low cost long haul segment. For instance, in the European market, some airlines are starting to operate long distance routes (mostly
transatlantic for the moment) with low-cost operations. Norwegian, which had intentions to partner with the other big two as discussed, is the best known airline in this segment having bases in Norway and in the UK and flying to the USA directly. Most of these routes are operated from and to smaller airports to reduce operating costs. However, the gain in this segment compared to low-cost short-haul is much weaker due to flying time restrictions, taxes and working-time limits.
This novelty means that the market can change in the upcoming years with extended growth, leading to greater adaptability that airline firms will face, having into account possible mergers and new competitors.
3.1.2 LCCs vs FSAs
Full Service Airlines (FSAs), considered the traditional way of flying, still dominate this industry. The business model differs as it relies almost exclusively in the fare tickets that are sold (scheduled revenue) as opposed to the low cost carriers that rely heavily upon in-flight revenue as well. Although the competition is growing too, the FSAs usually practice higher fares than the LCCs, however, the in-flight service is more complete and the passenger gets more benefits that are already included in the price. Usually it has a distinction between economic and premium (business) seats and, relatively to the distance travelled, it can vary from short to medium to long haul distances, as opposed to the majority of LCCs where flights are short to medium haul.
As we can see in graph 4, LCC is growing very fast in the last years (around 10% growth from 20% in 2007 to 30% in 2016) as opposed to the FSAs, where its market share have been reducing almost symmetrically (from 60% in 2007 to around 50% in 2016). Moreover, Low
17 Cost carriers continued its growth in periods where the economy was low, as opposed to Traditional Scheduled carriers:
Graph 4: Evolution of LCCs vs FSAs in terms of market share (source: StatFor)
Nowadays, these Business models are adapting in both directions in order to achieve a higher stake on the market by attracting to more groups of customers. For instance, LCCs are
increasingly flying from major airports to attract customers from the FSAs, and even Ryanair is now experimenting it with connecting flights. Meanwhile, Full Service carriers are
increasingly unbundling their offers such as the ones from low-cost, like seat choice, checking baggage separately and food selling.
To conclude, airlines tend to be highly leveraged businesses, operationally and financially, therefore their earnings stream is quite volatile and may not reach investors’ pockets. However, on more recent years, shareholders have been recouping their investments more frequently as airlines tend to be more attractive than before, with special focus to budget carriers since they continue to grow.
18
3.1.3 Porter’s Five Forces Analysis
Bargaining Power of Suppliers is high due to the fact that the three most important inputs that airlines have - fuel, labor and aircraft - are all affected by the external environment. Fuel and oil prices are very volatile and hard to predict, labor is subject to the power of unions who often bargain and get costly concessions from airlines and the aircraft is always necessary whether to buy or to lease, meaning that airlines have to depend on few companies that provide these needs (in a market that is vastly dominated by Airbus and Boeing). So, airlines depend very much on their suppliers to perform well and in the most efficient way possible, thus, the switching costs would be high.
Bargaining Power of Customers is high because, nowadays, it is easy to compare fares between different airlines due to the proliferation of online ticketing and distribution systems and, hence, customers don’t face switching costs. Despite some companies provide loyalty benefits, it’s still free to choose another company to fly, and that can be more advantageous to the customer.
Threat of New Entrants is low mainly because of two big arguments. The first one is the high investment a new airline would need, not only on the aircraft but also on other high fixed costs and labor expenses. Also, new entrants will probably take losses for some years because the whole business model (whether it is budget or full service) takes time to learn and master. The second argument is related with slots and available routes: the most relevant airports usually have all their slots occupied and some routes have a maximum level of movements allowed per day. A new entrant would have to negotiate with companies in a secondary market for already occupied slots and that requires also a great amount of investment. Threat of Substitutes is low because, nowadays, there is no other mean of transportation than can take people from one place to another so quickly and cheaply as an airplane. For medium to longer distances, the air travel will be necessary so this threat remains low, however, on short hauls, public transportation or car travelling can be cheaper (although slower). With the emergence of LCCs, sometimes, even short distances stand cheaper than travelling by other transport, but it always depends on the demand given a specific day and what it’s more convenient to the customer. Still we consider this threat of substitutes to be more on the low side given all conditions.
19 Rivalry among existing competitors is high, mainly because of the quick growth and
attractiveness of low cost carriers in the market. In this industry, there are several barriers to exit, such as sunk costs (fixed costs that are not recoverable in the case of an exit), high costs for staff layoff and long-term contractual obligations to suppliers. It is also common to have alliances or mergers between two or more firms so that they can better dominate a market. This means that airlines will remain in the business for a very long timeframe, even if it is not profitable and, so, competition stays really intense on every type of market in this industry.
3.2 Company Overview
Ryanair Holdings PLC is a private listed company in the Irish Stock Exchange.
Founded in Dublin, Ireland, in 1984, it is currently the leading and the biggest individual airline in Europe, transporting more than 100 million of customers per year on over two thousand flights every day, connecting 215 destinations in 36 countries (mostly European, but also Morocco, Israel and Jordan). It is one of the most punctual airlines with 88% flights on-time in fiscal year 2018 (ended on March) and it is the airline that cancels fewer flights in Europe.
Ryanair is a single-line business company. Simply put, the firm looks to offer its customers the lowest possible fare by making sure that it is as efficient as possible in terms of costs. The intention is to continue the trend of lowering the average fares, despite the rise in fuel costs. Contrary to other LCCs, Ryanair will continue to pursue the lowest selling price even if costs do arise. From FY17 to FY18 the average fare fell 3% to 39,4 euros.
This airline also provides many ancillary services, which accounted for about 28% of total revenue in FY2018, from non-flight scheduled services to in-flight sale of food and beverages or providing accommodation and car renting services via their website.
Under the leadership of Michael O’Leary, CEO of the company since January 1994, the company achieved, in the 2018 fiscal year, a profit on ordinary activities after taxation of 1450,2 million euros and an average book passenger load factor of 96%, consolidating its position as the largest European airline by passengers transported, roughly tied with Lufthansa Group (currently around 130 million passengers in the most recent fiscal year).
20 Ryanair’s strategy previously included flying to and from secondary airports (lower handling fees and taxes) which are not always the most convenient for customers from both a distance and cost perspective. However, Ryanair’s strategy is evolving towards a stronger presence in primary airports, such as Frankfurt International or Amsterdam Schiphol. It is only possible to pursue this strategy if new slots at airports are acquired or if Ryanair can swap slots with other carriers. It requires big investments and trades but it’s the only way to continue to expand destinations in Europe and possibly to other regions in the future.
Aircraft ownership and maintenance costs are relatively low as Ryanair have obtained very significant discounts from Boeing as it orders 100+ aircrafts at a time (e.g. ordered 110 in 2014 that will be delivered until 2024) exclusively Boeing 737-800, and now the new Boeing 737 Max, which should deliver an additional 16% improved fuel seat mile costs. These deals are win-win situations for Ryanair and Boeing and so, this is the reason why Ryanair prefers to own most of its fleet instead of leasing or renting. Only about 9% of all aircrafts are leased, contrary to the global average tendency that it had grown considerably until 2008 but
stagnated since then until 2017, where it situates on about 45% leased fleet of all operating fleet:
Graph 5: Operating lease fleet in absolute numbers and as a % of total fleet 1990-2017 (source: KPMG and Flight Ascend Consultancy)
21 For Ryanair, leasing is only preferred whenever there is some capacity shortage issue as it is the most convenient and quickest way to overcome the problem.
Since 2013, Ryanair has been growing on a sustainable way as we can observe in graph 6:
Graph 6: Ryanair’s share price performance 2013-2018 (source: Thomson Reuters)
It has growing from a stock price of 6 euros at the end of FY13 to 16 euros at the end of the current fiscal year. Its maximum price was reached on August 2017, corresponding to 19,39€. Since then, price has been dropping to some extent, but we believe that in the future it will go much further. This drop in stock price is associated with flight cancellations that had to happen in order to cope with pilot shortages and to avoid punctuality issues. Ryanair is loyal to its business model and to improve its system-wide punctuality while dealing with pilot and air traffic control strikes, hundreds of flights from September until October were cancelled. Although labor issues have been damaging some reputation to Ryanair more recently, we believe that they will overcome those problems and continue its development like it’s happening since the beginning of 2018.
22
3.2.1 SWOT Analysis
Ryanair’s main strength, which is the core of its business, is its low fare policy and all low cost practices. Along with EasyJet, they are the most powerful budget carriers in Europe and they have an agreement not to compete against each other in the same routes. Ryanair also uses a single model aircraft (Boeing 737) that it’s being expanded to more environmental friendly aircrafts like we discussed earlier, which allows them to practice economies of scale. Besides other strengths that we have pointed out before, we can highlight Ryanair’s quick turnaround strategy between flights and their extensive online ticket reservation system in which customers can manage their itineraries without relying on a travel agent that translates into further cost savings.
Despite the fact that Ryanair is among the most successful low-cost airlines in the world, its cost conscious focus created a series of weaknesses. Firstly, the company’s dependency on new taxes, regulation and oil commodity prices each year is real in order to keep the lowest prices. Secondly, Ryanair is accused of having tricky service agreements to increase ancillary revenues (e.g. ambiguous baggage policies) and unfair pricing practices that mislead
customers. This issue downgrades the corporate’s relation with media, as Ryanair is treated as an uncaring airline with poor customer service. Other major weakness comes from the fact that Ryanair is still operating its majority of flights through secondary airports, meaning that the client will have to ride bigger distances to reach his final destination on the city center. In terms of opportunities, we can highlight the exploration of new markets, like the new segment: long-haul low cost. With the massive aircraft orders in 2014 (to be delivered over ten years) and the new agreements between US and Europe, transatlantic flights can be a possibility in the future for Ryanair and it can be the beginning of long distance region market’s penetration. Furthermore, the opportunity to increase ancillary revenues and customer loyalty through the app MyRyanair is noticeable and it can be really important, in the future, to further reduce fares.
Regarding threats, first, we have the Brexit uncertainty and all the consequences it carries. Ryanair fears the possibility of UK leaving the EU Open Skies agreement, without clarifying negotiations in time, and this could result in a disruption of flights between Europe and UK for a period of months from April 2019 onwards (sales from the UK accounted for
23 labor strikes and the impact that might have on the reputation and credibility of the brand regarding staff management and customer management, because flights can be cancelled. Finally, fuel prices volatility, currency movements (in particular the pound's exchange rate against the euro) and any external event that influences the demand for air travelling (e.g. terrorist threats or an economic recession) can threaten Ryanair’s future sustainability.
4. Forecasts
In this chapter we will talk about the main drivers of our valuation, explaining some assumptions used to predict each component of Ryanair’s business. In order to value the company in the most accurate way, we focused on forecasts relative to the income statement, balance sheet and cash flow statement, clarifying all the computations made to get the best possible estimate.
Note: Since the Annual Report for FY18 has not been released yet, we are going to use unaudited data for this year, therefore, we shall refer to expected values.
4.1 Operating Revenues
Ryanair has been pursuing an exhaustive strategy with competitive prices in the last 10 years, as referred in the latest annual report. This strategy includes some leases, handbacks and, mainly, buying contracts with Boeing that will last at least until 2024. The major target of the company is to reach 200 Million passengers by 2024. As our results will show, we forecast this objective to be possible in 2024 as expected and, therefore, we will project our forecasts for the following six years (2019 to 2024), taking into account the latter as the final year of our explicit period (just before the steady state):
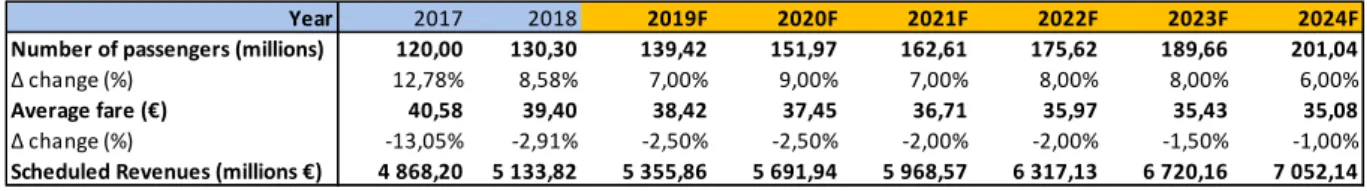
Table 1: Forecast of Scheduled Revenues 2017-24 (source: Own computations)
Year 2017 2018 2019F 2020F 2021F 2022F 2023F 2024F Number of passengers (millions) 120,00 130,30 139,42 151,97 162,61 175,62 189,66 201,04 Δ change (%) 12,78% 8,58% 7,00% 9,00% 7,00% 8,00% 8,00% 6,00% Average fare (€) 40,58 39,40 38,42 37,45 36,71 35,97 35,43 35,08 Δ change (%) -13,05% -2,91% -2,50% -2,50% -2,00% -2,00% -1,50% -1,00% Scheduled Revenues (millions €) 4 868,20 5 133,82 5 355,86 5 691,94 5 968,57 6 317,13 6 720,16 7 052,14
24 In table 1, we can see the historical 2 years and the explicit period scheduled revenues as a product of the number of passengers and the average fare. We can expect an increase in the next years as Ryanair is always seeking to capture the most demand with its business model. Furthermore, with the expansion in routes and the expansion of aircraft fleet (until FY24 where the contract with Boeing expires), we believe that the airline is going to fulfill its objective by having 201 million passengers in FY24. Hence, from 2025 on, we should expect a slowdown in investments and passenger growth.
The average fare has been reducing over the past years, with special impact on FY16 to FY17 where it dropped 13%. It happened mostly because of the plunging British pound in relation to euro as a consequence of the Brexit referendum. This situation has stabilized and it’s reflected in this fiscal year, where the average fare dropped 2,91%. For future years until 2024, we believe that fares will continue to decline, as it is the intention of Ryanair, however, it will drop at a lower rate since costs might arise. Afterwards, on the steady state, we think that fares may not change or can even increase.
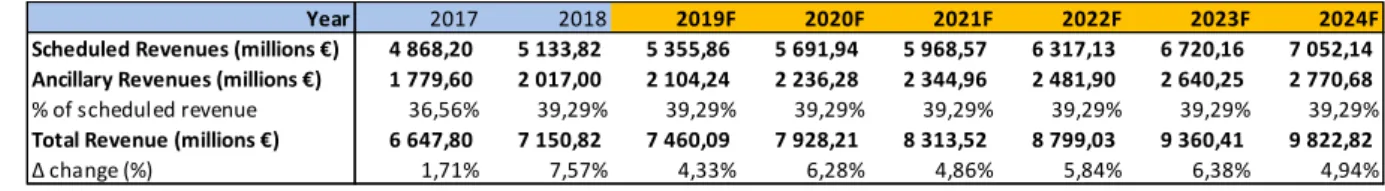
Besides scheduled revenues, Ryanair’s business model includes ancillary revenues as well like any other low-cost carrier. It includes non-flight scheduled services, in-flight sales and internet-related business. In the most recent FY it amounted to 39% of scheduled revenues and about 28% of total revenue. The airline wants to increase ancillary revenues by
implementing many strategic initiatives to improve customer service offering, such as:
reserved seating, car hire, priority boarding and on-board sales. Thus, we expect this source of revenue stream to grow up each year and, so, we used the FY18 percentage of scheduled revenues as the reference for future years’ ancillary revenue:
Table 2: Forecast of Total Revenue 2017-24 (source: Own computations)
Year 2017 2018 2019F 2020F 2021F 2022F 2023F 2024F Scheduled Revenues (millions €) 4 868,20 5 133,82 5 355,86 5 691,94 5 968,57 6 317,13 6 720,16 7 052,14 Ancillary Revenues (millions €) 1 779,60 2 017,00 2 104,24 2 236,28 2 344,96 2 481,90 2 640,25 2 770,68 % of scheduled revenue 36,56% 39,29% 39,29% 39,29% 39,29% 39,29% 39,29% 39,29% Total Revenue (millions €) 6 647,80 7 150,82 7 460,09 7 928,21 8 313,52 8 799,03 9 360,41 9 822,82 Δ change (%) 1,71% 7,57% 4,33% 6,28% 4,86% 5,84% 6,38% 4,94%
25
4.2 Operating Expenses
Regarding operating expenses, Ryanair has eight different accounts and, the following pie chart, demonstrates the weight of each expense in relation to the total:
Graph 7: Weight of each expense on total operating expenses (Source: 2018FY Ryanair Results)
Staff costs, which consists primarily on salaries, wages and benefits, increased by 17% in the latest fiscal year, and 7% on a per passenger basis. These changes are related primarily to the increase in pilot salary since October 2017. We expect these costs to increase for the future and, so, we used a fixed percentage of revenues equal to the one in FY18.
In absolute terms, Ryanair’s depreciations rose 13%. However, on a per passenger basis, it increased by 4%, which is in line with the increase in aircraft fleet. We forecast this category assuming an average % of depreciation and amortizations from the last five years (2014-2018).
Fuel and oil costs per passenger decreased 8%, while in absolute terms, they just fell by 1%. Ryanair has entered into contracts to protect itself from changes in fuel prices, generally by
26 signing forward contracts covering up to 24 months of anticipated fuel need. For example, on March 2018, Ryanair had already some arrangements to cover 90% of the fuel required until the end of March 2020. Despite expected decreases on the oil price exposing Ryanair to hedging losses, we assume the value would be similar to the last year % from total revenues, for 2019 and 2020. For the remaining years, we computed an average % of revenues for the previous 5 years (2016-2020), which means that fuel costs will arise from FY21 to FY24 and that’s going to have a considerable impact to profits and generated cash flows.
Maintenance, materials & repairs costs consist, basically, on “the cost of routine
maintenance provision for leased aircraft and the overhaul of spare parts”. In absolute terms, these expenses increased by 5%, however they decreased by 3% on a per passenger
calculation due to fewer leased aircraft in the fleet and the timing of checks.
Aircraft rentals is the category that we talked about in the company overview section. Since leased airplanes only accounts, currently, for 9% of all operating fleet, its costs are relatively small and they decreased 4% from last year to FY18 in absolute terms, while falling by 12% per passenger.
Route charges rose 7% to 701,8 million euros, in line with the 7% increase in sectors. Relatively to a per passenger analysis, this expense just dropped by 1%.
Airport and handling charges per passenger tend to be a regular item. Since this costs should increase in line with the traffic growth, then we can understand why they remained the same expense per passenger compared with FY17, increasing 9% in absolute terms just like the increase in passengers. Therefore, we forecasted future values based on the increase in traffic.
Ryanair’s marketing, distribution and other expenses include some costs also applicable to ancillary revenues and it has majorly increased by 27% on the latest fiscal year (reflected with an increase by 17% on a per-passenger basis as well). These changes are mostly related with non-recurring costs from flight cancelations (September and October 2017), as “passengers have a higher propensity to claim than in prior years”. We expect that these negative events and controversy may occur in the future, hence, we forecasted this item the same way we did with the staff costs.
27 Regarding previsions for Maintenance, Materials and Repairs, Aircraft Rentals and Route Charges, we computed a fixed rate based on the historical 5 year-average percentage of revenues.
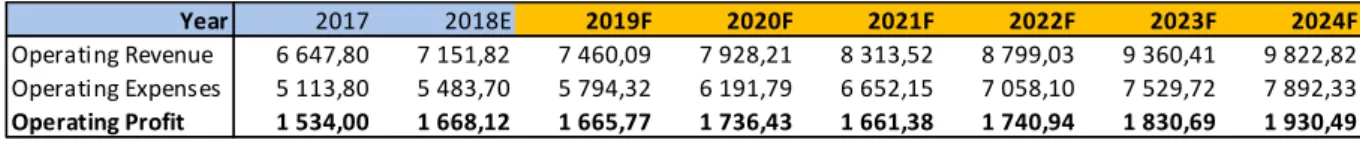
Table 3: Forecast of Operating Profit on absolute terms in M€ (source: Own computations)
In table 3, we can check that operating profit is steadily growing, with exception in FY21, where the impact of fuel expenses are most noticeable. However, if we repeat this study with a profit per passenger analysis, we can verify that the margins will drop in future years
following the same trend since 2017. It means that the traffic is growing at a much higher rate compared to the EBIT:
Table 4: Forecast of Operating Profit on a per passenger basis (source: Own computations)
4.3 Payout Policy
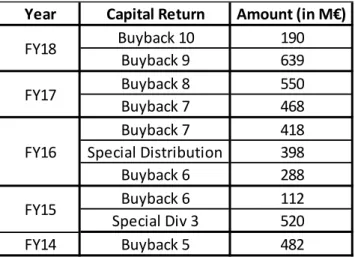
Since its incorporation as the holding company for Ryanair in 1996, this airline has only occasionally declared special dividends on both its Ordinary Shares and ADRs. Besides this, Ryanair distributes wealth to its shareholders through share buyback programs. Regular dividends are not a part of the firm’s payout policy. The next table gives us a perception of how much money was distributed from FY14 to FY18:
Year 2017 2018E 2019F 2020F 2021F 2022F 2023F 2024F Operating Revenue 6 647,80 7 151,82 7 460,09 7 928,21 8 313,52 8 799,03 9 360,41 9 822,82 Operating Expenses 5 113,80 5 483,70 5 794,32 6 191,79 6 652,15 7 058,10 7 529,72 7 892,33 Operating Profit 1 534,00 1 668,12 1 665,77 1 736,43 1 661,38 1 740,94 1 830,69 1 930,49 Year 2017 2018E 2019F 2020F 2021F 2022F 2023F 2024F Operating Revenue 55,40 54,89 53,51 52,17 51,13 50,10 49,35 48,86 Operating Expenses 42,62 42,09 41,56 40,74 40,91 40,19 39,70 39,26 Operating Profit 12,78 12,80 11,95 11,43 10,22 9,91 9,65 9,60
28
Table 5: Historical Ryanair's payouts (Source: 2018FY Ryanair Results)
We verify that the payout has been rising each year, with exceptions in 2016 and 2018. In FY16 the value is so high due to the special distribution related to the Aer Lingus’ sale. In FY18 the payout lowered because of the Buyback 10. It is expected to be distributed a total of 750M € throughout the year, however, only 190 million have been allocated until March 2018. In general, these high payout ratios mean that the company prefers to distribute wealth instead of reinvesting in a higher rate:
Table 6: Historical Payout, Number of shares, DPS and Dividend Yield (source: Own computations)
The historical amount of dividends per share has been rising as well (with exception for FY18) due to the fact that, not only payouts have been growing, but also the number of shares outstanding has been lowering (with an average variation of -3,71%). In the most recent year, the return on investment for a stock (dividend yield) is 4,34%. It is a good indicator for investors as it yields a high return for this industry (around 1,65% for the whole airline
industry in Europe according to Damodaran) for every euro invested. This industry value only reports for dividends and not for stock repurchases. Therefore, if we account this ratio as a
Year Capital Return Amount (in M€)
Buyback 10 190 Buyback 9 639 Buyback 8 550 Buyback 7 468 Buyback 7 418 Special Distribution 398 Buyback 6 288 Buyback 6 112 Special Div 3 520 FY14 Buyback 5 482 FY18 FY17 FY16 FY15 Year 2014 2015 2016 2017 2018 Payout (M€) 482 632 1104 1018 829 Share Price at FY (€) 7,351 11,1691 14,165 14,525 16 Number of shares (M) 1414,6 1384,7 1341 1249,7 1193,5 Δ change in shares (%) -1,97% -2,11% -3,16% -6,81% -4,50% DPS (€ per share) 0,34 0,46 0,82 0,81 0,69 Dividend Yield (%) 4,64% 4,09% 5,81% 5,61% 4,34%
29 “capital return” yield like we did with Ryanair, it would hold a higher value, yet, still lower than Ryanair’s.
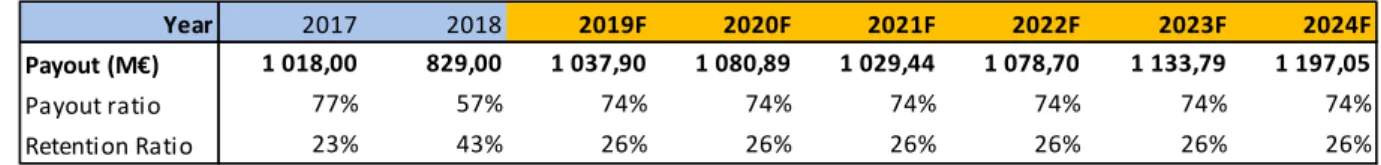
As we don’t expect any similar event in the future, relative to the event happened in 2016 (and, thus, special distribution), we believe that the payout will grow more or less in line with the net income expansion. From FY19 to FY25, we decided to compute our payout
predictions based on the last 5 years average payout ratio (payout/net income) and we ended up with a ratio of about 74%:
Table 7: Forecast of Payouts 2017-24 (source: Own computations)
4.4 Capital Expenditures
The main component of Capital Expenditures is the acquisition of new airplanes (main investment). Secondary investments include expenditures on hangar and buildings, plant & equipment, fixtures and fittings, motor vehicles. All of these expenditures affect Plant, Property & Equipment (PPE). Finally, we have long term financial investments as the third component of CAPEX.
On both primary and secondary investments, we computed CAPEX like this:
CAPEX(T)=PPE(T)–PPE(T-1)+D&A(T) (16)
We forecasted the value of Aircraft and Motor Vehicles based on the variation in the number of closing fleet expected by Ryanair’s management:
Year 2017 2018 2019F 2020F 2021F 2022F 2023F 2024F
Payout (M€) 1 018,00 829,00 1 037,90 1 080,89 1 029,44 1 078,70 1 133,79 1 197,05
Payout ratio 77% 57% 74% 74% 74% 74% 74% 74%
30
Table 8: Planned closing fleet 2018-24 (source: Ryanair 2017FY Annual Report)
For the remaining PPE items, we forecasted them based on the expected customer traffic growth.
The rate of depreciation was already explained before (6,9% for each PPE).
The value forecasted upon financial investments is always 0 since we assume that the
company will not pursue financial investments like it happened in the last three fiscal years (it ended in 2015 due to the sale of the stake in Aer Lingus). Hence, the value of Capital
Expenditures will be the same with or without this type of investments.
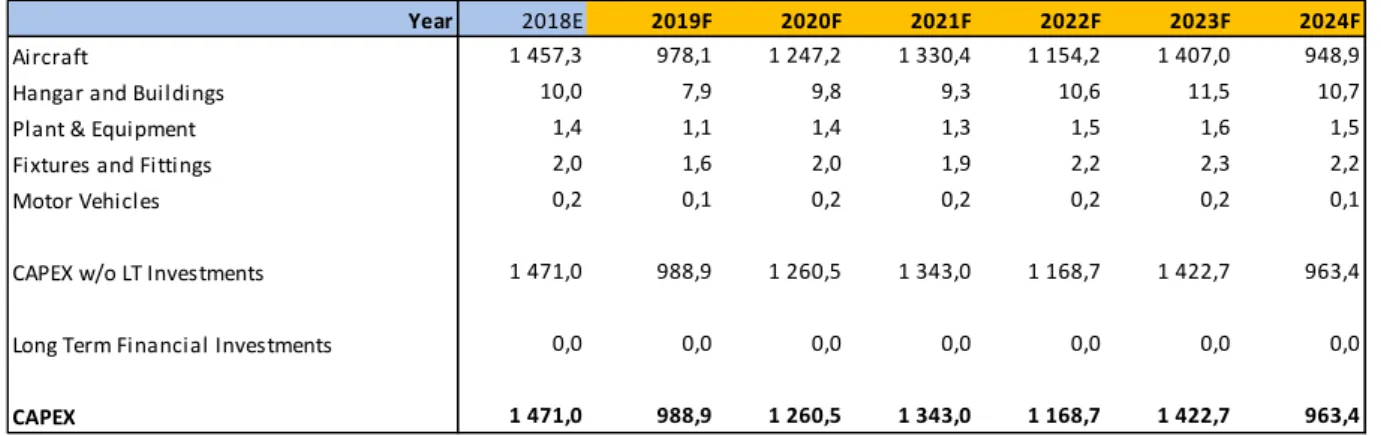
Below, we conclude that the value of CAPEX will decrease more in FY19 and FY24, especially due to the lesser amount of investments in aircraft (table 8), compared with the previous FY:
Table 9: Forecast of Capital Expenditures 2018-24 (source: Own computations)
Year 2018 2019F 2020F 2021F 2022F 2023F 2024F Opening fleet 383 427 448 481 516 540 575 Deliveries under 2013 Boeing contract 50 29 - - - - -Firm deliveries under 2014 Boeing contract - - 39 19 21 20 11 Option Aircraft under 2014 Boeing contract - - 8 25 28 25 14 Planned returns or disposals -6 -8 -14 -9 -25 -10 -15
Closing fleet 427 448 481 516 540 575 585 Δ change (%) 12,62% 4,92% 7,37% 7,28% 4,65% 6,48% 1,74%
Year 2018E 2019F 2020F 2021F 2022F 2023F 2024F Aircraft 1 457,3 978,1 1 247,2 1 330,4 1 154,2 1 407,0 948,9 Hangar and Buildings 10,0 7,9 9,8 9,3 10,6 11,5 10,7 Plant & Equipment 1,4 1,1 1,4 1,3 1,5 1,6 1,5 Fixtures and Fittings 2,0 1,6 2,0 1,9 2,2 2,3 2,2
Motor Vehicles 0,2 0,1 0,2 0,2 0,2 0,2 0,1
CAPEX w/o LT Investments 1 471,0 988,9 1 260,5 1 343,0 1 168,7 1 422,7 963,4
Long Term Financial Investments 0,0 0,0 0,0 0,0 0,0 0,0 0,0
31
4.5 Net Working Capital
Net Working Capital is a measure of short-term liquidity and it is equal to the difference between current assets and current liabilities. However, current financial assets and financial debt are not included for this calculation, as they aren’t related to the ongoing operations of the firm. Therefore, we removed items such as Restricted cash, Cash and cash equivalents and Current financial assets for the assets side and Current maturities of debt for the liabilities side.
Derivative financial instruments were included because they play an important role on the operational business activity as well, since Ryanair has already some fuel, oil and price peaks hedging contracts planned until 2024:
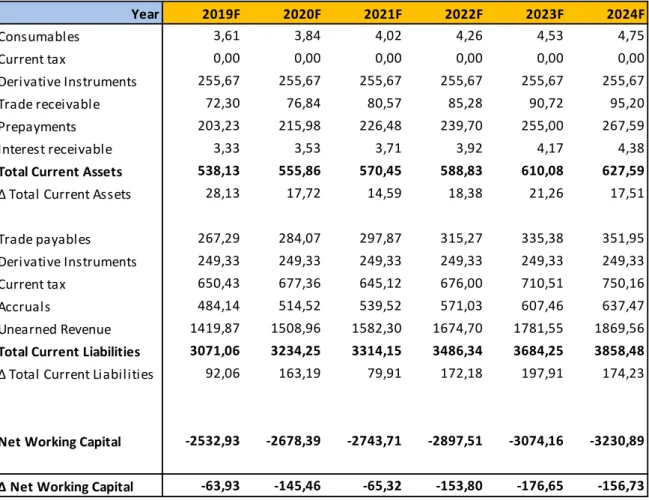
Table 10: Forecast of Net Working Capital 2019-24 (source: Own computations)
Year 2019F 2020F 2021F 2022F 2023F 2024F Consumables 3,61 3,84 4,02 4,26 4,53 4,75 Current tax 0,00 0,00 0,00 0,00 0,00 0,00 Derivative Instruments 255,67 255,67 255,67 255,67 255,67 255,67 Trade receivable 72,30 76,84 80,57 85,28 90,72 95,20 Prepayments 203,23 215,98 226,48 239,70 255,00 267,59 Interest receivable 3,33 3,53 3,71 3,92 4,17 4,38
Total Current Assets 538,13 555,86 570,45 588,83 610,08 627,59
∆ Total Current Assets 28,13 17,72 14,59 18,38 21,26 17,51
Trade payables 267,29 284,07 297,87 315,27 335,38 351,95
Derivative Instruments 249,33 249,33 249,33 249,33 249,33 249,33
Current tax 650,43 677,36 645,12 676,00 710,51 750,16
Accruals 484,14 514,52 539,52 571,03 607,46 637,47
Unearned Revenue 1419,87 1508,96 1582,30 1674,70 1781,55 1869,56
Total Current Liabilities 3071,06 3234,25 3314,15 3486,34 3684,25 3858,48
∆ Total Current Liabilities 92,06 163,19 79,91 172,18 197,91 174,23
Net Working Capital -2532,93 -2678,39 -2743,71 -2897,51 -3074,16 -3230,89
32 Operational current liabilities are always much higher than current assets and they are
growing at a higher rate (average 1,5% per year), meaning that the change in NWC is always decreasing. These negative values in NWC are very common in the airline industry, as most carriers collect the money at the time of booking which is considerably before the company provides the actual transportation service to customers. Hence, the value for unearned revenue will have a major impact as a current liability. Furthermore, since Ryanair is a large firm and has a considerable bargaining power to its suppliers, it can obtain longer credit periods.
4.6 Debt
Total Debt equals current maturities of debt (current portion of long-term debt) plus total long-term debt (non-current). In March 2018, Ryanair had a debt value of 3 964 M€ and in the Balance Sheet we can verify that this value does not follow the steady growth from previous years. We calculated future debt (both short-term and long-term debt) based on the average percentage of total assets from last five years. As the D/A ratio has been relatively stable historically (ranging from 0,32 to 0,37), we basically predicted future debt based on the 5-year average D/A that equals to 0,35.
On the opposite side, we have the interest expenses that have been decreasing throughout time. However, we forecasted future interest payments as the 5-year average % of total debt. Therefore, the interest expense is expected to rise in the future because the Debt will also increase in conformity with the Assets.
Regarding issued bonds, Ryanair has 2 450 million € in three unsecured Eurobonds issued in 2014, 2015 and 2017 with maturity dates between 2021 and 2023.
Finally, relatively to operating lease obligations, we don’t know the value for this year, as debt details have not been released yet.
4.7 Tax Rate
Ryanair pays taxes in Ireland, thus it is acceptable to say that taxes will act according to the statutory Irish rate of 12.5%. Even though there are some fluctuations from last five years,