Universidade de Aveiro Departamento de Eletrónica,Telecomunicações e Informática 2020
Manuel Alejandro
De Oliveira Da Costa
Abordagens computacionais para o estudo da fala na
comunicação em grupos.
Computational approaches to study speech
Universidade de Aveiro Departamento de Eletrónica,Telecomunicações e Informática 2020
Manuel Alejandro
De Oliveira Da Costa
Abordagens computacionais para o estudo da fala na
comunicação em grupos.
Computational approaches to study speech
communication in groups
Dissertação apresentada à Universidade de Aveiro para cumprimento dos requisi-tos necessários à obtenção do grau de Mestre em Engenharia de Computadores e Telemática, realizada sob a orientação científica do Doutor Samuel de Sousa Silva, Investigador no Instituto de Engenharia Electrónica e Informática de Aveiro (IEETA) da Universidade de Aveiro, e da Doutora Susana Manuela Martinho dos
o júri / the jury
presidente / president Professor Doutor Joaquim João Estrela Ribeiro Silvestre Madeira professor auxiliar da Universidade de Aveiro
vogais / examiners committee Professor Doutor Alberto Abad Gareta
agradecimentos /
acknowledgements Agradeço aos meus orientadores, Samuel Silva e Susana Brás, por toda aorientação e acompanhamento que me proporcionaram ao longo deste ano. A toda a comunidade científica cujo trabalho contribui para o desenvolvimento do nosso conhecimento e da nossa percepção sobre o Mundo que nos rodeia. À Universidade e à cidade de Aveiro por me terem disponibilizado as condições ideais para estudar e desenvolver como pessoa.
À minha família, que me deram a possibilidade de viver e completar esta etapa. Nomeadamente aos meus pais, que sem o esforço e sacrifício deles nunca poderia estar aqui nem poderia aspirar a ser o que sou.
Aos meus irmãos, por serem o melhor exemplo que se pode ter e por me apoiarem incondicionalmente ao longo de todas as caminhadas.
Aos meus sobrinhos por toda a alegria que trouxeram ao Mundo que, sem dúvida, é um lugar muito mais rico desde então.
Aos meus amigos, especialmente ao Minsky e ao Pec, por todas as experiências partilhadas ao longo destes anos em todas as partes do Mundo. Ao Ruben, pelas inúmeras conversas e por toda a ajuda que sempre me providenciou.
Palavras Chave Áudio, Processamento de fala, Comunicação, Voz, Dinamicas de Grupo, Proces-samento de Sinal, Aprendizagem Não-Supervisionada
Resumo Grupos são entidades importantes na nossa vida quotidiana, seja em contextos sociais, como em família, ou profissionais, como no trabalho. A nossa identidade é moldada pelos diversos grupos aos quais pertencemos, do mesmo modo que a identidade destes é caracterizada pelos seus membros.
As interações entre os elementos de um grupo criam um conjunto de dinâmicas inter-pessoais que têm um impacto direto no desempenho das tarefas realizadas pelos mesmos. A produtividade dos grupos correlaciona-se com as dinâmicas exis-tentes, onde a comunicação tem um papel central.
O desenvolver da comunicação no grupo evidencia as suas dinâmicas existentes e a maneira como as mesmas evoluem ao longo do tempo. Estudando estas dinamicas é possível compreender melhor as mecânicas de funcionamento do grupo que, por sua vez, podem explicar alguns fenómenos, como a qualidade do trabalho desen-volvido em equipa.
A comunicação permite aos elementos do grupo expressar as suas ideias, crenças e sentimentos, possibilitando a articulação do trabalho desenvolvido pelo grupo. A fala, sendo a nossa forma mais natural de comunicação, viabiliza estas interações tendo assim um papel predominante nestes contextos.
Neste trabalho realiza-se um estudo objetivo e sistemático às características descri-toras da voz que permitem representar a comunicação baseada na fala em grupos. Mais ainda, são estudadas mecânicas de interação inter-pessoais, em circunstâncias de pequenos grupos, e as dinâmicas sociais por si evidenciadas. Neste contexto, pretende-se contribuir com uma abordagem computacional que permita analisar, de uma maneira robusta, a comunicação baseada na fala em grupos.
Para isto, é efetuada uma revisão literária sobre os conceitos teóricos da comuni-cação baseada na fala, da voz e de dinâmicas de grupos. Com base nestes estudos, foi proposta uma ferramenta prova de conceito que articula as diferentes etapas do processamento de fala que viabilizam o estudo das interações inter-pessoais e das dinâmicas de grupo.
Para demonstrar a aplicabilidade dos métodos propostos é efetuado um estudo exploratório sobre uma base de dados de fala relativos a grupos em situações de conflito em tarefas colaborativas. Os resultados obtidos mostram sinais
promisso-Keywords Audio, Speech Processing, Communication, Voice, Group Dynamics, Signal Pro-cessing, Unsupervised Learning
Abstract Groups are important entities in our daily life, whether in social contexts, such as family, or professional, as at work. Our identity is shaped by the various groups to which we belong, in the same way that their identity is characterized by their members.
The interactions between the members of a group create a set of inter-personal dynamics that have a direct impact on the performance of the tasks performed by them. The productivity of the groups correlates with the existing dynamics, where communication plays a central role.
The development of communication in the group highlights its existing dynamics and the way they evolve over time. By studying these dynamics it is possible to better understand the mechanics of the group’s functioning which, in turn, may explain some phenomena such as the quality of teamwork.
Communication allows the members of the group to express their ideas, beliefs and feelings that allow to articulate the work done by the group. Speech, being our most natural form of communication, makes these interactions possible and thus plays a predominant role in these contexts.
In this work an objective and systematic study is made of the descriptive character-istics of the voice that allow the representation of communication based on speech in groups. Furthermore, interpersonal interaction mechanics are also studied, in the circumstances of small groups, and the social dynamics evidenced by them. In this context, it is intended to contribute with a computational approach that allows to analyze, in a robust way, the communication based on speech in groups. To this end, a review on literature is carried out on the theoretical concepts of speech-based communication, voice and group dynamics. Based on these studies, a proof-of-concept tool was proposed that articulates the different stages of speech processing that make the study of interpersonal interactions and group dynamics possible.
To demonstrate the applicability of the proposed methods, an exploratory study is carried out on a database containing speech relating to groups in conflict situations during collaborative tasks. The results obtained show promising findings, allowing
Contents
Contents i
List of Figures iii
List of Tables v
Glossary vii
1 Introduction 1
1.1 Verbal Communication and Groups . . . 1
1.2 Motivation . . . 1
1.3 Challenges . . . 2
1.4 Objectives . . . 4
1.5 Thesis structure . . . 4
2 Background and Related Work 5 2.1 Speech communication . . . 5
2.2 Speech characteristics and group dynamics . . . 6
2.3 Computational methods for speech characterization . . . 7
2.3.1 Voice analysis for studying speech . . . 7
2.3.2 Conversation analysis based on speech . . . 11
2.4 Audio processing tools . . . 14
2.5 Publicly Available Speech Datasets for Studying Social Dynamics . . . 14
3 Computational methods for speech communication analysis in groups 17 3.1 Database . . . 17
3.1.1 Data . . . 17
3.1.2 Annotated Data . . . 17
3.2 Computational tool for speech communication analysis . . . 18
3.2.1 Voice Activity Detection . . . 19
3.2.3 Feature extraction . . . 29
3.2.4 Feature set creation . . . 33
4 Studying speech communication in groups during conflict 35 4.1 Study contextualization and data . . . 35
4.2 Overall analysis methods . . . 37
4.3 Feature selection to study conflict based on speech communication in groups . . . 38
4.3.1 Speech time . . . 38
4.3.2 Floor Control Ratio . . . 42
4.3.3 Overlap . . . 44
4.4 Automated analysis using unsupervised algorithms . . . 45
4.4.1 Unsupervised approach . . . 45
4.5 Clustering Results . . . 46
4.5.1 Experiment time 0 to 5 minutes . . . 47
4.5.2 Experiment time 5 to 10 minutes . . . 47
4.5.3 Experiment time 10 to 15 minutes . . . 48
4.5.4 Experiment time 15 to 20 minutes . . . 49
4.5.5 Experiment time 20 to 25 minutes . . . 50
4.6 Final Remarks . . . 50
5 Discussion & Future Work 53 5.1 Discussion . . . 53
5.2 Contributions . . . 54
5.3 Future work . . . 54
References 57
List of Figures
2.1 Cross talk example . . . 10
3.1 Example of annotated segment . . . 18
3.2 Framework’s diagram . . . 19
3.3 VAD example . . . 21
3.4 VAD - Cross talk influence on voice activity detection performance . . . 22
3.5 Cross-talk detection pipeline . . . 23
3.6 Cross-talk detection flow chart . . . 24
3.7 Speech time difference between cross-talk detection and no detection . . . 26
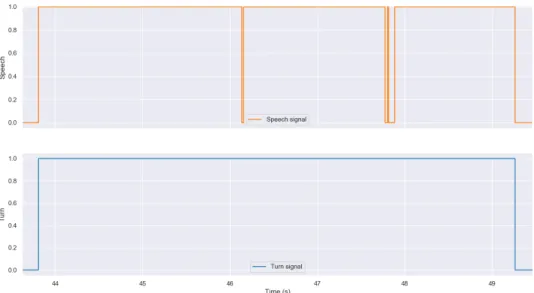
3.8 Speech signal segmentation - turns . . . 28
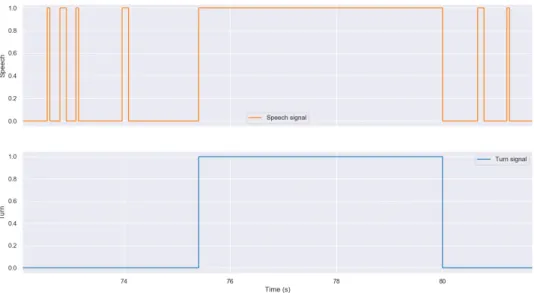
3.9 Speech signal segmentation - small voiced segments . . . 29
3.10 Comparison between overlaps and interruptions . . . 32
4.1 Bottom-up approach to compute each conversational feature . . . 38
4.2 Speech time for individuals in a group meeting with conflicts . . . 39
4.3 Speech time for a whole group . . . 40
4.4 Speech time comparison between different experimental conditions. . . 41
4.5 Floor Control Ratio comparison between different experimental conditions. . . 43
List of Tables
4.1 Case 1 cluster results and descriptive statistics. . . 47
4.2 Case 2 cluster results and descriptive statistics. . . 48
4.3 Case 3 cluster results and descriptive statistics. . . 49
4.4 Case 4 cluster results and descriptive statistics. . . 49
4.5 Case 5 cluster results and descriptive statistics. . . 50
Glossary
VAD Voice Activation Detection FCR Floor Control Ratio
ASR Automatic Speech Recognition SNR Speech-to-noise Ratio
GMM Gussian Mixture Model HMM Hidden Markov Model EOU End of Utterance
IVR Interactive Voice Response VPA Virtual Personal Assistant
SDS Spoken Dialog System FPR False Positive Rate TPR True Positive Rate
MFCC Mel Frequency Cepstral Coefficient ZCR Zero Cross Rating
CCR Relational Conflict Condition CCT Task Conflict Condition CC Control Condition
CHAPTER
1
Introduction
In this chapter an introduction is made to the subject of this thesis. To this end, a contextual-ization of the topic is provided. Then, the motivations that led to the realcontextual-ization of this work are presented followed by a description of several challenges associated with it. Deriving from the identified challenges, a set of objectives is defined that guide the study to be carried out. Lastly, a brief description of the document’s organization is presented.
1.1 Verbal Communication and Groups
Verbal communication has a central role in our lives [1]. The ability to express ourselves about virtually anything has a pivotal role on how we live in society. Through it, we are able to express our ideas and needs, and coordinate actions to fulfill goals [2] both in our personal and professional lives. We are constantly communicating with others and we do it in a very natural way.
It is as crucial to our lives as it is complex to study and understand, especially in groups where there are several participants engaged in conversation. Such scenarios have become increasingly common and relevant in the current society, making the study of verbal communication in groups an even more relevant thematic.
1.2 Motivation
Groups are preponderant entities in our daily life. We often organize ourselves into groups in order to create joint efforts to solve the most diverse challenges that arise in our personal and professional lives. Groups are composed by people that sustain social interactions among themselves, creating dynamics that are strongly related to the well-being of its members and, consequently, to the group’s harmony and productivity.
Within the groups, communication assumes a fundamental role by enabling the messages of the members to be conveyed, either to express their ideas and feelings or to carry out actions such as instructing other members. The coordination of the group, such as the division
of tasks, is usually discussed and agreed among the team members in order to optimize the group’s organization to accomplish tasks more efficiently and with better outcomes. In general, it is possible to infer how a team works together or how it is organised by analysing the group’s communication patterns. Since communication has such a central role in supporting the group’s performance, failures in communication, such as the monopoly of communication by a single member, can disrupt the group’s activities and, in turn, aspects such as conflict among group members, or even tiredness, might reflect on the communication. Therefore, an understanding of how the group communication is unveiling might shed some light on how the work might be progressing and provide some insights on the group’s performance and context, along with the status of each member, which can guide, e.g., the team manager on balancing and coordinating the team’s efforts.
Even though we are able to intuitively assess conversations, detect patterns and categorize its actors, we want to understand what is behind our natural capacity of doing it. If we are able to understand this, we can transpose this knowledge to computational systems and perform semi and fully automatic speech analysis.
In this context, the study of group communication using computational resources can also become an important resource in several scenarios that can automatically exploit information on social dynamics to their benefit, such as automatic dialogue analysis systems that might generate reports on team communication. These systems could be used by the teams in order to optimize their communication processes and, consequently, the teams’ productivity. Additionally, intelligent systems such as meeting mediators that might detect latent conflict or unbalanced communication among team members could also be an important resource in organizations.
1.3 Challenges
The study of verbal communication is a multi-disciplinary and complex task that raises many challenges during its analysis. The theoretical studies and formulations on diverse aspects of communication raise a number of challenges inherent to the abstract nature of the concept of communication itself. On the other hand, the computational analysis of dialogue requires a careful approach both in the choice of speech processing techniques and in the computational definition of the relevant communication’s descriptive characteristics.
• Speech communication is a complex phenomenon. Human dialogue is a continu-ous, ongoing process [1] that is highly spontaneous and interactive. During a conversation we are constantly analysing diverse aspects that surround us that make us react and adapt. Moreover, a conversation is composed of several people who have distinct ideas, characteristic behaviors and different perceptions which motivate unique and complex interactions. Verbal communication is also influenced by factors of a non-verbal nature that have an impact on the outcome of the conversation and its members [3][4]. In example, our stance in a dialogue is influenced by elements that may not be related with the verbal communication that is taking place.
• Speech communication analysis needs to be supported on objective descrip-tors. Although we have a natural relationship with communication, it is a great challenge to understand what our interpretation is based on and, therefore, defining these characteristics is not a trivial task. There are some studies to guide us but there is no global definition of what is, or not, a good descriptor to expose communication patterns. Moreover, when working with computational approaches, there is the increased difficulty that these characteristics must be transferred to computational systems that depend on precise measurements of data to be able to operate. This entails moving from a subjective appreciation of the communication, as we do it, in our daily lives, into meaningful objective measures of the phenomenon.
• Communication within groups is complicated. The communication process is a complicated phenomenon that depends on many factors [1], which makes social interactions to be messy. In groups, this gains even more notorious dimensions given the individuals actions and interactions, and the effects that they have on other members since the individuals behaviors are also influenced by the group as a whole [5]. There is an inter-dependability between individuals and the group that creates heterogeneous behaviors that are more difficult to address.
• Real life audio recordings are noisy. The ability to perform automated analyses on speech relies on many components that require state of the art techniques to retrieve data from speech signals. There are several sources that can introduce errors in the analysis at various stages of the process and, therefore, it is necessary to ensure that these errors are expected, measured and controlled to guarantee a cleaner and more robust final analysis.
As today, dealing with unexpected noise in speech signals is still an issue that varies from study to study. Some techniques to deal with it are more adequate in certain scenarios than others and, consequently, it is vital to understand which are suitable for this study and which are not. In group meetings there are limitless possibilities of unexpected scenarios that might interfere with the speech signals, ranging from improper microphone usage to unexpected technical issues with hardware or unforeseen events within the meeting itself.
• Modelling conversations computationally is error-prone. In order to model interactions during dialogue it is necessary to define a set of behaviors for each individual that can potentially contain information about the flow of the conversation. For example, a person that constantly interrupts others might be associated with a dominant profile which in turn is a behaviour that may highlight the existence of conflicts within the group. These behaviours are approximated by characteristics that are measured through the participants’ speech and, for this, a speech’s signal must be transformed into a logical framework that we can extract these conversational features, such as how often a person interrupts another. This process alone has a wide variety of issues that require special attention and study to guarantee reliable approximations of the communicative process.
1.4 Objectives
The main objective of this dissertation is the conceptual design and development of a com-putational tool to support the study of social dynamics in group settings. The following objectives are then defined in order to achieve this:
• Perform a literature research to select the most relevant aspects of communication for the study of social dynamics in dialogue.
• Propose computational methods, based on the researched literature, to quantify the relevant speech features for the study of communication.
• Develop a proof-of-concept tool, based on the proposed methods, to support the study of social dynamics in groups based on speech.
• Validate the relevance of the proposed methods and test their applicability as tools to analyse and foster an insight over dialogue analyses.
It is also one of the objectives of this work to be able to add some knowledge to the research effort already carried out in this area by scholars from the Universidade de Aveiro. These works also analyse the attitude of individuals during meetings in order to highlight the social strategies employed by them.
1.5 Thesis structure
This document is structured in five chapters. In chapter 2 a summary is provided of related work in the area of speech processing and communication dynamics deemed relevant to this thesis. Furthermore, a review is made of works in the area of Psychology which exploit social dynamics in communication, and whose contribution to the knowledge of this field is invaluable in the context of recent approaches to this topic, such as the one proposed here. In chapter 3, it is detailed all the work done regarding the design and implementation of the proposed computational methods to process and analyse speech communication dynamics. In chapter 4, the study case chosen for this work is mentioned. It also contains the details about the results of the communicative patterns analysis performed on the selected database. Lastly, in chapter 5, the performed work is discussed as well as topics for future works that may evolve or profit from this one.
CHAPTER
2
Background and Related Work
In this chapter, an overview is made of the literature on communication deemed relevant to this dissertation. A set of studies is explored related to the theoretical formulations on speech and group dynamics that are the foundations for the computational approach of this work. Afterwards, the computational aspects of speech processing are mentioned. Firstly, the voice is analysed, in terms of its physical properties, and how it can be detected automatically. Following this, some works are analyzed that focus on the study of speech in dialogue and the interaction dynamics between the intervenients. Finally, a set of representative toolkits for speech processing is mentioned and audio databases that are commonly used in related works are also presented.
2.1 Speech communication
A possible definition of human communication is that it is the process of intentionally exchanging information between peers [6]. It is a rather complex and abstract process and its study is influenced by many factors. The perception of communication varies by context: how many persons are involved, who are the participants, how the information is exchanged, among others. Our approach to a conversation within family members is not the same as with work colleagues or friends. The same rationale applies to varying group sizes, the subject of the conversation and whether we are communicating face-to-face or through the internet.
The exchange of information between peers is carried out through messages transmitted in certain channels such as writing or speech. The choice of the communication channel has a considerable impact not only on the dynamics of the communication but also on the effect of the message that is transmitted [1]. For example, the act of face-to-face negotiation encompasses a set of behaviors, such as brevity, which have a significant impact on the outcome of the negotiation. These behaviors might not be represented in other channels such as e-mails, where peers have a larger time window to process information and to formulate an answer. The characteristics of the actor’s voice transmit sensations that influence the course of the communication process and its actors, which are not found in other channels.
Another aspect to consider in the study of communication is the number of participants involved. Depending on the number of speakers, there are different aspects of communication that stand out. In a dialogue between two people, a dyad, it is possible to capture individual indicators that help to describe the conversation and its outcome. These same indicators may be irrelevant in characterising another context, such as a public discourse. In the case of a small group, where all its members participate actively in the discussion [1], the number of participants is reduced and the interactions maintained between them create specific group dynamics. Therefore, it is relevant to consider the quality of the communication and how it unveils when studying small groups in order to understand its dynamics.
2.2 Speech characteristics and group dynamics
Speech as our main form of communication is a very familiar aspect in everyday life and is an obvious choice for many people [1]. The voice contains physical properties that add value to the message that is transmitted and provides information that is not included in the message content. Prosody properties such as intonation and intensity play an important part in speech [7] and can be used to highlight the message or to convey feelings. In extreme cases it is the use of these characteristics that allows to decode the message and its meaning.
The characteristics of speech support the study of the context of communication, as well as the behaviors associated with interpersonal interactions during the dialogue. In the study conducted by De Pasquale, Cullen, and Vaughan [8] the authors explore speech and its prosodic characteristics to highlight events that indicate synchronism between participants in psychotherapeutic interventions. In particular, they investigate coordinating behaviors in speech, like prosodic accommodation, as indicators of feelings such as empathy which, in turn, are correlated with the success of patient-therapist relationships. The authors also explore some relationships, such as the rapport, which can be evidenced through the study of speech.
In terms of speech production, speakers may adapt their speech to emphasize parts of the message that is transmitted or even to aggregate more information such as sentiments. For example, pause times between sentences support the speaker’s attitude in the dialogue, outlining a certain stance to others regarding the conversation’s topic. In the work developed by Hung and Gatica-Perez [9], the authors study group cohesion in working teams. For this, they use as hypothesis a set of characteristics of speech and its production, such as the pause times between sentences, in order to infer a team’s cohesion levels. Moreover, studies conducted to the speech rate, i.e. how fast or slow people talk, correlate it with the expression of sentiments, such as anger [10], and feelings synchronization between speakers [9].
In organizations and groups, communication plays a predominant role [2]. It supports the coordination of actions involving multiple parties that need to cooperate in order to achieve common objectives. In the work developed by Rysman and Weissenberg [2], the authors study the behavior of people in the context of organizations. Organizations are entities composed of complex networks of people in which each one has a role to perform. The authors emphasize the importance of communication in the performance of some roles which directly affects
the productivity of the work groups. Ultimately, the groups dynamics are related to the productivity of the organizations.
These conclusions are also corroborated by the work carried out by Hassall [11], in which the authors explore the relationship of communication and teams. They argue that groups can be characterized by their communicative profiles which, in turn, have a direct impact on their performance. The relationship between communication and working groups is explored in the literature in other works where the purpose is to study group dynamics, such as cohesion [9] and team performance [3]. Authors argue that these social dynamics can be analysed by the interactions sustained between teams, which in turn are characterized by speech indicators, such as the groups speech and overlap time.
2.3 Computational methods for speech characterization
The computational analysis of speech is divided into two major approaches. On the one hand, it is possible to use the transcription of speech in order to study the content of the message. This approach requires the use of Automatic Speech Recognition (ASR) methods which transcribe everything that is spoken into text. This technique allows capturing information regarding the topic of the conversation, the type of vocabulary used by each participant, among others. For example, in the study developed by Rienks, Zhang, Gatica-Perez, et al. [12], the authors explore the transcriptions to support the study of the influence of each member in small groups.
On the other hand, speech communication can be analysed without using transcripts of what is being said. That is, verbal communication is studied in terms of how people speak and how their voice sounds. This concept is intuitive to humans since we have the natural capability to, for example, differentiate statements and questions just by the intonation of the end of the sentence or understanding whether a certain word has a certain connotation. Many studies suggest that we are able to understand different aspects of human-to-human communication, such as rapport, mimicry and adaptability [8] [13], by computationally analysing acoustic and prosodic features of the audio signals without the need to understand what is being said.
Finally, audio signals can provide more information than what is extracted from their physical properties. Starting from a speech signal it is possible to build a framework that conceptualizes and explores dialogue between participants which, in a final stage, allow us to better understand the communicative process. This process can be modelled in terms of turn taking behavior, overlaps or interruptions, among others, that contain information not only on the social dynamics and interactions between people [14] [15] but also on people themselves [16].
2.3.1 Voice analysis for studying speech
Human speech is produced through vocal sounds generated by a source, in this case the speaker. It is a mechanical process that encompasses a set of parts of the human vocal tract which, in a final stage, produces sounds in the form of sound waves. These waves can be captured through the use of specialized electronic equipment that allows their modelling and
analysis. As a result, a digital signal is produced that can be studied using signal theory methods. This whole process allows the computational modeling of voice and, consequently, speech.
Voice features
The signal produced by the voice is a wave which contains a set of physical properties that characterize it. There are two types of speech characteristics that are addressed in this revision given their preponderance in computational speech analysis: acoustic and prosodic features. On the one hand, the signal contains a set of acoustic characteristics related to physical properties of the voice such as energy and pitch. On the other hand, the prosodic characteristics are related to the production of speech such as intonation and rhythm.
The energy present in the signal is a property that is often used for speech analysis in the recent literature. It is used by methods of voice activity detection, which will be mentioned later in this work, and in speech studies. For example, in the work done by Hung and Gatica-Perez [9], the authors use acoustic properties of the voice, such as the energy, in the study of speech to model behaviors that may indicate intra-group cohesion.
Energy can be computed using different methods that exist in the signal theory literature and each one is more suitable for different cases of application. For example, the Mel Frequency Cepstral Coefficients (MFCCs) are a set of characteristics that represent the energy existing in lower frequencies of the signal. A particularity of these characteristics is that they are based on the calculation of energy on the Mel frequency scale, which in turn is suitable for the analysis of speech signals. This scale allows the extraction of energy to be focused on frequencies suitable for human speech, approximating the human auditory system.
These characteristics are often used in literature for speech analysis in various contexts [5], [17], [18]. The work developed by Lian, Tao, Liu, et al. [5] studies the emotional states of speakers during conversations using deep learning methods that use acoustic properties of the signal, such as the MFCCs, as input for the neutral networks classifiers.
Another major feature that is often used in speech analysis is pitch. The pitch is characterized as the fundamental frequency of the signal, F0, and its use is also frequent in the literature. It is calculated in the frequency domain and, like energy, there are several methods for pitch extraction. In the work done by Jouvet and Laprie [19] a meta analysis is made of the different pitch extraction techniques. The authors explore various algorithms and compare their performances under different noise conditions in order to understand the algorithms suitability for different scenarios. Findings show that noise has a very relevant impact on the performance of the different methods and, therefore, it might be appropriate to use different techniques in different cases.
Pitch is commonly used by Voice Activation Detection (VAD) algorithms [20], where pitch formations represent possible voiced segments. However, this information is not used in isolation and speech detection algorithms usually combine pitch with other signal properties such as the Zero Cross Rating (ZCR). Additionally, pitch also contains information about speech that is used for studies of conversational dynamics, as in the study conducted by
Aldeneh, Jaiswal, Picheny, et al. [13]. Authors explore variations in mood episodes of patients with bi-polar disorder and use the variations of pitch to identify the patients mood states.
Prosodic characteristics are related to the production of speech and play an important role in the course of a conversation. They characterize the variation of rhythm and intonation that contain information on syllables [13] and other linguistic aspects. They are commonly used in conversational dynamics studies given that they support the highlighting of words and sentences that evidence contexts, such as feelings [9], that can explain certain social behaviors in inter-personal interactions [13].
Voice Detection
VAD algorithms are a common type of algorithms which are vital to a wide variety of speech systems around the world such as ASR, audio surveillance or speaker identification applications [21]. It performs a specialized analysis on audio signals in order to distinguish voiced segments from background noise [21]. A classic VAD algorithm starts by extracting a set of features, commonly in the frequency domain such as the ZCR, pitch or energy, and uses them as input to discriminatory models that will establish a threshold to separate voiced from unvoiced segments.
It is important that a VAD algorithm is able to perform a robust analysis not only in clean but also in noisy environments [22] since, in real world applications, audio data is more unpredictable and may contain a considerable amount of clattering.
These algorithms have evolved over time given the growing demand for robust audio recognition systems that can operate in real-life scenarios. Traditional VAD algorithms decisions relied on simpler models that defined static thresholds or combined different features [21]. Later, more complex techniques were proposed that adapt their decision threshold dynamically to the acoustic environment by taking into account the background noise, Speech-to-noise Ratio (SNR) of each channel, among others [22].
With the growing interest in speech processing, new features and techniques have gained preponderance in the speech analysis domain. These developments have been accompanied, and boosted, by the development of other statistical disciplines due to their suitability for speech processing. Studies found that the task of detecting voiced and unvoiced segments can be modelled using likelihood ratio tests, with models such as Gussian Mixture Models (GMMs) and Hidden Markov Models (HMMs) being frequently used. More recently, due to the emergence of machine learning and the exponential increase in computational capacity, VAD methods are broadly categorized in supervised and unsupervised methods. Supervised methods rely on labelled data to train classifiers, such as neural networks, that may outperform unsupervised methods if the testing environment’s noise conditions are similar to the training [20]. Thus, they may fail to generalize for broader scenarios due to the unpredictability of the noise that is produced in different cases. On the other hand, unsupervised methods try to make decisions independently of the situation on which it is used. They are mainly a continuation of the previous studies that were based on statistical models and, therefore, do not have any dependency on labelled data and do not rely on any assumptions about the
noise conditions. Nonetheless, as previously mentioned, the usage of unsupervised methods should consider the noise conditions of the study that is being performed in order to maximise the algorithm’s performance in terms of voice detection.
In group meetings there is a specific source of noise that interferes heavily with VAD algorithms. Namely, due to the physical proximity between audio sources, the recorded audio for one source can be a mixture of several signals, as shown in Figure 2.1. This is a known phenomenon called cross-talk, or microphone bleeding, that requires special attention. When considering one speaker’s speech, there are two scenarios that should be considered: 1. The recorded audio is a mixture of other participants speech without containing any activity from the considered speaker; 2. The recorded audio is a mixture of other participants speech with the current speaker talking in overlap. Previous studies refer to these scenarios as “cross-talk only” and “cross-talk plus speaker” [18], respectively. Moreover, in speech meetings the dialogue is typically spontaneous frequently resulting in situations where speakers overlap their speech with each other [18], which makes it even more difficult to differentiate between overlap situations and cross-talk.
The choice of the microphone type used in the experiments has a major influence in both cross-talk ratio and how it can be handled. Previous studies show that personal headset configurations reveal better performances in cross-talk detection [23] even compared to lapel microphones, but, nonetheless, microphone bleeding remains a challenge that require further processing to tackle it [18].
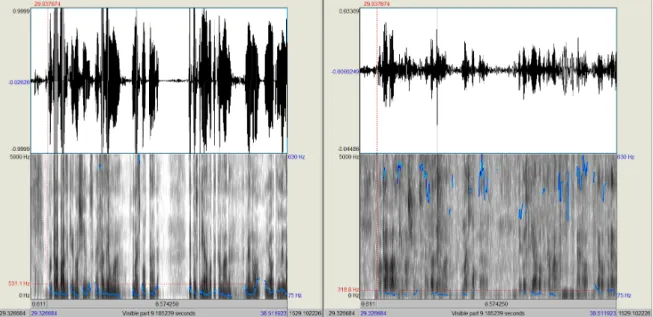
Figure 2.1: Example of a cross talk situation. Audio waveform, spectrogram and pitch formations comparison between two participants in the same meeting. The left one is speaking while the other is silent. In the spectrograms, darker segments refer to frames containing considerable amounts of energy in the speech frequency range. Blue outlines drawn on top of the spectrograms indicate pitch formations. Even though only one is speaking, there are pitch formations and detected energy segments in the right participant’s signal.
Cross-talk detection can be considered a type of speaker diarization because, in fact, we are dealing with a signal mixture that contains speech from more than one source and we
are interested in separating them. Nonetheless, in cases where participants wear their own headset, this task can be performed using more alternative techniques that the ones used in classic speaker separation.
Many studies have been conducted about this topic and it has proven to be a tough challenge, especially in real applications [24] [18]. Many studies are based on the research by Wrigley, Brown, Wan, et al. [18], who performed an exhaustive study and tested a wide variety of features such as MFCC, pitch, energy, ZCR and short-time signal kurtosis. Their findings show that the best features for cross-talk detection, in their study, were mainly the short-time kurtosis and cross-correlation metrics.
2.3.2 Conversation analysis based on speech
Contemporary literature contains a set of computational studies aimed at dialogue-based communication analysis. To this end, many of these studies begin by characterizing the dialogue from the conceptual point of view. In this way, it is possible to create a computational framework that allows describing interpersonal interactions and represent social dynamics among participants.
Utterances
VAD provides important information about speech that can be further processed to concep-tualize communication. One possible approach is to segment the VAD output by grouping contiguous voiced segments into what can be called as utterances. Many studies are based on the theoretical formulations by Duncan [25]–[28] and Sacks, Schegloff, and Jefferson [29], who argue that human dialogue is perpetuated following a turn-based interaction. This process can be referred as utterance segmentation, turn segmentation or End of Utterance (EOU) detection. EOU detection is a common processing stage for many ASR systems such as Interactive Voice Response (IVR) [30] and personal assistant [31] systems.
Virtual Personal Assistant (VPA) systems have gained visibility in the last decade and its popularity has increased dramatically in the recent years with the emergence of commercial products, such as Amazon’s Alexa™ 1, Apple’s Siri™ 2 or Google’s Assistant™3. Some of these systems are trying to create more realistic agents by allowing the user to communicate using continuous speech instead of command-based interactions. For this, the system must be able to detect the end of a speaker’s turn to process the information given by the speaker.
On the other hand, IVR applications are commonly used as a first stage for handling requests in customer services, in an attempt to reduce the need for human intervention to address common issues that users might have. State of the art IVR systems are develop-ing technologies that allow users to interact usdevelop-ing voiced utterances instead of text-based commands.
In an effort to create smoother interactions between users and automatic systems, turn segmentation gained relevance and, consequently, many studies emerged in this area. One
1© 2020, Alexa Internet (www.alexa.com) 2© 2020, Siri (www.apple.com/siri/)
3© 2020, Google’s Assistant (www.assistant.google.com/) 3© 2020, Statista (www.statista.com)
of the main issues with automatic systems is that user’s EOU detection is not a trivial task, especially when the user’s interactions are not command-based. Continuous speech is more unpredictable [32] and the EOUs are not as easily detected since there is no set of predetermined words, or commands, that the system is expecting to find. This is aggravated by short utterances, or back-channel responses, such as “uh-uh” or “mm-hm” that humans frequently use [30], [33]. If the turn segmentation is not done properly, an automatic system will often interrupt the user [31] creating an unpleasant experience thus deteriorating the quality of the system and its usability. More recently, efforts have been made to apply EOU detection to continuous speech, not only to human-to-machine interactions but also to study human-to-human communication [34] [35].
There are several turn segmentation strategies and the suitability of each one varies across use cases. In this work we are interested in segmenting continuous human-to-human speech and, therefore, some of these studies will be analysed.
One simple definition of an EOU is that a turn ends whenever the speaker stops talking for a certain amount of time. This silence timeout approach was used in conventional Spoken Dialog Systems (SDSs) [33], and the timeout threshold typically ranges from 0.5 to 1 s [36]. This strategy was widely used for many years, but nowadays it is not considered a very robust one [30], [33]. More complex techniques are being studied that approach this problem as a classification task [35] based on extracted features that proved to be strong cues of turn shifts [30]. Authors take into consideration the previous speaker’s utterances to predict its next EOUs, using both locally and globally extracted features for each speaker. Additionally, some studies try to relate the EOU with the physical properties of the speech’s signal such as pitch [33]. The authors explore the possibility of detecting final and non-final pauses based on the acoustic properties of each individual’s speech signal. This has an intuitive interpretation since we, as humans, seem to use these acoustic features in order to predict the other speaker’s EOU. Usually, the intonation of the end of a sentence tends to indicate that the speaker is finishing his turn and, therefore, giving the floor to other speakers. However, if the EOU does not become evident by the intonation we assume that the other speaker is having a non-final pause within his own turn.
Speech features for studying inter-personal interactions in dialogue
With a robust framework that detects each speaker’s start and end of utterances, it is possible to computationally explore human-to-human communication in an effort to understand the interactions between speakers and their social dynamics.
Researchers have gained interest in this field due to the increasing demand on understanding conversational patterns in human-to-human interactions. On the one hand, there is a notable interest in intelligent communicative systems that may use this knowledge to evolve to more realistic agents. On the other hand, understanding communication has a wide variety of uses in organizations, education and health. There are many applications where these insights are vital such as measuring the communication’s impact on meetings outcomes [37]; modelling medical interactions [8]; and providing insights to team leaders in order to improve engineering
design activities [38].
Communication analysis with computational resources can be as complex as desired ranging from understanding simple concepts, such as speaking time, to more complex phenomenons such as performing sentiment analysis.
The first studied set of features are based on each participant’s speech time. The total speech time of groups is explored by Hung and Gatica-Perez [9] as an indicator for estimating cohesion levels within teams. Authors argue that higher volumes of voiced activity is linked to higher levels of harmony. However, if speakers are constantly speaking at the same time, overlapping each other, it may be a manifestation of conflict. Additionally, the speech time can be used as indicator of behaviors such as dominance [39] and leadership. In the work by Jayagopi, Hung, Yeo, et al. [40], the authors studied a set of audio-visual cues to assess dominance in group conversations. The authors findings indicate that the amount of speech produced is a strong cue for dominance perception by humans.
The speech time’s distribution among participants can also be seen as an indicator of dominance if its distribution is uneven across the dialogue. This feature is referred as Floor Control Ratio (FCR) and defined as the relative amount of speech time for each speaker to the total amount of speech in the conversation [13]. It is explored as a dominance indicator based on the theory that more submissive speakers may end up giving the floor to more dominant speakers [41], even as a way of social accommodation, that is reflected on the unbalanced distribution of speech time.
Based on speaker’s turn-taking behavior, many features are explored in the literature to explain a vast array of social phenomenons. Studies found that turns of dominant individuals tend to be more extensive and more frequent [42] while the amount of consecutive turns may indicate that individuals are willing to assume leadership roles within the group [13]. Lai and Murray [43] studied methods of predicting group satisfaction in meetings by using conversational features extracted from the turn-taking behaviors of the participants. Their study found that the turn-taking mechanics are strongly correlated with the participant’s satisfaction of the meeting.
The act of overlapping is referred to as a situation where two people speak at the same time, disregarding the social rules of turn-taking. It is hypothesized as an indicator of conflict and lack of group cohesion. In the work by Hung and Gatica-Perez [9], authors found that the speaking rate of the participants while in overlap situations is a good indicator for estimating a group’s cohesion. Nonetheless, it is also interesting to note that overlapping is not always referred as a negative sign in terms of communication, as studied by Sacks, Schegloff, and Jefferson [29] who found that it is a natural phenomenon that can be associated to a predictive behavior that humans have regarding each others speech, as an effort to sustain smoother conversations with small gaps between speakers turns. It is important to differentiate situations of natural overlap from scenarios where the overlap occurs over extended periods of time, which become an unpleasant experience for the speakers.
Other cues can be derived from the turn-taking dynamics that are relevant to assess conflicts in face-to-face interactions. The interruption mechanics between speakers is theoretically
studied as a possible indicator of an individual’s personalities [44]. This hypothesis is further explored computationally in more recent studies [15], where authors explore the correlation between participant’s personality traits and overlapping and interrupting dynamics. These traits refer to the Big-5 personality traits [45], which can be associated with conflicts in terms of group’s performances [3]. On the other hand, Robinson and Reis [46] explores the effects of interruptions on interpersonal perceptions. The results obtained by the authors suggest that interruptions are linked to more negative personality assignments and that interruptors are seen as less sociable and more assertive than interruptees. There are also very interesting studies associating the mechanics of interruption with the people’s gender and the way that people of different genders interact with each other [46], [47].
2.4 Audio processing tools
The computational exploration of speech is made through the use of tools specialized in signal analysis and mathematical computation. There are also tools that focus only in speech processing, which already include a set of libraries that provide the necessary operations for speech analysis.
The library SciPy [48] provides robust tools for signal processing and also for scientific computations [49], such as statistical and linear algebraic libraries. It is a core library for the development of applications in Python [50] that require mathematical calculations, as in scientific research.
Praat [51] is a software specialized in audio analysis and manipulation, more specifically speech. This software provides visualization tools that are used in literature for speech inspection. It also contains methods for computing audio signal’s characteristics that can be extracted and used in various programmatic environments.
Praat has a Python interface called Parselmouth [52], which provides the programmer with a set of Praat software features, such as pitch extraction, without leaving the Python’s environment.
It is worth to mention that the library OpenSMILE [53] is a widely used tool for speech processing in state-of-the-art works, as in [5]. It provides tools to extract features from speech signals that can be used by other tools.
2.5 Publicly Available Speech Datasets for Studying Social Dynamics
There have been many studies that perform social dynamics analysis based on speech. Some studies differ in the databases that they use, to fit their needs for their particular studies. These databases might contain audio data recorded in “controlled” environments where speakers act as “voice actors”, this is, they are not recorded in a real-life scenario and, therefore, the post-processing techniques required are not the same as in real-world cases. On the other hand, some databases contain recorded data from real-life interactions such as clinical interviews [8] [13]. Some notable examples of these databases are presented below.
The PRIORI - Predicting Individual Outcomes for Rapid Intervention [54] - data set contains cellphone recordings of individuals diagnosed with Bi-Polar disorder. The participants are recorded for as long as 13 months in interactions maintained with a clinician on a weekly base. On top of it, they are also recorded in personal calls. The annotated data for this database comes in two forms: i) from the clinicians weekly assessment and ii) from manual annotation about the emotional expressions from the patients. The data set provides over 380 hours of speech.
The MELD - Multi Modal Emotionlines Dataset [55] - database comprises more than 1400 dialogues and 13000 utterances from the worldwide famous TV show Friends™. It contains audio, text and video data for all the conversations. The dialogues are replicated by speakers and they are annotated in terms of emotions and sentiments. Each utterance is labeled as Anger, Disgust, Sadness, Joy, Neutral, Surprise or Fear in terms of emotions and as positive, negative or neutral in terms of sentiments [55]. MELD has more than 1400 dialogues and 13000 utterances from Friends TV series.
Many other studies work with specific databases suited for their needs. In example, Ludusan and Wagner [56] perform laughter dynamics analysis to assess social aspects such as convergence, synchronism and agreement between participants from different socio-cultural contexts (German, French and Chinese). They make use of the DUEL [57] database which contains around 24 hours of spontaneous conversations in French, German and Mandarin Chinese.
Sudhakar and Anil [58] perform a review study and mentions databases such as DES (The Danish Emotional Speech Database) and BES (The Berlin Emotional Speech Database) as ones of the most famous databases for emotion detection. Both contain annotated data in terms of emotions for “voice actors” reading texts, in a similar way to what is done by Livingstone and Russo [59] in the widely famous RAVDESS (The Ryerson Audio-Visual Database of Emotional Speech and Song).
Recently, an effort has been made at the Universidade de Aveiro to build a novel data set for studying speech communication in groups, more specifically to study the emergence of conflicts within teams, which serves as grounds for the work presented in this dissertation.
CHAPTER
3
Computational methods for speech
communication analysis in groups
This chapter addresses the computational methods to study speech in groups proposed in this dissertation, and how they can be used in the design of a tool that is capable of performing automatic speech communication analysis.
3.1 Database
The database is used at this stage of development to validate noise reduction methods, in particular cross-talk. In this context, the database was also manually annotated in order to compare the algorithm’s output regarding speech segments with the real data.
3.1.1 Data
For this study we are going to consider group’s communication dynamics in small group meetings. The data set used in this work is composed of audio recorded in small-scale informal meetings. The data refer to a social experiment carried out at the Universidade de Aveiro in which the participants organize themselves in groups of four to perform a collaborative task. Team members are sitting around a table, each of them using a personal headset that is recording their voice. The database totals about 30 hours of meetings in which, for each meeting, there are four times this amount, that is, for each meeting the audio of each participant is recorded, totaling 120 hours of recorded data.
3.1.2 Annotated Data
The development of a speech processing platform consists of several steps where, in each one, there is a set of modules whose operation is based on various audio and speech processing methods. In this regard, several of these methods, e.g., noise reduction techniques, can profit from annotated data to guide development and validate their behaviour. To this effect, manual annotations of a subset of the audio data were performed.
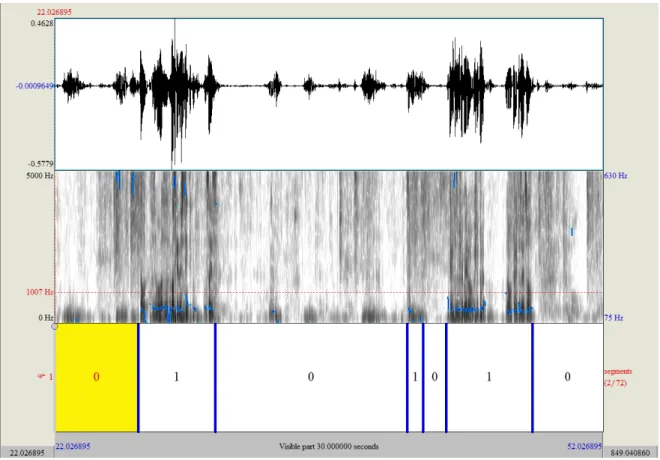
The data annotation process was conducted using the software Praat [51] as depicted in Figure 3.1. Data is annotated in terms of EOUs, that is, for each annotated meeting, each speaker’s start and end of utterance is manually marked. The definition of utterance is kept as simple as possible: an utterance, or turn, is the intentional voiced activity by a participant which expresses its intention to communicate with other speakers. The main point of divergence between different definitions is the identification of the moment when a person ends its utterance. Should it end whenever the person stops speaking for a certain amount of time? Or can he make prolonged pauses and still maintain the “floor”? For reasons of simplification and pragmatism, the annotated data marks an EOU when a person stops speaking for a certain amount of time.
In this work, we considered annotated intervals regarding speakers activity, in terms of utterances, for 20% of the data. This makes up about 1440 minutes (24 hours) of annotated data. These annotations are used to validate the cross-talk and EOU detection methods for this work and can be re-used for future works conducted on the database.
Figure 3.1: Example of 30 seconds annotated audio segment from the data set. On top, recorded signal’s waveform. On the center, spectrogram and pitch formations; on the bottom, annotated intervals. “1” stands for utterance and “0” stands for silence.
3.2 Computational tool for speech communication analysis
The conceptualized approach consists of a framework which provides a programmatic en-vironment, in Python, to process speech in human-to-human communication. It contains a set of methods that have the ability to robustly handle dialogue in real scenarios, using
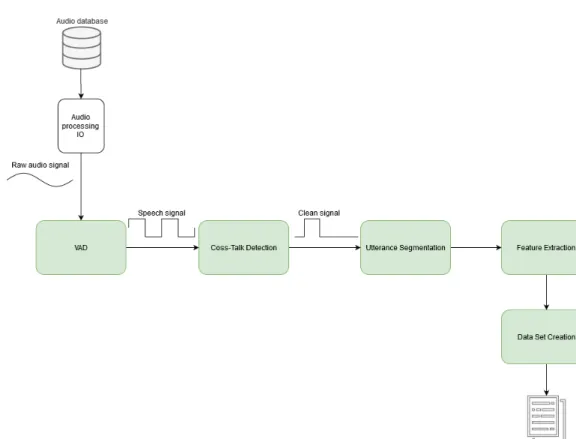
Figure 3.2: Overall diagram of the proposed framework. From left to right, in a first phase the system reads and processes the audio files in order to extract activity moments from the speakers. It then processes this output to decrease the amount of inter-microphone noise and segments the contiguous frames in turns. Finally, it computes a set of speech features and exports them for analysis. Green blocks represent the components that were developed for this work.
techniques that have proven to be adequate in such cases. They are built using the libraries SciPy and NumPy, which provide the core functionalities for them to work, such as signal processing methods. The proposed solution is intended to be modular and scalable in order to allow future contributions that may improve the techniques used. This approach also allows future works to expand the platform with more functionalities suited for different case studies. Bearing this in mind, Figure 3.2 shows an overview of the proposed solution. The platform is composed of a set of modules that are interconnected with each other starting from the speech signals of each speaker, and is broadly divided in four stages: 1. voiced activity detection; 2. EOU detection; 3. feature extraction; 4. data set creation.
3.2.1 Voice Activity Detection
Voice activity detection, or VAD, is the process of detecting human voice, or the lack of it, in a segment of an acoustic signal as shown in Figure 3.3. This task provides the baseline for many speech processing applications [60] and, therefore, it is of utmost importance that the choice of the algorithm used is as adequate as possible for the application in question. It has been widely studied that different VAD techniques are valid and provide good results but they are also dependant of factors that vary from application to application, such as the amount of noise of the recorded data. There are mainly two broad categories of VAD
algorithms: supervised and unsupervised. The first relates to algorithms that are trained with labelled data of specific data set(s). These type of algorithms will provide good results as long as the “new”, unseen, data is similar to the data that was previously used to train the classifier. Otherwise, its performance may degrade considerably and it may not be better than a “simpler” algorithm [20]. On the other hand, unsupervised algorithms try to generalize the voiced/unvoiced decision to match any conditions that it may encounter. Nonetheless, the quest to build a VAD method that is able to perfectly generalize in unseen circumstances is still an ongoing task that is far from being finished, despite the considerable progress that has been made in this research field [20].
The selected VAD algorithm for this thesis is proposed by Tan, Sarkar, and Dehak [20] that proved to yield state-of-the-art results both for noisy and clean speech in generic, real world scenarios. This solution, while achieving very positive results, also takes into account the efficiency with which the classification is made in terms of computing time. This is an important aspect in speech recognition applications, especially in cases where audio files have a considerable duration. VAD algorithms are usually computationally expensive because they perform a series of complex mathematical operations on the signal to extract features on the frequency domain, such as pitch and energy and, thus, it is mandatory to work with efficient algorithms for voice detection.
The algorithm is divided in three stages, as explained by Tan, Sarkar, and Dehak [20]: 1. First pass denoising; 2. Second pass denoising; 3. Voice Activity detection. The first and second stages aim to remove as much noise as possible from the raw signal by making use of noise-estimation, such as SNR weighted energy difference and high-energy segments detection, and speech enhancement techniques. The algorithm’s decision is then based on the pitch and SNR weighted energy difference of the denoised segments obtained from the first stages. Following the good results of the algorithm in generic applications on real-world scenarios, the default settings were used. Nonetheless, as previously mentioned, in scenarios such as the one studied in this thesis, where participants are relatively close to each other, microphone bleeding is a phenomenon that must be addressed in order to guarantee that the resulting speech signal is as close to the real speaker’s behavior as possible, hence resulting in a voice activity detection that more accurately depicts speaker activity.
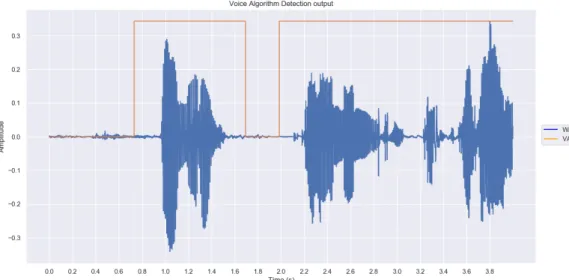
Figure 3.3: VAD example for a four seconds audio segment. In blue, the audio signal’s waveform is represented. In orange, the VAD output is represented signaling whether there is speech or not.
Cross-talk detection
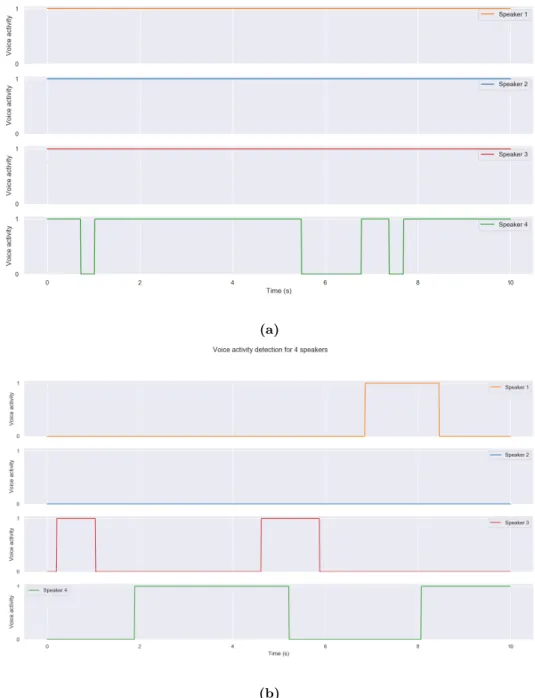
As a starting point, the VAD output is used by itself to understand how it deals with cross-talk without any post-processing. Soon it was realized that it was struggling by inspecting some conversational features such as speech time and overlapping time between participants, as seen in Figure 3.4. It is noticeable by the figure that the VAD output mistakenly detects speech segments in cross-talk situations. In fact, considering the VAD output, in this segment the overlap between the four participants would be almost total during the whole segment while, from the annotation, it is clear that the overlap occurs only in two short moments. Furthermore, as mentioned earlier, based on previous works it is expected that the overlap might be frequent but short, as in the annotated segment. On the other hand, without any further processing, the VAD output alone generates an overlap ratio of 30% between participants which accounts for an overlap of 20 seconds per each minute of detected speech.
(a)
(b)
Figure 3.4: Speech signal comparison between annotated segment and VAD output. (a) VAD algorithm’s output for 4 different speakers in a 10 seconds segment. (b) Annotated data for the same segment. It is possible to visualize that the VAD output detects that speakers overlap almost in the entire segment while, in reality, they don’t. This figure shows the cross-talk influence on VAD output.
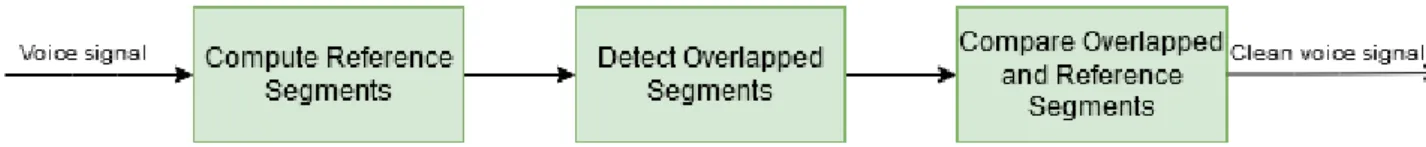
For cross-talk detection, a processing pipeline has been developed that utilizes both the acoustic signal and the VAD output to decide whether a segment is considered as voiced due to cross-talk or not. The pipeline consists of three stages, as illustrated in Figure 3.5, that are discussed below. Furthermore, the process of cross-talk detection is illustrated in the flow chart depicted in Figure 3.6
Figure 3.5: Cross-talk detection pipeline. Diagram representing the three stages of the cross-talk detection’s pipeline.
Then, to detect cross-talk, the first step is to calculate the voiced segments of each speaker that inevitably correspond to moments of single speech, i.e., when only one speaker is active at the time.
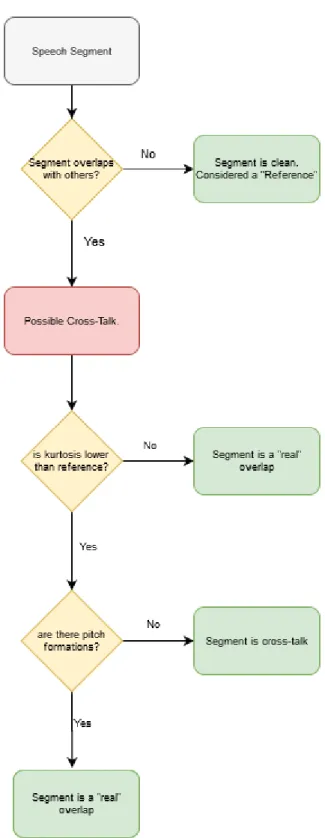
From the VAD output, there is the possibility to extract segments that are most likely “clean”, that is, without possibility of cross-talk. The rationale behind this is that VAD algorithms can identify activity even though they cannot distinguish its source. If we discard the segments in which activity is detected for more than one speaker at the same time, we get the parts of the audio in which only one speaker is active. Therefore we have isolated the segments where one and only one speaker is active. These are also referred as “local channel” or “speaker alone” in previous studies [18] while they are referred as reference in this work. This information is useful to have because we can use these segments to characterise the speech signals of each speaker which will later help us to detect cross-talk situations. In other words, we can inspect these segments in terms of energy, pitch or any other acoustic feature and compare each possible cross-talk situation for a speaker with its “clean” frames. The second step is to detect possible cross-talk situations for each participant. The detection of possible cross-talk situations is a task that can be done in many ways. The approach adopted in this work is to identify segments in which the VAD has detected activity for more than one speaker, i.e. situations in which there is an overlap between the speech signals of two or more speakers. The question that needs to be answered is: are these overlaps “real” or are they cross-talk? For this, we compare the overlapping segments of a speaker with its “reference segments”.
For each speaker that its signal is overlapping with others in a certain segment, we compare the speaker’s overlapped frames with its own reference segments. The comparison is based on a set of the signal’s features. Namely, we use the pitch and the short-time signal kurtosis to decide if the segment is cross-talk or not. It has been shown by De Leon [61] that the kurtosis of overlapping speech is generally less than the kurtosis of “clean” segments. This was also validated by Wrigley, Brown, Wan, et al. [18] who found that the kurtosis was one of the best features to detect cross-talk. Therefore, we can compare the overlapping speech segments with the speaker’s reference segments, which in our work are the “clean” speech utterances. If the overlapping segment’s kurtosis is lower than the reference values, then it is possible that it is cross-talk. We make an additional check by using the pitch of the segment. If the segment’s pitch is zero, then we assume that the overlapping speech happens due to cross-talk. When a segment does not contain any voiced activity from the local speaker, it is more likely that pitch formations are not consistent or even non existing.
Figure 3.6: Flow-chart representing the decision’s process of classifying a segment as cross-talk or real overlap.
Measures of cross-talk detection accuracy
One important resource to test and refine cross-talk detection methods is to have an under-standing of how much of it is being detected, at each stage, and how it relates with actual cross-talk situations by analysing the annotated audio data. This will enable testing different
techniques in search of the optimal method to use. It should be noted that different methods may be more appropriate for different use cases and, naturally, it is important to study the data in order to adapt the proposed methods to it. As mentioned, for this work we are going to study group meetings where participants are sitting around a table. Each one of them has a personal headset that is recording its audio to a separate channel and, therefore, our audio data has one channel per participant. This has implications in terms of processing because we know, at each time, which microphone is detecting activity and we do not need to use processing techniques such as speaker diarization on the whole length of the signals. Moreover, the data set contains annotated data about speaker’s activity (as described above), in terms of utterances, that are used to validate the cross-talk and EOU detection methods for this application.
The first step is to define metrics to evaluate the cross-talk detection algorithm and its results: True Positive Rate (TPR), or recall, and False Positive Rate (FPR). The recall, or sensitivity, is an interesting metric to validate the cross-talk detection algorithm’s results because it answers the question "from the real voiced segments, which ones are correctly classified". It is important to guarantee that the real speech segments that are captured by the VAD are not discarded by the post-processing methods.
On the other hand, the FPR will answer the question "from the frames classified as voiced, how many were actually unvoiced segments". This is, perhaps, the most relevant measure to take in to account since we expect that there will be some cross-talk, and many segments classified as voiced by the VAD will be in fact unvoiced.
It is important to keep the FPR as low as possible without decreasing the TPR, as it is an important trade-off that has to be balanced. Moreover, for a more intuitive analysis of these methods, it is useful to use some higher level features to understand the impact of post-processing techniques on aspects that influence the analysis of how the communication is unveiling. In this case, the total speech time and the overlap time between the speakers are considered.
In terms of TPR and FPR, without any cross-talk detection, the VAD algorithm has a sub-optimal performance which is verified by its high FPR of 0.40. It is to be noted that the TPR is also high (0.94) since this algorithm constantly classifies frames as voiced due to cross-talk. If an algorithm blindly classifies every frame as voiced, the TPR would likely be 1 since every real voiced frame is correctly classified. On the other hand, the FPR would be high as well, as in this case, since every real unvoiced frame would be wrongly classified as
voiced.
Cross-talk removal
The cross-talk phenomenon is addressed by using the kurtosis and pitch of overlapping segments, as explained earlier. In fact, comparing with the annotated data, this method achieved a 0.29 FPR while keeping the TPR in 0.81. Compared with the “naive” VAD output, this means that the FPR decreased by 11 percentual points, from 0.40 to 0.29, but, on the other hand, the TPR decreased as well by 13 percentual points, from 0.94 to 0.81. Nonetheless,