1
Please cite this article as: Debasu ML, Oliveira H, Rocha J, Carlos LD, Colloidal (Gd0.98Nd0.02)2O3 nanothermometers operating in a cell culture medium within the first
and second biological windows, Journal of Rare Earths,
Colloidal (Gd0.98Nd0.02)2O3 nanothermometers operating in a cell culture medium within the first and second biological windows§
M. L. Debasua,b*, H. Oliveirac, J. Rochab, L.D. Carlosa**
a
Department of Physics, CICECO – Aveiro Institute of Materials, Universidade de Aveiro, 3810-193 Aveiro, Portugal
b
Department of Chemistry, CICECO – Aveiro Institute of Materials, Universidade de Aveiro, 3810-193 Aveiro, Portugal
c
Department of Biology, CESAM, Laboratory of Biotechnology and Cytomics, Universidade de Aveiro, 3810-193 Aveiro, Portugal
Abstract Non-contact, self-referenced and near-infrared luminescent nanothermometers have been recognized as emerging tools in the fields of nanomedicine and nanotechnology due to their great capability of precise temperature readout at the nanoscale and real-time deep-tissue imaging. However, the development of multifunctional and biocompatible luminescent nanothermometers operating within the optically transparent biological windows with high thermal sensitivity (>2.0%/K) remains challenging. Here, we present (Gd0.98Nd0.02)2O3 nanothermometers operating effectively within the first and second biological windows upon continuous-wave laser diode excitation at 808 nm. Ratiometric thermometric parameters are defined by the relative changes in the emission intensities originating from the two Stark components of the 4F3/2 level (R2 and R1) to the 4I9/2 (900– 1000 nm), 4I11/2 (1035–1155 nm) and 4I13/2 (1300–1450 nm) multiplets. The thermometric parameters are evaluated for colloidal samples in a cell culture medium and powder samples, and the highest thermal sensitivity (2.18%/K at 298 K) is attained for the former in the first biological window (both the excitation and emission in the 800–965 nm range). The repeatability and temperature uncertainty are 99% and 1.2 K, respectively. The nanothermometers are biocompatible with human MNT-1 melanoma and HaCaT cells for 24 hours of exposure and nanoparticle concentration up to 0.400 mg/mL, showing their potential for applications in nanomedicine, e.g., intracellular imaging and temperature mapping.
Keywords: Gd2O3, Nd3+-doped nanoparticles, Luminescent nanothermometry, Thermal sensitivity, Cytotoxicity of nanoparticles, rare earths.
§ Foundation item: Project supported by CICECO-Aveiro Institute of Materials (FCT Ref. UID/CTM/50011/2019) and CESAM (Ref No. FCT UID/AMB/50017 - POCI-01-0145- FEDER-007638).
*Corresponding author: L.D. Carlos, E-mail: [email protected]; Tel: +351 234370946; M. L. Debasu, E-mail: [email protected] (actual address: Center for High Technology Materials, University of New Mexico, NM, Albuquerque, 87106, United Sates)
3
1. Introduction
In the last five years, significant progress has been made in the development of biocompatible, efficient and accurate nanoprobes for applications in nanomedicine and nanotechnology,1-4 such as intracellular temperature sensing,5 in vivo/in vitro imaging,6 clinical diagnosis,7 drug delivery,8 and cancer therapy.9 The widely employed probing materials include quantum dots,10 carbon nanomaterials,11 plasmonic nanostructures,12 nanodiamonds,13 polymeric nanoparticles,14 and luminescent nanocrystals.15, 16 In particular, trivalent lanthanide ions (Ln3+)-based optical nanoprobes have received much attention in the emerging technologies where real-time and simultaneous multifunctional applications are highly demanded, e.g., temperature mapping, deep-tissue optical imaging and photodynamic therapy.17, 18 This is mainly attributed to the unique features of the Ln3+: long-excited state lifetimes, temperature-dependent emissions, sharp-emission/absorption bands, large Stokes shifts, rich 4f electronic energy level structures, high emission photostability, among many other. In this context, Nd3+ has been an outstanding dopant exhibiting both the excitation and emission lines lying within the so-called optically transparent biological windows (BWs), 750–950 nm (BW-I) and 1000–1700 nm (BW-II).15, 19, 20
The light absorption, scattering and autofluorescence by tissue and/or biological medium are minimal in these windows, offering the highest tissue penetration depth, for instance, for real-time deep-tissue in vivo imaging.6, 21 Moreover, the Nd3+ NIR emission lines enable non-contact luminescent thermometry operating within the referred biological windows with remarkable temperature sensitivity and resolution.21,22
The great majority of Nd3+-based luminescent thermometers reported in the literature use the relative emission intensity ratio of two Stark components of a given energy level as the thermometric parameter, e.g., (4F3/2(R2)→4I9/2)/(4F3/2(R1)→4I9/2).23-27 However, this approach suffers from a very low relative thermal sensitivity (<0.5%/K) associated with the small energy gap (~100 cm−1) between two consecutive Stark levels. The selection of an appropriate Nd3+ host lattice may increase such thermal sensitivity by improving the splitting of the Stark components and enlarging the respective energy gap. Moreover, the well-resolved Nd3+ emission bands allow the accurate determination and selection of the thermometric parameters without the requirement of high-resolution optical detection systems, unsuitable for practical applications. To date, fluoride hosts (e.g., LaF3, SrF2, CaF2, NaYF4, NaGdF4 and LiYF4)25, 27-29 have been widely used for developing Nd3+-based nanothermometers. In these hosts, however, the Nd3+emissions from the Stark components of a given energy level manifold are generally poorly resolved relatively to the corresponding spectral emissions in other inorganic hosts, such as cubic Y2O3 and Gd2O326, 30-33
and yttrium aluminium garnet (YAG).34 Comparatively, the Nd3+ NIR emission lines of the latter hosts are much better resolved even in the biological media and ex-vivo experiments (e.g., in human whole blood35 and chicken breast34). Nevertheless, the Nd3+ host oxides have been barely employed for in vitro/in vivo thermal sensing and bioimaging applications.
Over the last couple of years, several promising strategies have been employed to substantially increase the thermal sensitivity of Nd3+-based luminescent thermometers including i) utilizing the intensity ratio of emission bands originating from two distinct Nd3+ energy levels (e.g., 4F5/2 and 4F3/2),29, 31, 36 ii) co-doping Nd3+ with other Ln3+ (e.g., Er3+/Nd3+, Ho3+/Nd3+ and Yb3+/Nd3+)37-39 and with transition metal ions (e.g., Cr3+/Nd3+),40, 41
mechanism.42 For instance, the highest Nd3+ sensitivity of 1.75%/K was first reported for Nd3+-doped Gd2O3 nanothermometers excited at 580 nm, defining the thermometric parameter as the intensity ratio between the Nd3+ 4F5/2 →4I9/2 and 4F3/2→4I9/2 transitions.31 Marciniak et al.41 demonstrated that such thermal sensitivity can be further increased up to 3.48%/K by using the intensity ratio of Cr3+ (630–715 nm) to Nd3+ (870–920 nm) emissions in YAG nanocrystals upon excitation at 590 nm. Despite such high thermal sensitivities reported so far,29-31, 41 the Nd3+-based nanothermometers are partially operative within the biological windows (under excitation outside the windows), and their thermometric properties are not studied in the target biological media, and in vitro biocompatibilities are not evaluated. Labrador-Páez et al.55 recently reported that several experimental factors (e.g., sample inhomogeneities and detection systems) and/or the surrounding medium (solvent type and biological medium) could be potential sources of artefacts, leading to false temperature readings of luminescent nanothermometers.43 Therefore, a thorough understanding of the actual thermometric responses of Ln3+-based optical sensors in the target environment and relevant control of the experimental conditions are crucial to develop more accurate and reliable nanothermometers.
Here, we wish to report nanothermometers effectively operative within the first and second optically transparent BWs based on (Gd0.98Nd0.02)2O3 spherical particles under laser diode excitation at 808 nm in the physiological temperature range (298–338 K). The thermometric parameters were evaluated and compared for powder samples and colloidal nanoparticles in cell culture medium (Dulbecco's modified Eagle's medium, DMEM) using the integrated intensity ratio between the emissions originated from the 4F
3/2 Stark sublevels (R1 and R2) to the 4I9/2, 4I11/2 and 4I13/2 multiplets: i) 4F3/2(R2)→4I9/2(Z5)/4F3/2(R1) →4I9/2(Z5), ii) 4
F3/2(R2)→4I11/2(Y1)/4F3/2(R1)→4I11/2(Y1), and iii) 4F3/2(R2)→4I13/2(X2)/4F3/2(R1)→4I13/2(X2). The thermal sensitivity is highly dependent on the medium and an unprecedented high sensitivity of 2.18%/K at 298 K is achieved for the colloidal nanoparticles in the 800–965 nm range (BW-I), Table 1. The nanothermometers are biocompatible with human MNT-1 melanoma and HaCaT cells for nanoparticles’ concentration up to 0.400 mg/mL and 24 hours exposure time. Such thermometric studies in culture medium within the BWs and the cytotoxicity reports are scarce for the Nd3+-doped Gd
2O3 nanothermometers (Table 1).
2. Experimental 2.1. Materials
Gd2O3 (99.9%) and Nd2O3 (99.9%) (Jinan Henghua Sci. & Tec. Co., Ltd.) were purchased and dissolved separately in ultra-pure nitric acid (HNO3 65%, PA-ISO) to obtain the respective lanthanide nitrate solutions, i.e., Gd(NO3)3 and Nd(NO3)3. Urea (Sigma- Aldrich, ≥98.0%), Hexadecyltrimethylammonium bromide (CTAB) (Sigma-Aldrich,
≥98.0%) and absolute ethanol (Fisher Scientific, 99.5%) were used in the synthesis. Dulbecco's modified Eagle's medium (DMEM), fetal bovine serum (FBS), L-glutamine, penicillin-streptomycin, fungizone, trypsin and phosphate-buffered saline solution (PBS) were all purchased from Gibco (Life Technologies, Carlsbad, CA, USA). 3-(4,5- dimethylthiazol-2-yl)-2,5-diphenyltetrazolium bromide (MTT) and dimethyl sulfoxide (DMSO) were purchased from Sigma-Aldrich (St. Louis, MO, USA). Chemicals were used as received without further purification.
5
2.2. Synthesis of Nd3+-doped Gd2O3 nanospheres
A modified co-precipitation procedure44, 45 was used to prepare Nd3+ doped Gd2O3 spherical nanoparticles. Briefly, aqueous solutions of Gd(NO3)3 (1.45 mL, 0.4 mol/L) and Nd(NO3)3 (0.060 mL, 0.2 mol/L) were mixed in a round-bottom-flask. Distilled water (150 mL), urea (1.47 g) and CTAB (0.47 g) were added to this mixture. After 30 min of vigorous stirring and 3 min of ultra-sonication, the solution was heated up at 348 K for 4 hours. After cooling to room temperature, the precursor was separated by centrifugation and washed several times with distilled water and finally with ethanol. The precursor was dried at 348 K in air for at least 12 h. To obtain crystalline (Gd1–nNdn)2O3 nanoparticles, n=0.015 representing the nominal molar concentration, the precursor was calcined at 1073 K for 1 h in air with heating and cooling rates of 5 K/min. The nominal amount of Nd3+ was increased to n=0.025 and 0.050 following the same procedure by changing the relative amount of Nd3+ and Gd3+.
2.3. X-ray diffraction (XRD)
Powder XRD patterns were recorded in the range of 15°2θ65° on a PANalytical Empyrean X-ray diffractometer operating at 45 kV and 40 mA (Cu Kα1 radiation source at 0.15406 nm) in reflection spinning scan mode with a 0.013o step size. Nanocrystal’s sizes were calculated using Scherrer’s equation. Rietveld refinement of the measured diffraction patterns was performed using HighScore Plus software and the reference data of cubic Gd2O3 (04-016-1843) was taken from the International Centre for Diffraction Data database.
2.4. Electron microscopy
The morphology of the nanoparticles was examined on a Hitachi HD-2700 scanning transmission electron microscope (STEM) operating at an acceleration voltage of 200 kV. 2.5. Dynamic light scattering (DLS)
The hydrodynamic sizes and zeta potentials of the nanoparticles suspended in distilled water and DMEM were analysed at 298 K on a Malvern Zetasizer Nano series instrument, Nano-ZS (Red badge operating with a 632.8 nm laser, Model ZEN3600, UK). A folded capillary cell (DTS1070, Malvern Instruments) was used for the measurements.
2.6. Fourier transform infrared spectroscopy (FTIR)
FTIR spectrum in transmittance mode was recorded on a Bruker FTIR TENSOR 27. The nanoparticles (1.5 mg) were mixed with 200 mg KBr. The mixture was ground and pressed uniaxially with 9 t for 2 min and a semi-transparent pellet was obtained. Spectrum was recorded between 350 and 4000 cm−1 with 256 scans and 4 cm−1 resolution.
2.7. Inductively coupled plasma atomic emission spectroscopy (ICP-AES)
Elemental analysis of the samples was performed on an ICP-AES (Activa-M, Horiba Jobin Yvon). The nanoparticles suspended in distilled water (1.5 mg, 5 mL) were dissolved with ultra-pure nitric acid (HNO3 65%, PA-ISO).
2.8. Photoluminescence
Emission spectra in the infrared (IR) region were recorded on a modular double grating excitation spectrofluorimeter with a TRIAX 320 emission monochromator (Fluorolog-3, Horiba Scientific) coupled to a H9170 Hamamatsu photomultiplier, using a front face acquisition mode. The excitation source was a NIR continuous-wave laser diode (PSU-FC- 808-3W, CNI Co., Ltd.), emitting a nearly Gaussian beam centred at 808 nm and connected to an optical fibre (SMA905, cp400 μm × 2 m, CNI Co., Ltd.). The laser beam profile on the sample was analyzed on a Thorlabs CCD camera-based beam profiler (BC106N-
VIS/M) integrated with a beam analyzing software package (Thorlabs), resulting in an average spot area of (0.015±0.001)10−4 m2. The laser power on the sample (1.05±0.06 W) was measured using a FieldMaxII-TOP laser power/energy meter (Coherent Inc.,) with neutral density filters (NE13B-B and NE20B-B, Thorlabs) used to avoid saturation of the power meter. The laser power density on the sample was 70104 W/m2. Temperature- dependent measurements were performed using a Kapton thermofoil heater (Minco) mounted on a Cu holder, (2.52.5)10−4 m2, and coupled to a temperature controller (IES- RD31). The temperature controller incorporates a Barnant thermocouple 100 (model 600- 2820, uncertainty: 0.1 K, according to the manufacturer). One side of a quartz cuvette (CV10Q1400, Thorlabs) containing nanoparticles suspended in DMEM (1 mL, 0.250 mg/mL) was placed in contact with the Cu holder; a thermally conductive paste (WLP 500, Fischer Elektronik) was used to maintain an effective thermal contact. The temperature of the suspension was measured by a thermocouple (VWR I620-20147, uncertainty of 0.1 K). The optimal nanoparticle concentration of the suspension (0.250 mg/mL) was determined based on the cell viability results (cell viability higher than 70% for 24 hours) and the emission intensity of the nanoparticles in the culture medium. For powder samples, powder pellets (2.5 mg) were placed directly on the Cu holder. For a given setpoint temperature of the controller, the temperature of the pellet was measured by the thermocouple (VWR I620- 20147) placed in contact with the Cu holder and edge of the pellet. The laser power density was maintained constant at 70104 W/m2 in all the spectral measurements.
2.9. Cell lines and culturing conditions
Human melanoma MNT-1 cells were generously provided by Doctor Manuela Gaspar (iMed.ULisboa, Portugal). Immortalized human keratinocyte HaCaT cells were obtained from Cell Lines Services (Eppelheim, Germany). MNT-1 and HaCaT cells were cultured in DMEM, supplemented with 10% FBS, 2 mmol/L l-glutamine, 100 U/mL penicillin/10010−3 mg/mL streptomycin, and 2.510−3 mg/mL fungizone in a humidified incubator at 310 K and 5% CO2. Cell morphology was observed using an inverted microscope Nikon Eclipse 80i (Nikon, Tokyo, Japan).
2.10. Cell viability
The cytotoxic effects of (Gd0.98Nd0.02)2O3 nanoparticles were determined by the colorimetric 3-(4,5-dimethyl-2-thiazolyl)-2,5-diphenyl tetrazolium bromide (MTT) assay. Briefly, MNT-1 and HaCaT cells were seeded separately in 96-well plates and allowed to adhere. After adhesion, cells were incubated for 24, 48 and 72 h with a set of six concentrations of (Gd0.98Nd0.02)2O3 nanoparticles (0.013, 0.025, 0.050, 0.100, 0.200 and 0.400 mg/mL), at 310 K in 5% CO2. The control received only the culture medium. Upon exposure, 0.050 mL MTT solution (1 mg/mL in PBS, pH=7.2) was added to each well. After 4 hours of incubation, the medium from each well was replaced with 0.150 mL DMSO to dissolve the formazan crystals. The plate was shaken for about 2 h protected from light. Cell viability was measured by the optical density of reduced MTT at 570 nm using a microplate reader (Synergy HT from BioTeK Instruments Inc., Winooski, VT, USA). The percentage of viable cells was determined as the ratio between the absorbance of treated versus control cells.
3. Results and discussion
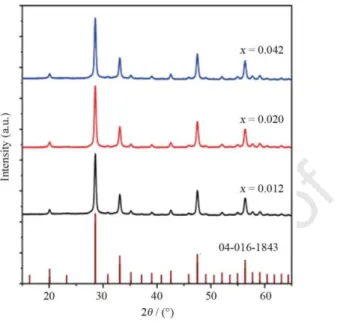
ICP-AES analysis revealed that the actual amounts of Nd3+ relative to Gd3+ denoted by x in the final (Gd1–xNdx)2O3 nanoparticles are x=0.012, 0.020, and 0.042. Powder XRD
7
r
patterns of (Gd1–xNdx)2O3 nanoparticles confirm the presence of cubic Gd2O3 (card #: 04- 016-1843), Fig. 1. As no additional reflections are observed, the samples have no detectable impurity phases. The crystallite sizes (Scherrer’s equation) are essentially independent of the Nd3+ concentration, 28.2±1.5, 26.7±1.2, and 28.0±1.5 nm for, respectively, x=0.012, 0.020, and 0.042.
Representative TEM images and the corresponding particle size distributions of the nanoparticles are shown in Fig. 2 and Fig. S1. The nanoparticles are spherical with sizes 84±8 nm, 80±7 nm, and 82±10 nm for, respectively, x=0.012, 0.020, and 0.042, in agreement with the hydrodynamic size (Fig. S2). The different particle sizes obtained by XRD and TEM suggest the nanoparticles comprise several crystallites.
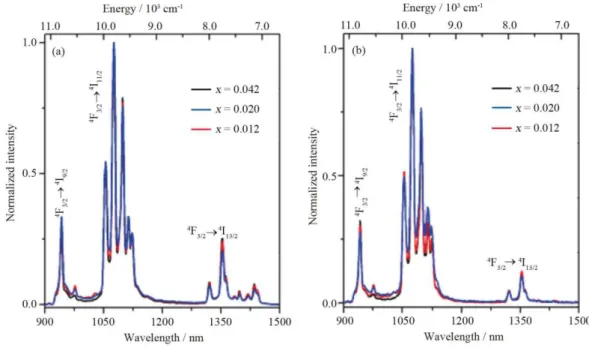
Fig. 3 shows the emission spectra of the nanoparticles in the powder form and DMEM. In both cases, three distinct spectral regions are observed and assigned to the 4F3⁄2→4I9⁄2 (900–1000 nm), 4F3⁄2→4I11⁄2 (1000 –1150 nm), and 4F3⁄2→4I13⁄2 (1300–1450 nm) transitions.26 The Nd3+ content has no significant effect on the emission spectral profiles, in both media (Fig. 3A-B). However, the relative intensity of the 4F
3⁄2→4I13⁄2 (1300–1450 nm) transition is partially decreased in the culture medium that might be due to the quenching by the charged species in the medium (see below). In what follows, results will be reported only for (Gd0.98Nd0.02)2O3 nanoparticles. To understand the colloidal stability and surface charge of the nanoparticles, DLS and Zeta potential measurements were performed. Both DLS and Zeta potential data reveal that the colloidal nanoparticles are stable in the culture medium (Fig. S2 and Table S1). The nanoparticles are more stable in DMEM than in distilled water due to the presence of charged species in the former (e.g., FBS) that increases its stability. FTIR spectrum of the powder nanoparticles shows vibrational bands around 1500 cm−1 and 850 cm-1 attributed to the carbonate group, due to adsorption of CO2 on the surface of the nanoparticles (Fig. S3). The presence of OH– species on the surface of the nanocrystals is witnessed by the bands at 3550 cm–1. The Gd-O vibration peaks of cubic Gd2O3 are observed between 510 and 420 cm−1.
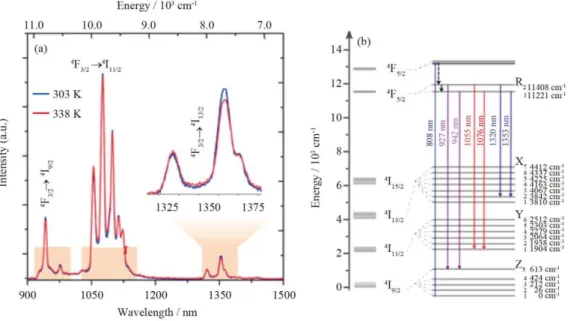
NIR emission spectra were measured at different temperatures in the physiological, 298–338 K, range (Fig. 4 and Fig. S4). The relative emission intensity in the three spectral regions 4F3⁄2→4I9⁄2 (900–1000 nm), 4F3⁄2→4I11⁄2 (1035–1155 nm), and 4F3⁄2→4I13⁄2 (1300– 1450 nm) changes with temperature, enabling its use in ratiometric thermometry in BW-I and BW-II. Fig. 4B depicts a simplified energy level diagram of Nd3+,26, 46 with details of the Stark components for the 4F3⁄2, 4I9⁄2, and 4I11⁄2 levels. The assignment of the specific emission lines within the Stark multiplets was made based on a high-resolution emission spectrum recorded at room temperature for powdered nanoparticles (Fig. S5). The thermometric parameters ∆1–3 are defined as the integrated intensity ratios i)
4 F3/2(R2)→ 4 I9/2(Z5)/ 4 F3/2(R1)→ 4 I9/2(Z5), ii) 4 F3/2(R2)→ 4 I11/2(Y1)/ 4 F3/2(R1)→ 4
I11/2(Y1) and iii) 4
F3/2(R2)→4I13/2(X2)/4F3/2(R1)→4I13/2(X2):
Δ =𝐼1
𝐼2 (1)
The integrated intensity of each emission peak originated from 4F3⁄2(R2,R1) was determined by employing a Gaussian multiple peak fit (Origin®), as shown in Fig. 5-7 and Fig. S6. A figure of merit to compare the performance of distinct luminescent thermometers is the relative temperature sensitivity, Sr:
as proposed by Brites et al.47
S = 1 ∂∆
The temperature calibration curve was made by using the empirical temperature dependence of the above-defined ∆1-3 parameters, Fig. 5-7. The relative sensitivities shown in Fig. 5-7 and Fig. S6-S8 were obtained by dividing the slope of the calibration curve by the corresponding ∆ parameter.48 The obtained values are collected in Table 1. For comparison, the sensitivities of Nd3+-based nanothermometers reported in the literature are also presented. The sensitivity values of the (Gd0.98Nd0.02)2O3 nanoparticles in the culture medium are higher than the corresponding thermal sensitivities obtained for powdered samples (Table 1). The highest sensitivity of 2.18%/K at 298 K is achieved within BW-I between 918 and 965 nm, Fig. 5(d) and Table 1. At present, the origin of thermal sensitivity increment in the culture medium is not known but it cannot be explained by the conventional definition of thermometric parameter and sensitivity based on two thermally coupled energy levels whose populations follow the Boltzmann's distribution. Changes in the peak energies of the Stark components of the intra-4f transitions that, in general, are quite insensitive to the environment and thus drastic changes on the energy gap between the Stark sublevels, which lead to elevated thermal sensitivity, are not expected.
It is of interest to assess the stability, repeatability and uncertainty of the
nanothermometers. The thermometric parameter ∆ remains unchanged (>99% accuracy) in twelve consecutive cycles between 303 and 323 K, Fig. 8(a). The temperature fluctuation of the thermometers was estimated from continuous measurements at a fixed temperature. The thermal fluctuation of the measurement (taken as the experimental temperature uncertainty) is 1.2 K, Fig. 8(b). The temperature uncertainty can be further improved by increasing the integration time.49
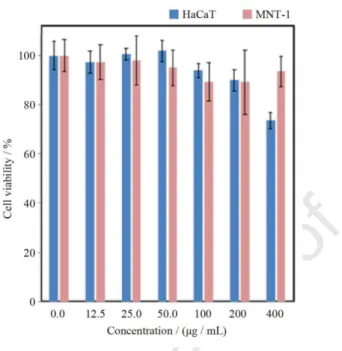
Figs. 9 and S9 show the in vitro cell viability of MNT-1 melanoma and HaCaT cells treated with (Gd0.98Nd0.02)2O3 nanoparticles for different incubation periods. For 24 hours exposure period and nanoparticles’ concentrations up to 0.400 mg/mL, the viability of both cell lines is above 70%, which can be considered non-cytotoxic according to the norm ISO 10993-5:20099(en). Furthermore, the toxicity profile is similar for both cell lines, for concentrations up to 0.200 mg/mL. The cytotoxicity of these nanoparticles increases with the concentration and exposure time (Fig. S9) for both cell lines reaching ca. 40% and 13% cell viability at 0.400 mg/mL for 72 h of incubation time for MNT-1 melanoma and HaCaT cells, respectively, in agreement with previous toxicity reports for various cell lines treated with analogous materials.49, 50 This indicates that appropriate surface coating and biofunctionalization of the nanoparticles may be required when longer exposure time and higher nanoparticle concentration are required.51 Work is in progress along this line.
4. Conclusions
The thermometric performance of (Gd0.98Nd0.02)2O3 nanothermometers was evaluated in the physiological temperature range 298–338 K for powder samples and in cell culture medium (Dulbecco's modified Eagle's medium, DMEM). The nanothermometers were fully operative within the biological windows upon 808 nm laser excitation (BW-I), emitting in three distinct spectral regions: 900–1000 nm and 1000–1155 nm (BW-I), and 1300–1450 (BW-II). The thermometric parameters were defined using the integrated intensity ratio between the emissions originated from the 4F3/2 Stark sublevels to the 4I9/2, 4I11/2 and 4I13/2 multiplets: i) 4F3/2(R2) →4I9/2(Z5)/4F3/2(R1) →4I9/2(Z5), iii) 4F3/2(R2) →4I11/2(Y1)/4F3/2(R1)→4I11/2(Y1) and iii) 4F3/2(R2) →4I13/2(X2)/4F3/2(R1) →4I13/2(X2). The temperature sensitivity is highly dependent on the medium, and an unprecedented high sensitivity (2.18%/K at 298 K) is achieved for the colloidal nanoparticles in the culture medium within the BW-I (800–965
9
nm). The nanothermometers are stable in the culture medium showing high repeatability (99%) with temperature uncertainty of 1.2 K. The in vitro study showed the nanothermometers are biocompatible with MNT-1 melanoma and HaCaT cells (viability >70% after 24 hours of incubation and for concentration up to 0.400 mg/mL), showing their potential for, e.g., photoluminescence imaging and intracellular temperature mapping. Acknowledgments
This work was partially developed in the scope of the projects CICECO-Aveiro Institute of Materials (FCT Ref. UID/CTM/50011/2019) and CESAM (Ref No. FCT UID/AMB/50017 - POCI-01-0145-FEDER-007638), financed by national funds through the FCT/MCTES. Financial support of FCT under projects PTDC/FIS-OUT/31469/2017 (POCI-01-0145- FEDER-031469), PTDC/BTM-MAT/31794/2017 (POCI-01-0145-FEDER-031794) and PTDC/CTM-NAN/4647/2014 (POCI-01-0145-FEDER-016687) is acknowledged. MLD thanks FCT for the financial support in the scope of the doctorate level work contract foreseen in Article 23 under the numbers 4, 5 and 6, of the Decree-Law 57/2016 of August 29, changed by Law 57/2017 of July 19. HO also acknowledges FCT for the research contract under Stimulus of Scientific Employment 2017 (CEECIND/04050/2017). The help of F. Campos and V. Bastos in the cell culture experiments is gratefully acknowledged.
References
[1] Pelaz B, Alexiou C H, Alvarez -Puebla R A, Alves F, Andrews A M, Ashraf S, et al. Diverse applications of nanomedicine. ACS Nano. 2017;11(3):2313.
[2] Tsang M K, Wong Y T, Hao J H. Cutting-edge nanomaterials for advanced multimodal bioimaging applications. Small Methods. 2018;2(1).
[3] Lamprecht A. Nanomedicines in gastroenterology and hepatology. Nat Rev Gastro Hepat. 2015;12(4):195.
[4] Conde J, Dias J T, Grazu V, Moros M, Baptista P V, de la Fuente J M. Revisiting 30 years of biofunctionalization and surface chemistry of inorganic nanoparticles for nanomedicine. Front Chem. 2014;2.
[5] Carrasco E, del Rosal B, Sanz‐Rodríguez F, de la Fuente Á J, Gonzalez P H, Rocha U, et al. Intratumoral thermal reading during photo‐thermal therapy by multifunctional fluorescent nanoparticles. Adv. Funct. Mater. 2015;25(4):615.
[6] Liu T M, Conde J, Lipinski T, Bednarkiewicz A, Huang C C. Revisiting the classification of NIR-absorbing/emitting nanomaterials for in vivo bioapplications. Npg Asia Mater. 2016;8.
[7] Jin Y Y, Ni D L, Gao L, Meng X F, Lv Y, Han F, et al. Harness the power of upconversion nanoparticles for spectral computed tomography diagnosis of osteosarcoma. Adv Funct Mater. 2018;28(33).
[8] He S, Tourkakis G, Berezin O, Gerasimchuk N, Zhang H R, Zhou H Y, et al. Temperature-dependent shape-responsive fluorescent nanospheres for image-guided drug delivery. J Mater Chem C. 2016;4(14):3028.
[9] Tian G, Zhang X, Gu Z, Zhao Y. Recent advances in upconversion nanoparticles-based multifunctional nanocomposites for combined cancer therapy. Adv. Mater. 2015;27(47):7692.
[10] Maestro L M, Ramírez-Hernández J E, Bogdan N, Capobianco J A, Vetrone F, Solé J G, et al. Deep tissue bio-imaging using two-photon excited CdTe fluorescent quantum dots working within the biological window. Nanoscale. 2012;4(1):298.
[11] Hong G S, Diao S O, Antaris A L, Dai H J. Carbon nanomaterials for biological imaging and nanomedicinal therapy. Chem Rev. 2015;115(19):10816.
[12] Hanske C, Sanz-Ortiz M N, Liz-Marzán L M. Silica-coated plasmonic metal nanoparticles in action. Adv Mater. 2018;30(27).
[13] Alkahtani M H, Alghannam F, Jiang L, Almethen A, Rampersaud A A, Brick R, et al. Fluorescent nanodiamonds: Past, present, and future. Nanophotonics-Berlin. 2018;7(8):1423.
[14] Masood F. Polymeric nanoparticles for targeted drug delivery system for cancer therapy. Mat Sci Eng C-Mater. 2016;60:569.
[15] Dibaba S T, Ge X Q, Ren W, Sun L N. Recent progress of energy transfer and luminescence intensity boosting mechanism in Nd3+-sensitized upconversion nanoparticles. J Rare Earth. 2019;37(8):791.
[16] Bettinelli M, Carlos L D, Liu X. Lanthanide-doped upconversion nanoparticles. Phys. Today. 2015;68(9):38.
[17] Brites C D S, Balabhadra S, Carlos L D. Lanthanide-based thermometers: At the cutting-edge of luminescence thermometry. Adv. Opt. Mater. 2019;7(5):1801239.
[18] Ximendes E C, Rocha U, Jacinto C, Kumar K U, Bravo D, Lopez F J, et al. Self- monitored photothermal nanoparticles based on core-shell engineering. Nanoscale. 2016;8(5):3057.
[19] Hemmer E, Benayas A, Legare F, Vetrone F. Exploiting the biological windows: Current perspectives on fluorescent bioprobes emitting above 1000 nm. Nanoscale Horiz. 2016;1(3):168.
[20] del Rosal B, Rocha U, Ximendes E C, Rodriguez E M, Jaque D, Sole J G. Nd3+ ions in nanomedicine: Perspectives and applications. Opt. Mater. 2017;63:185.
[21] del Rosal B, Ximendes E, Rocha U, Jaque D. In vivo luminescence nanothermometry: From materials to applications. Adv. Opt. Mater. 2017;5(1):1600508.
[22] Liu B, Li C X, Yang P P, Hou Z Y, Lin J. 808-nm-light-excited lanthanide-doped nanoparticles: Rational design, luminescence control and theranostic applications. Adv. Mater. 2017;29(18):1605434.
[23] Wawrzynczyk D, Bednarkiewicz A, Nyk M, Strek W, Samoc M. Neodymium(III) doped fluoride nanoparticles as non-contact optical temperature sensors. Nanoscale. 2012;4(22):6959.
[24] Kolesnikov I E, Kalinichev A A, Kurochkin M A, Mamonova D V, Kolesnikov E Y, Kurochkin A V, et al. New strategy for thermal sensitivity enhancement of Nd3+-based ratiometric luminescence thermometers. J Lumin. 2017;192:40.
[25] Rocha U, Jacinto da Silva C, Ferreira Silva W, Guedes I, Benayas A, Martínez Maestro L, et al. Subtissue thermal sensing based on neodymium-doped LaF3 nanoparticles. ACS Nano. 2013;7(2):1188.
[26] Balabhadra S, Debasu M L, Brites C D S, Rocha J, Carlos L D. Implementing luminescence thermometry at 1.3 µm using (GdNd)2O3 nanoparticles. J. Lumin. 2016;180:25.
[27] Quintanilla M, Zhang Y, Liz-Marzan L M. Subtissue plasmonic heating monitored with CaF2:Nd3+, Y3+ nanothermometers in the second biological window. Chem Mater. 2018;30(8):2819.
11
[28] Chen G Y, Ohulchanskyy T Y, Liu S, Law W C, Wu F, Swihart M T, et al. Core/shell NaGdF4:Nd3+/NaGdF4 nanocrystals with efficient near-infrared to near-infrared downconversion photoluminescence for bioimaging applications. ACS Nano. 2012;6(4):2969.
[29] Rakov N, Maciel G S. Near-infrared emission and optical temperature sensing performance of Nd3+:SrF2 crystal powder prepared by combustion synthesis. J. Appl. Phys. 2017;121(11):113103.
[30] Kolesnikov I E, Kalinichev A A, Kurochkin M A, Mamonova D V, Kolesnikov E Y, Kurochkin A V, et al. Y2O3: Nd3+ nanocrystals as ratiometric luminescence thermal sensors operating in the optical windows of biological tissues. J Lumin. 2018;204:506. [31] Balabhadra S, Debasu M L, Brites C D, Nunes L A, Malta O L, Rocha J, et al. Boosting
the sensitivity of Nd3+-based luminescent nanothermometers. Nanoscale. 2015;7(41):17261.
[32] Nash K L, Dennis R C, Ray N J, Gruber J B, Sardara D K. Absorption intensities, emission cross sections, and crystal field analysis of selected intermanifold transitions of Ho3+ in Ho3+:Y2O3 nanocrystals. J Appl Phys. 2009;106(6).
[33] Starsich F H L, Gschwend P, Sergeyev A, Grange R, Pratsinis S E. Deep tissue imaging with highly fluorescent near-infrared nanocrystals after systematic host screening. Chem Mater. 2017;29(19):8158.
[34] Benayas A, del Rosal B, Perez-Delgado A, Santacruz-Gomez K, Jaque D, Hirata G A, et al. Nd:YAG near-infrared luminescent nanothermometers. Adv. Opt. Mater. 2015;3(5):687.
[35] Barrera F J, Yust B, Mimun L C, Nash K L, Tsin A T, Sardar D K. Optical and spectroscopic properties of human whole blood and plasma with and without Y2O3 and Nd3+: Y2O3 nanoparticles. Laser Med Sci. 2013;28(6):1559.
[36] Kalinichev A A, Kurochkin M A, Golyeva E V, Kurochkin A V, Lahderanta E, Mikhailov M D, et al. Near-infrared emitting YVO4:Nd3+ nanoparticles for high sensitive fluorescence thermometry. J Lumin. 2018;195:61.
[37] Skripka A, Benayas A, Marin R, Canton P, Hemmer E, Vetrone F. Double rare-earth nanothermometer in aqueous media: Opening the third optical transparency window to temperature sensing. Nanoscale. 2017;9(9):3079.
[38] Silva A F, Elan F, Falcão E L, Maia L J Q, de Araújo C B. Thermal sensitivity of frequency upconversion in Al4B2O9: Yb3+/Nd3+ nanoparticles. J Mater Chem C. 2017;5(5):1240.
[39] Ximendes E C, Santos W Q, Rocha U, Kagola U K, Sanz-Rodriguez F, Fernandez N, et al. Unveiling in vivo subcutaneous thermal dynamics by infrared luminescent nanothermometers. Nano Lett. 2016;16(3):1695.
[40] Marciniak Ł, Bednarkiewicz A, Strek W. The impact of nanocrystals size on luminescent properties and thermometry capabilities of Cr, Nd doped nanophosphors. Sens. Actuator B-Chem. 2017;238:381.
[41] Marciniak L, Bednarkiewicz A, Drabik J, Trejgis K, Strek W. Optimization of highly sensitive yag: Cr3+, Nd3+ nanocrystal-based luminescent thermometer operating in an optical window of biological tissues. Phys Chem Chem Phys. 2017;19(10):7343.
[42] Marciniak L, Bednarkiewicz A, Elzbieciak K. Nir-nir photon avalanche based luminescent thermometry with Nd3+ doped nanoparticles. J Mater Chem C. 2018;6(28):7568.
[43] Labrador-Páez L, Pedroni M, Speghini A, Garcia-Solé J, Haro-Gonzalez P, Jaque D. Reliability of rare-earth-doped infrared luminescent nanothermometers. Nanoscale. 2018;10(47):22319.
[44] Debasu M L, Riedl J C, Rocha J, Carlos L D. The role of Li+ in the upconversion emission enhancement of (YYbEr)2O3 nanoparticles. Nanoscale. 2018;10(33):15799. [45] Gai S L, Yang P P, Wang D, Li C X, Niu N, He F, et al. Monodisperse gd2o3:Ln (Ln=
Eu3+, Tb3+, Dy3+, Sm3+, Yb3+/Er3+, Yb3+/Tm3+, and Yb3+/Ho3+) nanocrystals with tunable size and multicolor luminescent properties. Crystengcomm. 2011;13(17):5480. [46] Carnall W T, Crosswhite H, Crosswhite H M. Energy level structure and transition
probabilities in the spectra of the trivalent lanthanides in LaF3: Argonne Nat. Lab. 78- XX-95 Rep., 1977.
[47] Brites C D S, Lima P P, Silva N J O, Millán A, Amaral V S, Palacio F, et al. Thermometry at the nanoscale. Nanoscale. 2012;4(16):4799.
[48] Debasu M L, Ananias D, Pastoriza-Santos I, Liz-Marzán L M, Rocha J, Carlos L D. All-in-one optical heater-thermometer nanoplatform operative from 300 to 2000 K based on Er3+ emission and blackbody radiation. Adv. Mater. 2013;25(35):4868.
[49] Debasu M L, Brites C D S, Balabhadra S, Oliveira H, Rocha J, Carlos L D. Nanoplatforms for plasmon-induced heating and thermometry. ChemNanoMat. 2016;2(6):520.
[50] Hemmer E, Takeshita H, Yamano T, Fujiki T, Kohl Y, Löw K, et al. In vitro and in vivo investigations of upconversion and NIR emitting Gd2O3:Er3+,Yb3+ nanostructures for biomedical applications. J Mater Sci: Mater Med. 2012;23(10):2399.
[51] Gnach A, Lipinski T, Bednarkiewicz A, Rybka J, Capobianco J A. Upconverting nanoparticles: Assessing the toxicity. Chem. Soc. Rev. 2015;44(6):1561.
13
Figures
Fig. 1. Powder XRD patterns of (Gd1–xNdx)2O3 nanoparticles and reference cubic Gd2O3 (04-016-1843).
Fig. 2. A representative TEM image (a) and corresponding particle size distribution (b). The solid line is the best fit to the experimental data using a lognormal function (r2>0.977) (more than 200 nanoparticles were measured).
15
Fig. 3. NIR emission spectra of (Gd1–xNdx)2O3 nanoparticles recorded at 298 K in powder form (2.5 mg) (a) and DMEM (0.250 mg/mL) (b).
Fig. 4. (a) NIR emission spectra of (Gd0.98Nd0.02)2O3 nanoparticles in DMEM at 298 and 338 K. The shaded regions depict BW-I and BW-II; (b) Partial energy level diagram of Nd3+ showing the transitions used for defining the thermometric parameters.
17
Fig. 5. (a) Emission spectrum of (Gd0.98Nd0.02)2O3 nanoparticles in the range of 918–965 nm within BW-I recorded at 298 K in DMEM. The shaded regions represent the deconvolution of the emission peaks and the corresponding integrated areas, I1 (4F
3/2(R2)→4I9/2(Z5)) and I2 (4F3/2(R1)→4I9/2(Z5)), that define the thermometric parameters are indicated. The blue line is the envelope of the best Gaussian multiple peak fit to the spectrum (r2>0.999); (b) Normalized integrated intensity of I1 (black circles) and I2 (squares); (c) Calibration curve. The line is the best linear fit to the data (r2 > 0.991); (d) Relative thermal sensitivity (Eq. (2)) as a function of temperature with the maximum value 2.18%/K at 298 K.
Fig. 6. (a) Emission spectrum of (Gd0.98Nd0.02)2O3 nanoparticles in the range of 1035–1155 nm within BW-II recorded at 298 K in DMEM. The shaded regions represent the deconvolution of the emission peaks and the corresponding integrated areas I1 (4F3/2(R2)→4I11/2(Y1)) and I2 (4F3/2(R1)→4I11/2(Y1)) that define the thermometric parameter are indicated. The blue line is the envelope of the best Gaussian multiple peak fit to the spectrum (r2>0.998); (b) Calibration curve. The line is the best linear fit to the data (r2>0.998); (c) Relative thermal sensitivity (Eq. (2)) as a function of temperature with the maximum value of 0.30%/K at 298 K.
19
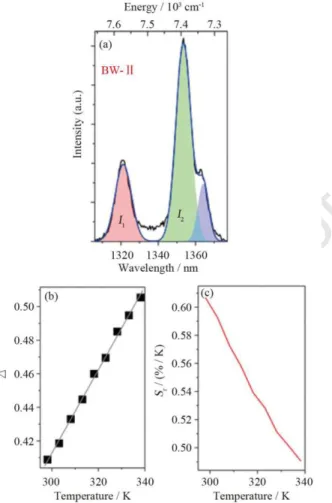
Fig. 7. (a) Emission spectrum of (Gd0.98Nd0.02)2O3 nanoparticles in the range of 1305–1377 nm within BW-II recorded at 298 K in DMEM. The shaded regions represent the deconvolution of the emission peaks and the corresponding integrated areas I1 (4F3/2(R2)→4I13/2(X2)) and I2 (4F3/2(R1)→4I13/2(X2)) that define the thermometric parameter are indicated. The blue line is the envelope of the best Gaussian multiple peak fit to the spectrum (r2>0.988); (b) Calibration curve. The line is the best linear fit to the data (r2 > 0.998); (c) Relative thermal sensitivity (Eq. (2)) as a function of temperature with the maximum value of 0.61%/K at 298 K.
Fig. 8. (a) Cycling of the thermometric parameter for (Gd0.98Nd0.02)2O3 nanoparticles in DMEM under 12 consecutive heating-cooling cycles between 303 and 323 K. The corresponding repeatability is >99% and the dotted lines are guides to the eye; (b) Histogram of temperature computed from 84 emission spectra acquired with integration times of 10010−3 s. The solid line is the best fit to a Gaussian distribution (r2 > 0.998, standard deviation 1.2 K).
21
Fig. 9. Viability of MNT-1 melanoma and HaCaT cells after incubation with (Gd0.98Nd0.02)2O3 nanoparticles for 24 h. Each data point is represented as mean value ± standard deviation from three independent assays.
(%/K)
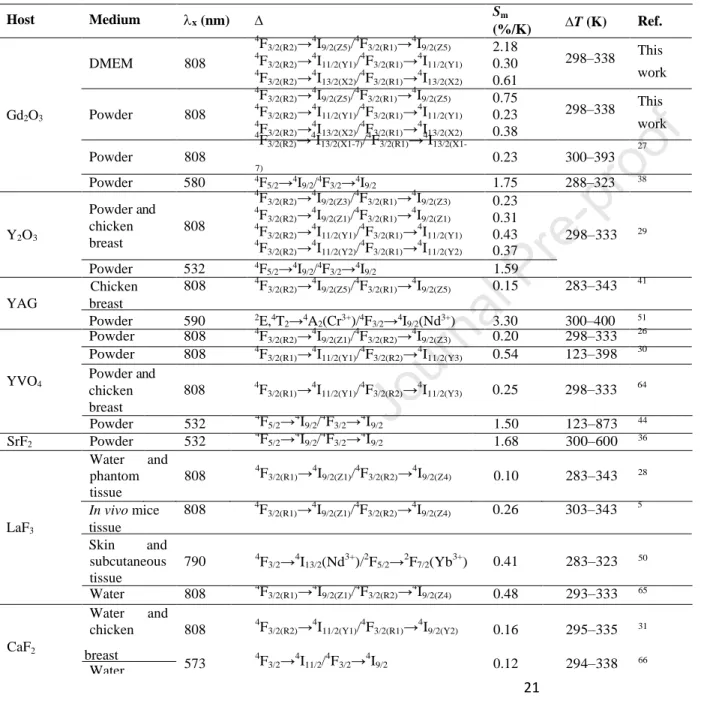
Table 1. Nd3+-based nanothermometers operating partially or fully within BWs and that encompass the physiological temperature range. Excitation wavelength, ;\. x, transitions used for defining the thermometric parameter, ∆, maximum relative thermal sensitivity, Sm, and operating temperature range T.
Host Medium x (nm) Sm T (K) Ref.
Gd2O3 DMEM 808 Powder 808 4 F3/2(R2)→ 4 I9/2(Z5)/ 4 F3/2(R1)→ 4 I9/2(Z5) 4 F3/2(R2)→ 4 I11/2(Y1)/ 4 F3/2(R1)→ 4 I11/2(Y1) 4 F3/2(R2)→ 4 I13/2(X2)/ 4 F3/2(R1)→ 4 I13/2(X2) 4 F3/2(R2)→ 4 I9/2(Z5)/ 4 F3/2(R1)→ 4 I9/2(Z5) 4 F3/2(R2)→ 4 I11/2(Y1)/ 4 F3/2(R1)→ 4 I11/2(Y1) 4 F3/2(R2)→ 4 I13/2(X2)/ 4 F3/2(R1)→ 4 I13/2(X2) 4 F3/2(R2)→ 4 I13/2(X1-7)/ 4 F3/2(R1)→ 4 I13/2(X1- 2.18 0.30 0.61 0.75 0.23 0.38 298–338 This work 298–338 This work 27 Powder 808 7) 0.23 300–393 Powder 580 4F 5/2→4I9/2/4F3/2→4I9/2 1.75 288–323 38 Y2O3 Powder and chicken breast 808 4 F3/2(R2)→ 4 I9/2(Z3)/ 4 F3/2(R1)→ 4 I9/2(Z3) 4 F3/2(R2)→ 4 I9/2(Z1)/ 4 F3/2(R1)→ 4 I9/2(Z1) 4 F3/2(R2)→ 4 I11/2(Y1)/ 4 F3/2(R1)→ 4 I11/2(Y1) 4 F3/2(R2)→ 4 I11/2(Y2)/ 4 F3/2(R1)→ 4 I11/2(Y2) 0.23 0.31 0.43 0.37 298–333 29 Powder 532 4F 5/2→4I9/2/4F3/2→4I9/2 1.59 Chicken 808 4F3/2(R2)→ 4 I9/2(Z5)/ 4 F3/2(R1)→ 4 I9/2(Z5) 0.15 283–343 41 YAG breast Powder 590 2E,4T 2→4A2(Cr3+)/4F3/2→4I9/2(Nd3+) 3.30 300–400 51 Powder 808 4F3/2(R2)→ 4 I9/2(Z1)/ 4 F3/2(R2)→ 4 I9/2(Z3) 0.20 298–333 26 Powder 808 4F3/2(R1)→ 4 I11/2(Y1)/ 4 F3/2(R2)→ 4 I11/2(Y3) 0.54 123–398 30
YVO4 Powder and chicken breast 808 4F3/2(R1)→ 4 I11/2(Y1)/ 4 F3/2(R2)→ 4 I11/2(Y3) 0.25 298–333 64 Powder 532 4F5/2→ 4 I9/2/ 4 F3/2→ 4 I9/2 1.50 123–873 44 SrF2 Powder 532 4 F5/2→ 4 I9/2/ 4 F3/2→ 4 I9/2 1.68 300–600 36 Water phantom and 808 4F3/2(R1)→ 4 I9/2(Z1)/ 4 F3/2(R2)→ 4 I9/2(Z4) 0.10 283–343 28 tissue In vivo mice 808 4F3/2(R1)→ 4 I9/2(Z1)/ 4 F3/2(R2)→ 4 I9/2(Z4) 0.26 303–343 5 LaF3 tissue Skin and subcutaneous tissue 790 4F3/2→ 4 I13/2(Nd 3+ )/2F5/2→ 2 F7/2(Yb 3+ ) 0.41 283–323 50 Water 808 4F3/2(R1)→ 4 I9/2(Z1)/ 4 F3/2(R2)→ 4 I9/2(Z4) 0.48 293–333 65 Water and chicken 808 4F3/2(R2)→ 4 I11/2(Y1)/ 4 F3/2(R1)→ 4 I9/2(Y2) 0.16 295–335 31 CaF2
22 Powder 808 4F3/2(R2)→ 4 I9/2(Z1)/ 4 F3/2(R1)→ 4 I9/2(Z1) NaYF4 Powder 830 4 F3/2(R2)→ 4 I9/2(Z1)/ 4 F3/2(R1)→ 4 I9/2(Z1) 0.12 273–423 25 Multilayer NaGdF4 Water 806 4 F3/2→ 4 I13/2(Nd 3+ )/4I13/2→ 4 I15/2(Er 3+ ) 5 I6→5I8(Ho3+)/4F3/2→4I13/2(Nd3+) 1.10 293–323 47 core-shell system Water 806 2 F5/2→ 2 F7/2(Yb 3+ )/4F3/2→ 4 I11/2(Nd 3+ ) 1.60 293–333 49 Core-shell NaYF4 Powder 808 4 F3/2→ 4 I11/2(Nd 3+ )/2F5/2→ 2 F7/2(Yb 3+ ) 1.50 150–450 67 Al4B2O9 Water 977.7 4F5/2→4I9/2(Nd3+)/2F5/2→2F7/2(Yb3+) 0.70 299–333 48 LiLaP4O12 0.31 KLaP4O12 0.10 83–600 33 NaLaP4O12 0.10 RbLaP4O12 0.11
Graphical abstract
(Gd0.98Nd0.02)2O3 nanothermometers operating in a cell culture medium within the first and second biological windows upon continuous-wave laser diode excitation at 808 nm are biocompatible with human MNT-1 melanoma and HaCaT cells for 24 h of exposure and nanoparticle concentration up to 0.400 mg/mL.
Prof. Dr. Luís António Dias Carlos UNIVERSIDADE DE AVEIRO DEPARTAMENTO DE FÍSICA 3810-193 AVEIRO, PORTUGAL Phone+351 234 370946 [email protected] http://hybrids.web.ua.pt/LDCarlos.html http://hybrids.web.ua.pt/index.html
CONFLICT OF INTEREST STATEMENT
All authors must disclose any financial and personal relationships with other people or organizations that could inappropriately influence (bias) their work or state if there are no interests to declare