Induce Manifest Genomic Damage
In Vitro
Henning Hintzsche1, Christian Jastrow2, Thomas Kleine-Ostmann2, Uwe Ka¨rst3, Thorsten Schrader2, Helga Stopper1*
1Institut fu¨r Pharmakologie und Toxikologie, Universita¨t Wu¨rzburg, Wu¨rzburg, Germany, 2Physikalisch-Technische Bundesanstalt (PTB), Braunschweig, Germany, 3Helmholtz-Zentrum fu¨r Infektionsforschung, Braunschweig, Germany
Abstract
Terahertz electromagnetic fields are non-ionizing electromagnetic fields in the frequency range from 0.1 to 10 THz. Potential applications of these electromagnetic fields include the whole body scanners, which currently apply millimeter waves just below the terahertz range, but future scanners will use higher frequencies in the terahertz range. These and other applications will bring along human exposure to these fields. Up to now, only a limited number of investigations on biological effects of terahertz electromagnetic fields have been performed. Therefore, research is strongly needed to enable reliable risk assessment. Cells were exposed for 2 h, 8 h, and 24 h with different power intensities ranging from 0.04 mW/ cm2to 2 mW/cm2, representing levels below, at, and above current safety limits. Genomic damage on the chromosomal level was measured as micronucleus formation. DNA strand breaks and alkali-labile sites were quantified with the comet assay. No DNA strand breaks or alkali-labile sites were observed as a consequence of exposure to terahertz electromagnetic fields in the comet assay. The fields did not cause chromosomal damage in the form of micronucleus induction.
Citation:Hintzsche H, Jastrow C, Kleine-Ostmann T, Ka¨rst U, Schrader T, et al. (2012) Terahertz Electromagnetic Fields (0.106 THz) Do Not Induce Manifest Genomic DamageIn Vitro. PLoS ONE 7(9): e46397. doi:10.1371/journal.pone.0046397
Editor:David L. McCormick, IIT Research Institute, United States of America
ReceivedApril 16, 2012;AcceptedAugust 31, 2012;PublishedSeptember 27, 2012
Copyright:ß2012 Hintzsche et al. This is an open-access article distributed under the terms of the Creative Commons Attribution License, which permits unrestricted use, distribution, and reproduction in any medium, provided the original author and source are credited.
Funding:This study was funded by the German Federal Office for Radiation Protection (Bundesamt fu¨r Strahlenschutz). The publication was funded by the German Research Foundation (DFG) and the University of Wuerzburg in the funding program Open Access Publishing. The funders had no role in study design, data collection and analysis, decision to publish, or preparation of the manuscript.
Competing Interests:The authors have declared that no competing interests exist.
* E-mail: [email protected]
Introduction
Terahertz electromagnetic fields are non-ionizing electromag-netic fields in the frequency range from 0.1 THz to 10 THz. In contrast to other frequency regions in the electromagnetic spectrum, terahertz electromagnetic fields have not been used extensively for applications in the past due to a lack of suitable generators and detectors. This ‘‘terahertz gap’’ was overcome during the last decade and technical applications are being developed. One application, which is often associated with terahertz electromagnetic fields, is the body scanner which is employed at security checkpoints, e. g. at airports. The currently employed devices are working with millimeter waves, but scanners working at around 0.1 THz are being developed. Other applica-tions, like data transmission or medical imaging, are also being developed for the terahertz frequency region and are thought to be applied within the next decade. All of these applications involve exposure of the general public and require toxicological risk assessment [1,2,3].
Effects of electromagnetic fields in general have been investi-gated widely, however, the majority of the studies investiinvesti-gated radiofrequency electromagnetic fields used for mobile communi-cation. There is consensus that high power electromagnetic fields cause heating which can be responsible for a variety of biological effects. Non-thermal effects at low power intensities were postulated but have not been proven consistently [4]. Investiga-tions showed partly contradictory results on all biological levels, e.
g. production of reactive oxygen species [5,6], enzyme activity [7,8], genotoxicity [9,10] or cancer [11]. A number of review articles have dealt with effects of non-ionizing radiation [12,13,14].
In the terahertz region only a few dozen studies have been published [15], the major contribution coming from the project ‘‘THz Bridge’’, which was initiated and funded by the European Union and concentrated on frequencies around 0.1 THz [16,17,18]. The report concluded that genotoxicity was only observed under specific circumstances, which was later reported as aneuploidy [19]. The recently reported mitotic disturbances [20] which are in general thought to develop into genomic damage in the form of micronucleus formation, might be in line with a potentially genotoxic effect of terahertz electromagnetic fields. However, other studies did not report micronucleus formation [18,21]. It was reported that terahertz electromagnetic fields caused gene expression changes at low intensities, while the mechanism for this effect remains unclear at the moment [22,23]. As expected, it was shown that high power terahertz electromag-netic fields lead to thermal effects in analogy to other frequency regions [24].
Greiner BioOne (Frickenhausen, Germany). ALcells were kindly
provided by Prof. Dr. Ernst Schmid (Munich, Germany). These cells have previously been used in mobile phone exposure studies [25,26]. Phosphate buffered saline (PBS) contained 8 g NaCl, 0.2 g KCl, 0.56 g Na2HPO4, and 0.2 g KH2PO4dissolved in 1 l
of demineralized water. Dabco solution contained 250 mg Dabco dissolved in 10 ml PBS and mixed with 90 ml glycerol.
Cell Culture
HaCaT and HDF cells were cultured in DMEM medium (4.5 g/l glucose) and AL cells were cultured in RPMI-1640
medium under regular cell culture conditions (37uC, humidified atmosphere, 5% CO2). The medium was supplemented with 10%
FCS, 2 mM L-glutamine, and antibiotics. One day before the experiments, cells were seeded onto a circular area of 1.13 cm2in the center of codedm-dishes (ibidi, Martinsried, Germany) with the
help of cell culture inserts (Flexiperm, Greiner BioOne, Frick-enhausen, Germany). For the micronucleus test 40,000 cells and for the comet assay 60,000 cells were seeded. After the cells had attached to the dish bottom, the inserts were carefully removed from the dish. Cells with similar passage number were thawed for each replicate experiment.
Exposure setup
The cells in the codedm-dishes were exposed from below with a
collimated Gaussian beam at 0.106 THz in a modified incubator (NuAire NU-5100) at defined environmental conditions (Fig. 1). The cells were covered by approximately 4 mm of DMEM medium which absorbed the electromagnetic field passing through the cell monolayer completely.
The electromagnetic field originated from a frequency multi-plier chain. A continuous wave signal at 17.67 GHz from a frequency synthesizer (Agilent E8257D) was sextupled in a Schottky multiplier. The wave was fed into a round corrugated horn antenna via a variable attenuator that allowed adjustment of the radiated power between 0 and 155 mW. In front of the antenna, the electromagnetic field was collimated to a beam width (full-width half-maximum) of 2 cm at the location of them-dishes
using a parabolic reflector made from solid metal. The collimated electromagnetic field was coupled in via a thin transparent window at the side of the incubator. A second flat metallic mirror located at the bottom of the incubator was used to direct the electromagnetic field onto them-dishes from below. Them-dish bottom foil as well
as the incubator window made of plastic foil showed radiation transmission of more than 95% at 0.106 THz. Them-dishes were
positioned on a support made of Rohacell 71 HF, a low dielectric constant and low loss material (Evonik Industries, Germany) that left the bottom of the dishes free for exposure. To avoid standing
Meter, Thomas Keating Ltd., UK). Calibration was provided by Ohmic heating of a thin metal film within the detector head. The specified power densities represent averages over the exposure spot area with a diameter of 12 mm and have been calculated taking into account beam profile and radiant power.
Exposure protocol
HaCaT and HDF cells were exposed to 0.106 THz electro-magnetic fields with power densities between 0 mW/cm2 and 0.88 mW/cm2 for 2 h, 8 h and 24 h duration. For the sham exposure (0 mW/cm2), cells were placed in the exposure incubator at exactly the same place where the exposed cells were positioned; all conditions were the same except for the lack of the electromagnetic fields. In a separate set of experiments, cells were also exposed to higher power intensities of 2 mW/cm2. Before exposure, the appropriate power density was adjusted using the photo-acoustic detector at the location in the incubator where the
m-dish was placed. The specified power densities represent
averages over the exposure area covered with cells with a diameter of 12 mm and an area of 1.13 cm2. The power dissipated in the investigated area can be calculated by multiplying the specified power densities by a factor of 1.13 cm2, e. g. a power density of 1 mW/cm2corresponds to a power of 1.13 mW absorbed in the investigated sample area. Exact power density levels were set to (0.0460.01) mW/cm2, (0.3960.09) mW/cm2, (0.8860.19) mW/ cm2, and (1.9660.45) mW/cm2. The given ranges indicate the power densities which the m-dishes were exposed to (95%
confidence intervals) including the uncertainties of the power adjustment and of signal fluctuations as obtained from a detailed uncertainty analysis. This analysis was performed according to the ‘‘ISO/IEC Guide 98-3:2008: Uncertainty of measurement – Part 3: Guide to the expression of uncertainty in measurement (GUM)’’. Using the finite integration method, it has been determined numerically that empty field power densities of 2 mW/cm2 result in maximum specific absorption rates of 13.34 W/kg [28].
Micronucleus test
The micronucleus test was originally developed in the 1970s [29] and was modified for the present investigation as described in this section. To be able to evaluate micronuclei in binucleated cells in HaCaT and AL cells, cytochalasin B (3mg/ml) was added
150 mM magnesium chloride, giving a final concentration of 100 mM of chromomycin A3. The cell layers on the dishes were
incubated with anti-tubulin antibody solution for four hours at 37uC. Thereafter the dishes were rinsed with PBS and cells were incubated with chromomycin A3 for five minutes at room
temperature. Finally, the preparation was mounted with Dabco mounting medium. Micronucleus analysis was performed at 4006
magnification with a Nikon TE-2000-E microscope applying a regular FITC filter. The overall number of mononucleated (MN), binucleated (BN) and multinucleated (MuN) cells was analyzed as well as the frequency of binucleated cells containing micronuclei in 2,000 cells per dish. The following criteria had to be fulfilled by micronuclei:
N
Staining similar to the main nucleiN
Location within the cytoplasmN
No overlap with the main nucleiN
Size approximately 1/16 to 1/3 of the main nucleiFor analysis of cell proliferation, the cytochalasin B proliferation index (CBPI) was calculated according to the formula CBPI = (1NMN+2NBN+3NMuN)/(MN+BN+MuN).
The procedure for the micronucleus test for the AL cells was
similar to the HaCaT cells with the exception of the staining, which was done using Gel-Green solution (1:100 dilution, Biotrend, Cologne, Germany) for 3 minutes.
Because of negative effects on cell morphology, the HDF cells were not treated with cytochalasin B and micronuclei were evaluated in mononucleated cells. Cells were treated with 5-ethynyl-29-deoxyuridine (EdU) 4 hours prior to the end of the post-exposure incubation period, i. e. the fixation point (final concentration 10mM). The fixation procedure was similar to the one of the HaCaT cells. Then, cells were stained with bisbenzimide and cells which had incorporated EdU were visualized using a labeled azide (Click-it EdU kit, Invitrogen, Darmstadt, Germany). Micronucleus analysis followed the same criteria as before with the exception that CBPI proliferation analysis was replaced by the analysis of replication activity
(EdU-incorporation, i. e. distinguishing EdU-positive and EdU-negative cells).
Comet Assay
The comet assay is an electrophoresis-based method to quantify primary DNA damage, it was developed in the 1980s [30,31]. For the present investigation it was modified according to following procedure. After exposure or treatment, cells were detached from the dish and 45ml of the cell suspension were mixed with 160ml of 0.5% low melting point agarose. 45ml of this mixture were added to glass slides which had been covered with a layer of 1.0% high melting point agarose, and two slides were prepared from each exposure. The slides were stored in a cuvette containing lysis solution (2.5 M NaCl, 0.1 M EDTA, 0.01 M Tris and 1% Triton X-100, 10 g/l N-lauroylsarcosine sodium adjusted to pH 10 with NaOH) for at least 60 minutes. Then, the slides were incubated in electrophoresis solution (300 mM NaOH, 1 mM EDTA, pH.13.0) for 20 minutes, followed by an electrophoresis in the same solution (25 V, 300 mA, 20 minutes). Cells were neutralized for 5 minutes in Tris-solution and stained with a 1:3 mixture Gel-Red/Dabco-solution (Biotrend, Cologne, Germany). 50 cells per slide were analyzed using a Nikon Labophot-2 microscope at 2006magnification and applying a regular TRITC filter. For
quantification of the DNA damage, the percentage of DNA in the tail was measured using Komet 6 image analysis software (BFI Optilas, Dietzenbach, Germany).
Statistics
All experiments were performed as three independent replicate exposure experiments. For the micronucleus test, 2,000 cells were evaluated for each replicate, resulting in a total of 6,000 cells. For the analysis of the cells exposed for 24 h, cell number was increased to 10,000 cells for each exposure and sham-exposure replicate (yielding a total of 30,000 cells) and to 6,000 cells per control replicate (yielding a total of 18,000 cells). For the comet assay, 50 cells were analyzed per slide and two slides per exposure condition were prepared, resulting in a total of 300 cells. The results of the exposed cells were compared to their sham-exposed
Figure 1. Scheme of the exposure set-up showing the exposure incubator and the source of the THz electromagnetic fields.
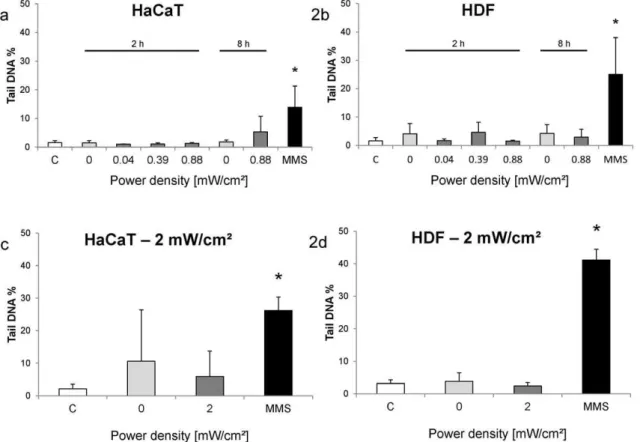
exposure, DNA migration in HaCaT cells was not increased in the exposed samples, whereas after the long exposure, the DNA in the tail region was increased in comparison to the sham-exposed sample (Fig. 2a). However, the difference was not statistically significant mainly due to a high variability in the exposed cells. The variability of the DNA damage values was slightly higher in the HDF cells, but no increase in the exposed cells compared to the sham-exposed cells was observed (Fig. 2b).
Positive controls were included as historical controls in order to demonstrate the test’s ability to correctly detect DNA damage. Cells were treated with 150mM methyl methanesulfonate (MMS) for 4 h. Both cell types exhibited significantly increased DNA damage as a consequence of this treatment (Fig. 2a & 2b). The
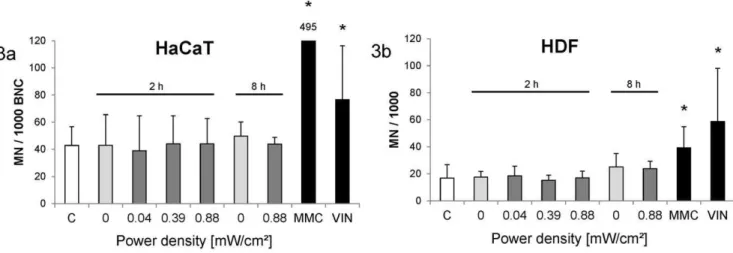
2 h nor in the 8 h exposure experiments (Fig. 3a). Micronucleus frequency in the HDF cells was generally lower, but again the exposed cells showed DNA damage levels similar to the sham-exposed cells (Fig. 3b).
As positive controls, cells were treated with the clastogen mitomycin C (MMC, 1.5mM for 4 h) and the aneugen vinblastine (VIN, 5mM for 4 h). Both led to clear micronucleus formation (Fig. 3a & 3b). The micronucleus frequencies of the sham-exposed cells were similar to the values of the untreated historical controls.
Proliferation
Cell proliferation was quantified as a marker for cytotoxicity and to assess proliferation-related effects on DNA damage because
Figure 2. DNA migration (Tail DNA %) at different exposure conditions.Columns represent means and error bars represent standard deviations of at least three independent experiments (2650 cells per replicate). Untreated controls (C) and positive controls (MMS) are presented as
historical controls performed at different time points during the experiment series (12 independent replicates). Results are shown for HaCaT (2a, 2c) and HDF (2b, 2d) cells. MMS-treated cells showed significantly higher DNA migration compared to untreated cells (*, p,0.05).
micronuclei can only form when cells proliferate. For this assay the same preparations were used as for the micronucleus test, thus the exposure and treatment conditions were identical. In the HaCaT cells, proliferation was quantified as the cytochalasin B prolifer-ation index, which was found to be unaffected by the electromag-netic field exposure (Fig. 4a). MMC and VIN treatment resulted in significantly decreased proliferation rates. In the HDF cells, proliferation was quantified as EdU-incorporation. No change in proliferation was observed for the exposed samples (Fig. 4b). MMC caused a slightly increased EdU incorporation and VIN led to a slightly decreased frequency of EdU-positive cells, but both changes were not statistically significant compared to the negative controls. The sham-exposed cells showed similar values as the untreated historical controls.
Long term exposure
To clarify whether the exposure indeed does not lead to micronucleus induction even though mitotic disturbances had been reported under similar conditions, the micronucleus test and
proliferation rate experiments were extended. In a separate set of experiments, cells were exposed for 24 h at a higher power intensity of 2 mW/cm2. Analysis was performed on a much higher number of cells, namely 30,000 for exposed and sham-exposed cells and 18,000 for controls. These exposures did not lead to increased micronucleus frequencies, whereas MMC treatment caused an increase in DNA damage in HaCaT (Fig. 5a) and HDF (Fig. 5b) cells. These experiments were also performed with AL
cells, because the mitotic disturbances had been investigated in these cells. Again, no increase in genomic damage in the form of micronucleus formation was observed as a consequence of the exposure (Fig. 5c).
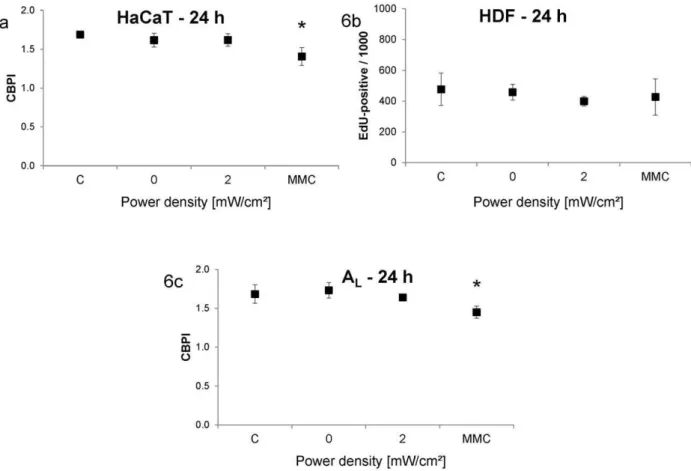
Proliferation was also quantified for these experiments. No significant alterations, which could explain the lack of micronu-cleus induction, were detected (Fig. 6a–c).
Figure 3. Micronucleus frequency after different exposure conditions. Columns represent means and error bars represent standard deviations of at least three independent experiments (261,000 cells per replicate). Untreated controls (C) and positive controls (MMC and VIN) are
presented as historical controls performed at different time points during the experiment series (12 independent replicates). Results are shown as number of micronucleated cells per 1,000 binucleated cells for HaCaT (3a) and as number of micronucleated cells per 1,000 mononucleated cells for HDF (3b) cells. MMC-treated HaCaT cells showed a micronucleus frequency of 4956369 MN/1,000 BNC (Fig. 3a). MMC- and VIN-treated cells showed significantly higher micronucleus frequencies compared to untreated cells (*, p,0.05).
doi:10.1371/journal.pone.0046397.g003
Figure 4. Proliferation rate after different exposure conditions.Columns represent means and error bars represent standard deviations of at least three independent experiments (261,000 cells per replicate). Untreated controls (C) and positive controls (MMC and VIN) are presented as
historical controls performed at different time points during the experiment series (12 independent replicates). Results are shown as cytochalasin B proliferation index for HaCaT cells (4a) and as number of EdU-positive cells per 1,000 cells for HDF cells (4b). MMC- and VIN-treated HaCaT cells showed significantly lower proliferation indices compared to untreated cells (*, p,0.05).
Discussion
Terahertz electromagnetic fields have not been investigated widely in terms of biological effects in the past, despite the increasing relevance due to new applications also involving human exposure to these electromagnetic fields. Only recently, some additional investigations on this topic have been published [15]. The majority of the studies published so far investigated effects at frequencies between 0.100 THz and 0.150 THz. This is not only due to the fact that sources and detectors are easier to handle at these frequencies, but also because future applications will most likely be using this frequency region. The currently employed types of body scanners, which are often associated with terahertz electromagnetic fields, are in fact using millimeter waves (0.03 to 0.10 THz) at the moment, but next generation scanners will likely work at higher frequencies including the terahertz range. Even though intensities are very low, these applications imply an exposure to a significant part of the general population, making it imperative to study putative biological effects.
One major contribution to this research field was the ‘‘THz Bridge’’ project [16], investigating mainly genotoxic effects in blood samples. Genotoxicity studies are of crucial importance because of the close link between genotoxic effects and carcino-genesis. In contrast to the THz Bridge studies, human skin cells were used as biological systems in the present study because terahertz electromagnetic fields cannot penetrate the human body deeply, making the skin the primary target organ of these fields.
Human dermal fibroblasts (HDF cells) as primary cells and HaCaT cells, a keratinocyte cell line, were exposed with 0.106 THz with intensities below, at, and above the current safety limit of 1 mW/cm2.
The first test was the comet assay, which investigates DNA single and double strand breaks. For both cell lines no statistically significant induction of DNA migration after exposure to terahertz electromagnetic fields was observed in the comet assay compared to the respective sham controls. This finding is in line with other publications looking at DNA strand breaks in lymphocytes after exposure with 0.120 THz and 0.130 THz [21,32].
The micronucleus frequency was also not affected by the terahertz exposure in both cell types. It was observed that the micronucleus frequencies differed clearly between the different cell types. This underlines the importance of investigating effects both on primary cells as well as on cell lines. These findings also confirm the results of other publications which found no increase in micronucleus formation caused by terahertz electromagnetic fields [18,21,32]. In contrast to this, aneuploidy, i. e. numerical chromosome aberrations not detectable as micronuclei, and mitotic disturbances were reported to be caused by terahertz electromagnetic fields at similar or lower power intensities [19,20]. Both findings do not fit very well to the lack of micronucleus formation. As mitotic disturbances in particular are thought to develop to micronuclei, at least some of the disturbed mitoses would have been expected to form a micronucleus. Also, experimental exposure conditions like frequency and power
Figure 5. Micronucleus frequency after different exposure conditions. Columns represent means and error bars represent standard deviations of at least three independent experiments (at least 562,000 cells per replicate for exposed and sham-exposed samples; at least 362,000
cells per replicate for control samples). Results are shown as number of micronucleated cells per 1,000 binucleated cells for HaCaT (5a) and AL(5c) cells and as number of micronucleated cells per 1,000 mononucleated cells for HDF (5b) cells. MMC-treated cells showed significantly higher micronucleus frequencies compared to untreated cells (*, p,0.05).
intensity were similar for the finding of the mitotic disturbances in comparison to the present study. One hypothesis was that the electromagnetic field acts only on mitotic cells. Since for the analysis of mitotic disturbances cells are fixed directly after exposure, one can expect that all cells, which are analyzed, had been in mitosis during the exposure. With the standard micronucleus test protocol, cells are cultivated for a post-exposure incubation time with cytochalasin B to make micronucleus formation possible. This means that cells could have been in any cell cycle phase during exposure and only a small percentage of the analyzed cells had been in mitosis during exposure. To avoid this problem, cells were next exposed for 24 hours and fixed directly afterwards. Thus, all analyzed cells went through at least one complete cell cycle during exposure and hence must have been in mitosis. Cells were exposed with an intensity of 2 mW/cm2and statistical power was raised by analyzing an increased number of cells, at least 10,000 for each repeat experiment for exposed and sham-exposed cells (yielding a total of at least 30,000 cells) and at least 6,000 for controls (yielding a total of at least 18,000 cells). Both for HaCaT and for HDF cells, no increase in micronucleus formation was observed. In a final step to adjust the protocol to the experimental conditions with which the mitotic disturbances were observed, the latter experiment was repeated with AL cells, a
human-hamster hybrid cell line, in which mitotic disturbances had been reported [20]. All other experimental parameters were kept constant. Again no change in micronucleus frequency was
observed. This result confirms the first part of this study as well as other investigations [18,21,32], namely that terahertz electro-magnetic fields do not cause direct DNA damage. It remains open whether the reported mitotic disturbances [20] or the aneuploidy induction [19] will be confirmed by independent investigations. In particular, the fate of the affected cells will have to be considered, since such rare events may be repaired by either correcting the problem before completion of mitosis or by eliminating the cell from the culture.
In conclusion, human skin cells were exposed to 0.106 THz electromagnetic fields and investigated for genotoxic effects. No induction of DNA strand breaks or chromosomal damage was observed. Very small alterations might not have been detectable because the cells showed considerable background level of DNA damage. Since mitotic disturbances had been reported to be caused by terahertz electromagnetic fields, the protocol for the micronucleus test was adapted. Again, no damage was observed. Contrary to the expected outcome, these mitotic disturbances do not seem to develop to manifest DNA damage.
Acknowledgments
This work is dedicated to Ju¨rgen Wehland, who passed away prematurely. Excellent technical assistance by Maria Scheurich, Ingrid Richter, Thorsten Riese, Hildegard Schwab-Hanisch and Brigitte Denker is appreciated. Prof. Dr. Achim Enders and Prof. Dr. Ernst Schmid were scientific advisors to this project.
Figure 6. Proliferation rate after different exposure conditions.Columns represent means and error bars represent standard deviations of at least three independent experiments (at least 561,000 cells per replicate for exposed and sham-exposed samples; at least 361,000 cells per replicate
for control samples). Results are shown as cytochalasin B proliferation index for HaCaT (6a) and AL(6c) cells and as number of EdU-positive cells per 1,000 cells for HDF (6b) cells. MMC-treated HaCaT and ALcells showed significantly lower proliferation indices compared to untreated cells (*, p,0.05).
6. Hoyto A, Luukkonen J, Juutilainen J, Naarala J (2008) Proliferation, oxidative stress and cell death in cells exposed to 872 MHz radiofrequency radiation and oxidants. Radiat Res 170: 235–243.
7. Ammari M, Lecomte A, Sakly M, Abdelmelek H, de-Seze R (2008) Exposure to GSM 900 MHz electromagnetic fields affects cerebral cytochrome c oxidase activity. Toxicology 250: 70–74.
8. Huang TQ, Lee MS, Oh EH, Kalinec F, Zhang BT, et al. (2008) Characterization of biological effect of 1763 MHz radiofrequency exposure on auditory hair cells. Int J Radiat Biol 84: 909–915.
9. Yadav AS, Sharma MK (2008) Increased frequency of micronucleated exfoliated cells among humans exposed in vivo to mobile telephone radiations. Mutat Res 650: 175–180.
10. Hintzsche H, Stopper H (2010) Micronucleus frequency in buccal mucosa cells of mobile phone users. Toxicol Lett 193: 124–130.
11. Khurana VG, Moulder JE, Orton CG (2008) Point/counterpoint. There is currently enough evidence and technology available to warrant taking immediate steps to reduce exposure of consumers to cell-phone-related electromagnetic radiation. Med Phys 35: 5203–5206.
12. Verschaeve L, Juutilainen J, Lagroye I, Miyakoshi J, Saunders R, et al. (2010) In vitro and in vivo genotoxicity of radiofrequency fields. Mutation Research/ Reviews in Mutation Research 705: 252–268.
13. Feychting M (2011) Mobile phones, radiofrequency fields, and health effects in children - Epidemiological studies. Prog Biophys Mol Biol.
14. Ramundo-Orlando A (2010) Effects of Millimeter Waves Radiation on Cell Membrane - A Brief Review. Journal of Infrared, Millimeter and Terahertz Waves 31: 1400-1411-1411.
15. Hintzsche H, Stopper H (2011) Effects of terahertz radiation on biological systems. Critical Reviews in Environmental Science and Technology. 16. Gallerano GP (2004) Tera-Hertz radiation in Biological Research, Investigations
on Diagnostics and study on potential Genotoxic Effects. EU. 72 p. 17. Ramundo-Orlando A, Gallerano GP, Stano P, Doria A, Giovenale E, et al.
(2007) Permeability changes induced by 130 GHz pulsed radiation on cationic liposomes loaded with carbonic anhydrase. Bioelectromagnetics 28: 587–598.
Mammalian stem cells reprogramming in response to terahertz radiation. PLoS One 5: e15806.
23. Alexandrov BS, Rasmussen KO, Bishop AR, Usheva A, Alexandrov LB, et al. (2011) Non-thermal effects of terahertz radiation on gene expression in mouse stem cells. Biomed Opt Express 2: 2679–2689.
24. Wilmink GJ, Rivest BD, Roth CC, Ibey BL, Payne JA, et al. (2010) In vitro investigation of the biological effects associated with human dermal fibroblasts exposed to 2.52 THz radiation. Lasers Surg Med.
25. Schrader T, Kleine-Ostmann T, Munter K, Jastrow C, Schmid E (2011) Spindle disturbances in human-hamster hybrid (A(L) ) cells induced by the electrical component of the mobile communication frequency range signal. Bioelectro-magnetics 32: 291–301.
26. Schrader T, Munter K, Kleine-Ostmann T, Schmid E (2008) Spindle disturbances in human-hamster hybrid (AL) cells induced by mobile commu-nication frequency range signals. Bioelectromagnetics 29: 626–639.
27. Dickhoff R, Jastrow C, Steiger A, Muller R, Kleine-Ostmann T, et al. Characterization of THz beams; 2011 1–6 May 2011. pp. 1–2.
28. Jastrow C, Kleine-Ostmann T, Schrader T (2010) Numerical dosimetric calculations for in vitro field expositions in the THz frequency range. Adv Radio Sci 8: 1–5.
29. Boller K, Schmid W (1970) [Chemical mutagenesis in mammals. The Chinese hamster bone marrow as an in vivo test system. Hematological findings after treatment with trenimon]. Humangenetik 11: 35–54.
30. Ostling O, Johanson KJ (1984) Microelectrophoretic study of radiation-induced DNA damages in individual mammalian cells. Biochem Biophys Res Commun 123: 291–298.
31. Singh NP, McCoy MT, Tice RR, Schneider EL (1988) A simple technique for quantitation of low levels of DNA damage in individual cells. Exp Cell Res 175: 184–191.