Ricardo Boto Semblano da Silva
BSC in Computer ScienceVirtual Reality Integration
on Tomo-GPU System
Dissertation submitted in partial fulfillment of the requirements for the degree of
Master of Science in
Computer Science and Informatics Engineering
Adviser: Doutor Pedro Abílio Duarte de Medeiros,
Associate professor, NOVA University of Lisbon
Examination Committee
Chairperson: Doutor Pedro Manuel Corrêa Calvente Barahona
Raporteurs: Doutor Adriano Martins Lopes
Virtual Reality Integration on Tomo-GPU System
Copyright© Ricardo Boto Semblano da Silva, Faculty of Sciences and Technology, NOVA University Lisbon.
The Faculty of Sciences and Technology and the NOVA University Lisbon have the right, perpetual and without geographical boundaries, to file and publish this dissertation through printed copies reproduced on paper or on digital form, or by any other means known or that may be invented, and to disseminate through scientific repositories and admit its copying and distribution for non-commercial, educational or research purposes, as long as credit is given to the author and editor.
For self learning academically and personally Dedicated to nobody.
A c k n o w l e d g e m e n t s
First and foremost, I must show my gratitude to my adviser, Pedro Medeiros, where without him this work would be impossible, and he was able to salvage me through a difficult situation.
To my institution, Faculdade de Ciências e Tecnologia, that provided all the conditions necessary to perform this work.
To professor Maria Cecília Gomes, by having no responsibility whatever but always available to help and provided one of the best discussions on a coffee break.
To every single colleague where some were already friends, and the others became friends, beeing too many to mention. However, Miguel Cordeiro, João Simões, João Oliveira and Alexandre Ferreira are some of the people that made every workday much more enjoyable.
And finally to my parents that even in spite of many things, they provided everything required to finish this work.
A b s t r a c t
With the ever-greater creation of data, new ways to extract information from it in faster ways is a subject of great interest to the scientific community in general and any entity that may benefit with the interpretation of data. Virtual reality, although not a recent discovery only now is becoming broadly available and driving new state of the art designs and implementations. Nonetheless, already existing results, provide positive feedback of virtual reality on some cases of data visualization.
One of the scientific areas that may benefit from virtual reality technology visualization is the scientific field of material sciences. A current project of FCT is the Tomo-GPU system that was developed to aid the material scientists in processing and visualizing their data. This work focuses on the integration of a virtual reality visualization on the Tomo-GPU system to aid material scientist in interpreting their data more efficiently.
R e s u m o
Com a geração de dados aumentando constantemente, novas maneiras de extrair informação de forma rápida e eficaz é do interesse tanto para a comunidade científica como para qualquer entidade que beneficie de interpretação de dados. As interfaces de realidade virtual, apesar de não ser uma descoberta recente, só agora é que estas estão a ficar facilmente disponíveis ao público e assim fomentando novos estudos sobre a mesma. No entanto, estudos já efetuados, comprovam a utilidade da nova interface em alguns casos de visualização de dados.
Uma das áreas científicas que poderão beneficiar com realidade virtual é a área de ciências dos materiais. Atualmente, existe um sistema, chamado Tomo-GPU, com o objetivo de processar e visualizar os dados destes especialistas. Este trabalho foca-se no desenvolvimento e integração de visualização de dados com realidade virtual no sistema Tomo-GPU para que seja possível interpretar os seus dados de maneira mais eficiente.
Palavras-chave: Realidade Virtual, visualização interativa de dados, visualização 3D, Tomo-GPU
C o n t e n t s
List of Figures xv
1 Introduction 1
1.1 Context and Motivation . . . 1
1.2 Objective . . . 2
1.3 Problem . . . 2
1.4 Approach and document structure . . . 3
2 Related Work 5 2.1 Information Visualization Systems . . . 5
2.1.1 Interactive Data Visualization Framework . . . 6
2.1.2 Interactive Data Visualization System Validation Framework . . . 7
2.1.3 Visual Encoding Taxonomy . . . 9
2.2 Virtual Reality . . . 11
2.2.1 Immersive VR Foundations . . . 11
2.2.2 3D Interfaces Considerations . . . 14
2.3 Vis Systems with VR . . . 15
2.4 Problem Solving Environments(PSE) . . . 15
2.5 SCIRun . . . 16
2.5.1 Modular Architecture . . . 17
2.5.2 Data Types, Ports and Connections. . . 17
2.5.3 Dataflow network . . . 17
2.5.4 Module Development . . . 17
2.5.5 Limitations . . . 18
2.6 TOMO-GPU System . . . 18
2.7 Unreal Engine 4 Framework . . . 19
2.7.1 Architecture Basics . . . 20
2.7.2 Development . . . 22
2.7.3 Blueprints . . . 22
2.7.4 Attachment System and World Composition . . . 23
2.7.5 Execution Flow . . . 24
C O N T E N T S
2.8 Prototype Framework Characterization . . . 25
2.8.1 Geometric Data Abstraction(What). . . 25
2.8.2 Material Engineer Tasks(Why) . . . 27
2.8.3 Visualization Algorithms of Geometric Data(How) . . . 27
2.9 Summary . . . 30 3 Organization Solution 33 3.1 Tomo-GPU VR Module . . . 34 3.2 SCIRunVR Prototype . . . 34 4 Implementation 37 4.1 Tomo-GPU VR module . . . 37 4.1.1 Module Implementation . . . 37 4.2 SCIRunVR UE4 . . . 38 4.2.1 System Architecture . . . 39 4.2.2 DataStructs . . . 42 4.2.3 Readers . . . 42 4.2.4 StaticLibs . . . 43 4.2.5 Tasks . . . 44 4.2.6 Model . . . 47
4.2.7 Blueprint Control Management . . . 50
4.2.8 World Hierarchy Tree . . . 51
5 Evaluation 55 5.1 Test Environment . . . 55 5.2 Tasks Execution . . . 56 5.2.1 Load . . . 56 5.2.2 Calculate Edges . . . 57 5.2.3 Surface Extraction . . . 57 5.3 Draw Execution . . . 58 5.4 Liveness Test. . . 59 6 Conclusion 61 6.1 Future Work . . . 61 Bibliography 63 xiv
L i s t o f F i g u r e s
2.1 Elements of interaction in visualization. Adapted from [15] . . . 6
2.2 Elements of interaction in visualization. Adapted from [11] . . . 7
2.3 Construction and validation framework. Adapted from [11] . . . 8
2.4 Possible marks. Retrived from [11] . . . 9
2.5 Visual channels for data encoding. Adapted from [11] . . . 9
2.6 Ames room optical illusion. . . 10
2.7 Examples of 3D disadvantages. . . 10
2.8 The interface of the SCIRun system framework. On the left module list, on the right data flow network on center top a visualization widget and on center down is one module interface.. . . 16
2.9 Standard execution of Tomo-GPU. Retrieved from [25] . . . 20
2.10 Unreal Engine 4 editor interface. . . 22
2.11 UE4 blueprint system. Retrieved from [1] . . . 23
2.12 World with four levels. Adapted from [13] . . . 23
2.13 Geometry topology abstraction. Retrieved from [18] . . . 26
2.14 Geometry dataset structures. Retrieved from [18]. . . 26
2.15 Simple cubes algorithm. . . 28
2.16 Contouring algorithm cases. Retrieved from [18] . . . 29
2.17 Marching cubes algorithm base cases. Retrieved from [18] . . . 30
2.18 Results of Marching cubes algorithm to the left and dual marching cubes to the right. Retrieved from [17] . . . 30
3.1 Component diagram for with overall functionality to integrate VR on Tomo-GPU system. . . 33
4.1 VR module with its interface inside SCIRun framework.. . . 38
4.2 SCIRunVR c++ class diagram.. . . 40
4.3 SCIRunVR Blueprints class diagram for control functionalities.. . . 41
4.4 Voxel direction standard use in simple cube algorithm implementation.. . . . 46
4.5 Flux diagram of AModelManager. . . 49
4.6 Resulting UI to currently manipulate SCIRunVR prototype. . . 50
4.7 Room plant. . . 51
L i s t o f F i g u r e s
4.9 Prototype running NRRD file with dual marching cubes surface algorithm. . 53
4.10 Prototype running NRRD file with simple cubes surface algorithm. . . 53
4.11 Prototype running Bruno file type with dual marching cubes surface algorithm. 53
5.1 Execution times of loading tasks with different data size of both supported files. 57
5.2 Execution time of edge calculation with different data size of both supported files. . . 57
5.3 Surface extraction time execution.. . . 58
5.4 Execution times of mesh drawing by the number o displayed vertexes for both supported mesh techniques. . . 59
5.5 FPS average displaying with both types of mesh depending on vertex count. 59
C
h
a
p
t
e
r
1
I n t r o d u c t i o n
1.1
Context and Motivation
The Tomo-GPU project was funded by FCT/MCTES (PTDC/EIA-EIA/102579/2008 - Am-biente de Resolução de Problemas para Caracterização Estrutural de Materiais por To-mografia) to assist Material Science Engineers specialists in the development of new composite materials, and it’s fabrication methods[14].
A composite material is formed from at least two different materials. One used as a base/continuous material, while the others are, often, discrete/clustered and used as reinforcements. The properties manifested by the composite depends not only on the base materials applied but also, on the relative amounts, formations, distribution, orientation and many other chemical and physical conditions[2]. The new characteristics obtained can prove useful in some functionality and then applied in the most varied of industry fields from the creation of surgical tools to the construction of buildings.
Thus to aid material engineers, a system with the following characteristics was built[2]:
• Sophisticated 3D data visualization.
• Allow computational steering by material experts that usually is not a computer expert.
• Easy integration of new features, where those can be already existing programs or special purpose functionalities.
These requirements are currently achieved by using a problem solving environment tool(PSE) called SCIRun. SCIRun is a graphical tool that consists of a menu that lists all the available modules that can have input and/or output ports. Besides, it allows the user to assemble those modules by connecting its ports. This ease of use allows for the
C H A P T E R 1 . I N T R O D U C T I O N
non-computer expert to apply powerful functionalities on its data either for processing or for visualization. The Tomo-GPU system consists of several modules based on SCIRun framework, that satisfies material engineers tasks.
Although VR isn’t a brand new technology, only recently became broadly available and consequently stimulating research and development with such technology. However, some research has already been done, and current literature[4] exposes a vast potential in VR with data that possess an intrinsic three-dimensional aspect. A part of this potential is because of natural interaction that VR provides, however such interaction comes great computations costs.
1.2
Objective
This work has the objective of developing a virtual reality visualization and allow integra-tion on the Tomo-GPU system currently used by material engineers to handle their data. Such integration will harness the modular capabilities of SCIRun, however as discussed in the previous point, VR as a new interface technology it as some peculiar and demanding characteristics. Such characteristics need not only a real-time render engine tool but also a VR controller support, to manage the development in a feasible amount of time.
Two independent goals may be extracted from the previous broader objective. Those are as followed:
• The construction of a prototype system that allows the visualization of the three-dimensional data processed and stored by the Tomo-GPU system in a VR environ-ment.
• Full integration with Tomo-GPU system, allowing its use by the non-computer expert.
1.3
Problem
The main concern of this work is how to integrate the new interface technology, that is accessible for development, to visualize the data handled by the Tomo-GPU system and make it available on its workflow. To address such a wide problem, one must break it apart in several underlying subjects. Those are:
Characterization Visualization Systems: The integration pretended in this work is pri-marily a visualization system. For that reason, a concise framework allowing to correctly address such type of systems and also how to properly validate them.
SCIRun architecture: The understanding of Tomo-GPU system, built over SCIRun
frame-work, is fundamental to add a new module to the project. However, a current limitation of the system used is that it does not provide easy integration with any
1 . 4 . A P P R O A C H A N D D O C U M E N T S T R U C T U R E
virtual reality equipment. This limitation forced the development of a prototype system apart from the SCIRun framework. Nonetheless bridging between systems is fundamental.
Characterization of data: How data is stored, and its meaning is fundamental to allow understanding of how to handle it for visualization.
Characterization of surfaces: Different ways to define surfaces exist and literature is
extensive on this subject. For this reason only a small portion, that is directly useful for the development will be considered in this work.
VR usefulness in data visualization: Data visualization is another subject with extensive literature and considered a scientific area on itself. However, basic knowledge of it and also about the foundations behind VR technology is required. Such knowledge will help grasp VR potential in the data visualization.
1.4
Approach and document structure
In this document will start by addressing, in related work chapter, the relevant subjects derived from the central issue of this work established in the previous point. These subjects start with a more theoretical approach to establish the required knowledge and vocabulary to discuss a possible solution. And they end with the explanation of the used technologies and a description of the intended system to implement.
The work will progress to an explanation of the solution organization achieved with all gathered knowledge. After, it will be explained the implemented solution and is followed by the results.
C
h
a
p
t
e
r
2
R e l at e d W o r k
This chapter has the purpose of gaining background knowledge necessary for the prototype system implementation 1.2. It will start with a more theoretical approach that will decompose and characterize the two main concepts. The first is information visualization systems (InfoVis systems) and the second is virtual reality. Such characterizations will provide information over the consequences of integrating VR in InfoVis systems and allow to formulate a conclusion, along with some other research conclusions on the subject, in the following section.
After the theoretical foundations, it will be addressed the technologies used by this work, starting with SCIRun framework technology and evolve to the Tomo-GPU system to conceptualize the development for VR integration. Next, it will be considered the unreal engine 4 framework that will be required to develop the prototype in a conceivable period of time.
The last section will gather information about this chapter and apply a framework to characterize the prototype succinctly.
2.1
Information Visualization Systems
Information Visualization systems or InfoVis systems resort to visualization, by transform-ing the symbolic into the geometric, and allowtransform-ing for the user to observe their data. Data on itself holds little value. It is just when analyzed and used in decision making that its value manifests.
The use of the visual channel is due to be well characterized and most suited among the other sensory channels. As visual beings, the majority of information used is obtained through sight, and InfoVis systems explore this information retrieval "machinery"to es-tablish communication between system and user [11]. Visualization systems possess one
C H A P T E R 2 . R E L AT E D W O R K
other fundamental component, although, with less focus on research [27], it is almost mandatory in current InfoVis systems. This component is interaction, and it allows the user to handle complexity better. By establishing communication between user and system, the user can change the visualization on demand allowing for different perspectives from data quickly and efficiently. The dialogue established is always mediated by a computer system with its user interface. This concept is depicted in image2.1, and this concept is at the core of current days InfoVis system. However, possible combinations of evolving factors in this type of systems allows for an infinity of possibilities. The computer field of interactive data visualization studies these possibilities and literature is vast on the subject.
Human(s) Computing device Visualization
User-centered Technology-centered Interface-centered
Figure 2.1: Elements of interaction in visualization. Adapted from [15]
2.1.1 Interactive Data Visualization Framework
In this subsection, one possible framework, retrieved from [11], is analyzed. This frame-work acknowledges three primary components; those are:
Data(What): The data component focuses on the recognition of patterns in data. Each piece of data as two main characteristics. First its semantic value (ex. is a name or city?) that must always be taken into consideration by the programmer. The second is the type of data that focus on the mathematical interpretation(ex. is an attribute or link?). Differently structured aggregations of different types of data generate a data set where several well-known patterns exist like tables, graphs, fields and many more. The recognition of these patterns in data is of paramount importance in the design and implementation of a data visualization system.
Task(Why): The task component focuses on the recognition of different objectives from the user. As a component that is extremely influenced by the domain area that visualization is applied, it is essential to distantiate from domain-specific objective into the most generic term. This generic term is more concise of what the user intends from the visualization. This framework recognizes two different aspects of a task the action and the target. Actions can be to discover, present, summarize and
2 . 1 . I N F O R M AT I O N V I S U A L I Z AT I O N S Y S T E M S
many more. Where targets can be trends, outliers, attribute, topology, shape and others.
Visual/Interaction idiom(How): This component focuses on structuring the vast
possi-bilities in visualization and interaction. It devises into four different groups. The first, visual encoding that consists of characterizing the elements of one image and the mapping of the data to such elements. As a fundamental concept in this thesis, it will be further addressed in2.1.3. The second is manipulation that classifies how the visual elements can be interacted either by change, selection or navigation. The third is facet, that consists in the assembly of more than one image, useful for comparisons. The last is reduce that describes how data can be filtered, aggregated or embedded for drill-down operations.
Figure 2.2: Elements of interaction in visualization. Adapted from [11]
As depicted in2.2, these components are interdependent and are full of trade-offs.
Knowledge gathered over some component should be taken into consideration and start a refinement loop and evaluate the consequences over the other components.
2.1.2 Interactive Data Visualization System Validation Framework
The framework, addressed in the previous point, allow us how to describe and categorize some data visualization technique. However, it does not specify a visualization system on its whole. The new framework consists of four nested levels as is meant to describe the entire InfoVis system and provide a consistent framework for validation of such systems [10]. Nonetheless, the previously discussed components make part of this framework and constitute two of the four layers. The overall structure is depicted on2.3and possesses a nested hierarchy where information in one layer should be passed into the other layers yet not strictly in a linear way. The layers are as followed:
Domain problem characterization: Evaluates the problems and data of the specific do-main, where the challenge lies in connecting the concepts between users and design-ers.
Data and task abstraction: This layer unifies the data and task abstraction, specified in the previous item, into one single validation step because both consist in the abstraction of the domain-specific vocabulary into a more generic description. However, one focuses on data, while the other focuses on domain problems.
C H A P T E R 2 . R E L AT E D W O R K
Visual/Interaction technique: The third layer focuses on the design of the visual and
interaction idioms and attempts to maximize user perception of data and minimize problem-solving times, where the definition of both occurs in the previous layer.
Algorithmic: This last layer focuses on the construction of the algorithms that implement the previous layer designs automatically.
Figure 2.3: Construction and validation framework. Adapted from [11]
With each layer possessing different threats, they also require different forms of validation. Some threats and validation meth-ods are listed on image 2.3, and each work should only approach one or a subset of lay-ers.
One other distinction must be clarified; this is between upstream and downstream parts that correspond to the top half and the bottom half of validation methods respec-tively. The upstream validation methods can only provide us with partial validation over its layer and should be used for design re-finement before implementation. The down-stream counterpart provides the validation required for some system but it needs to be fully implemented, as the nested structure suggests.
2.1.2.1 System Construction Approaches
The four-level design framework possesses two commonly used approaches to start the construction and aid validation of a visualization system. Those approaches are problem-driven and technique-driven. The problem-driven method consists of a top-down iteration of the framework where the visualization designer starts with a real-world domain problem and analyses the domain users with a field study. Generally, with this approach, the challenge lies in a good abstraction from the domain situation where it is usually possible to match to an existing visual encoding idiom.
With a technique-driven approach, that is an opposite approach to problem-driven, where the iteration made over the framework starts at one of the two bottom levels. If the starting point is on the third level, it means that the designer possesses some new visual encoding or interaction idea. If the starting point is on the bottom layer, it means there exists some new idea in increasing the algorithmic performance of some idiom.
2 . 1 . I N F O R M AT I O N V I S U A L I Z AT I O N S Y S T E M S
2.1.3 Visual Encoding Taxonomy
To fully understand VR potential one must first understand the primitives used by human visual channel. For this, it is addressed one possible taxonomy, from [11], and formalize visual encoding that makes part of the "How"component on Vis systems framework.
The taxonomy makes a first high-level break down into marks and visual channels.
Marks: There are four possible classes of marks classified according to the number of spatial dimensions that are required to draw them. Those are points (0D), lines (1D), areas (2D) and volumes (3D). There are two different applications of these marks. One is to represent the elements in data the other is to represent connections in data. However, the latest requires marks at least 1D or higher. This notion is best summarized with image2.4.
Figure 2.4: Possible marks. Retrived from [11]
Visual channels: Several visual channels control the appearance of marks, represented in2.5, where for each visual channel is possible to encode/map some attribute about
that mark. However, as the image suggests, it possesses two primary groups of visual channels, the spatial and non-spatial channels where the first is of special interest in this work.
Spacial Channels Non-Spacial Channels
Position
Horizontal Vertical Depth
1D 2D 3D
Color
Hue Saturation Luminance
Shape
Motion
Orientation
Size
Length Area Volume
Curvature
Figure 2.5: Visual channels for data encoding. Adapted from [11]
2.1.3.1 Spatial Channels
The spatial channels are primitives of particular interest for visual encoding possessing a category of its own. Such importance is given because only with proper positioning
C H A P T E R 2 . R E L AT E D W O R K
of marks is possible to start creating informative images of data. This notion is easily understood by conceptualizing two possibilities. First, several overlapped marks and second several marks spread out on screen. The information provided by the overlapped marks is significantly less than the spread marks, where even readability of other non-spatial channels reduces drastically.
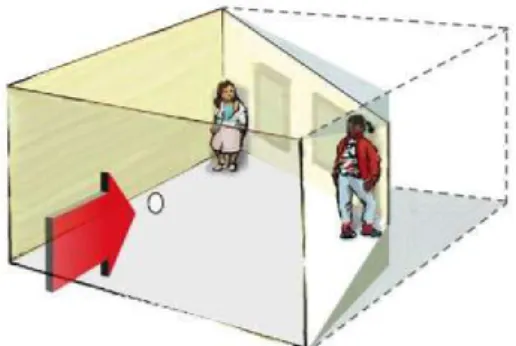
a ) Front view. Retrived from [26]. b ) Perspective view. Retrived from [24]. Figure 2.6: Ames room optical illusion.
To continue explanation of spatial channels, one last concept of human capabilities is required. The concept is that humans formulate a mental construction of third dimension (depth) in their brains. The construction is necessary because the image created in our cornea is just a two-dimensional image that is a point of view projection of our three-dimensional world. The brain uses several depth cues, to aid 3D construction, like stereoscopic vision, the disposition of shadows, occlusion and parallax movement. Such a process may sometimes lead to miss interpretations of reality. For example, the optic illusion of the room experience, pictured in figure2.6a, gives the wrong perception of the room and the people inside where its true form is more perceptible in figure2.6b.
a ) Data occlusion. Retrieved from [11] b ) Perspective distortion. Retrieved from [5] Figure 2.7: Examples of 3D disadvantages.
2 . 2 . V I RT U A L R E A L I T Y
For Vis systems, the use of 3D can lead to wrong interpretations of data by the user, which is a non-desirable effect. Some examples of 3D characteristics that may affect data visualization negatively are occlusion and perspective distortion. The first is exemplified in figure2.7acan be a major concern by hiding crucial information to the viewer. The second causes distant objects to seem smaller, illustrated in figure2.7b, where comparison of some bars sizes can lead to doubts.
All the problems associated with 3D makes 2D more efficient on the majority of data visualizations. The "power of the plane"is well acknowledged by data visualization literature, with no distortions then providing a clear interpretation of data. 1D possesses the same good characteristics of 2D, although with one less possible channel, but it should not be overlooked if data is simple enough.
Nonetheless, all these disadvantages of 3D visualization are out weighted when the task is to understand the geometry of an object or scene, having even a greater performance if using interaction, as it is possible to examine in the study [23].
2.2
Virtual Reality
Broadly considered the next generation of man-machine interfaces, virtual and augmented reality, brings endless new possibilities for human in the loop systems.
Virtual reality will also be referred by its initials VR several times and also with the meaning of immersive VR and not non-immersive VR. Non-immersive VR is merely the display of 3D pictures in a standard monitor, while immersive VR concept was coined in the ’90s by Jaron Lanier and is explained in the next point.
2.2.1 Immersive VR Foundations
Jaron Lanier made the holodeck analogy as it was a mainstream concept to the public due to the Star Trek series. This analogy tries to explain the immersive effect in is ultimate form where, in the holodeck, was possible to create entirely new worlds and interact with it and its inhabitants as similar as in real life. Decomposition of this analogy is explained in [16], which defines the perfect immersive experience and derives from it, eight different
themes that are at the core of this effect. However, only those that capture the prerequisites of the immersive effect will be addressed, and not those that reflect the possibilities that came alongside being immersed.
These four primary requisites are sensor diversity, spatiality of display, transparency of medium and natural language. Although in nowadays VR interface models don’t fully implement these prerequisites, they already provide a significant immersive feeling with partial implementation. They capture the essence of how we perceive and interact with the world and became the technical challenges to create VR.
C H A P T E R 2 . R E L AT E D W O R K
2.2.1.1 Sensor Diversity
All the sensory systems the human possesses, contribute in some way to the overall internal construction of our reality/environment. The understanding of how humans perceive through the senses is fundamental to fool them into creating the pretended world.
With the vision as the main human sensor, the ability to fully recreate this sense is fundamental, where a majority of prerequisites for VR involve tampering with vision directly or indirectly.
Sound is also used, in nowadays VR systems, to contribute to the immersive effect. With algorithms that spatialize sound, giving a sense of directionality, it is possible to recreate the way humans perceive sound in the real world.
The exclusive use of vision and sound on VR systems is due to their recording and reproduction technologies are well developed and cheap.
The gustatory and olfactory senses haven’t been scrutinized by the developers of this area, mainly due to the affirmation that those senses would not add much more detail to the environment construction. Although there are several systems where the sense of smell can be recreated, those are still very rudimentary.
The major gap in today technologies that try to recreate how our senses perceive the world are those that try to recreate haptic sensations. Haptic senses convey a lot of information to the observer, and the introduction of such senses in VR systems may cause a new leap in the immersive effect experienced by the user. However, such technologies are still in a very primitive state.
2.2.1.2 Transparency of Medium
Another prerequisite of immersiveness is the notion of not perceiving the medium that is reproducing the information that our senses are gathering.
Since the beginning of the computer age, the trend is to separate machine from man thought user-friendlier interfaces. However, as much user-friendly the applications might be, there is usually a clear separation between man and computer. With the display as a frame description of the computer world, within the real world.
Immersive VR is the technology that tries to eliminate this visibility of the computer, leaving only the user inside the generated environment. This transparency of medium is achieved by making the display occupy the user entire field of view so that the user doesn’t see the screen itself.
Just by fully altering the vision, it is possible to entirely change the awareness state of the observer and fool it by not perceiving the medium of communication separating men and machine with the “perfect display”.
2 . 2 . V I RT U A L R E A L I T Y
2.2.1.3 Spatiality of Display
So that is possible to enter a world, as three-dimensional beings, this world must be a 3D too allowing to perceive space. The act of presence, of being in a world, can be divided into three different components. Those are the sense of depth; the sense of surrounded; and the possession of a roving point of view.
The invention that best allows the user to perceive depth is the stereoscope that was created in 1833 by Charles Wheatstone. The invention uses two drawings, one for each eye, in such way, that fools the brain in unifying the images. These images differ slightly between them as it happens when visualizing the real world due to the separation of human eyes.
Combination of different technologies achieves the sense of being surrounded. By joining the concept of “perfect display” with the stereoscope that contains 3D images, it is possible to achieve the sensation of surrounded, of insertion in a different world.
The possession of a roving point of view is self-explanatory and allows to change point the point of view of the world. It is a fundamental mechanism that allows, for example, to trigger the parallax movement that is one depth cue used by the human brain. However, such movements in a non-immersive system are encoded, usually through keyboard use, and something else is required, that something is to navigate in a natural way.
2.2.1.4 Natural Language
As roving beings, we already possess ways to interact with the physical world, such as movements of limbs, head or even facial expressions. Those are a set of tools that humans naturally have and used since their existence to explore the real world. This type of non-symbolic language is crucial for the immersive effect as we are using at all times navigating through the real world. This fundament is also mentioned as one of the most exciting possibilities of VR by Jaron Lanier quoting:
"There’s also the ability of communicating without codes. This is a subtle distinc-tion, but one that is very, very profound. . . . I’m talking about people using their hands and their mouth, whatever, to create virtual tools to change the content of a virtual world very quickly and in an improvisational way."[8]
Lanier makes it clear that this natural language doesn’t have the purpose of substituting symbolic language but to complement it. This is because symbolic language is as part of the human communication systems as the non-symbolic language in current days.
Nonetheless, the introduction of natural language within the man-machine interface will facilitate some simple actions, like direct manipulation.
This objective is by no means a simple technological task, and numerous prototypes have been assembled that track parts of the user body, mainly head and hands. With the continuous miniaturization of sensors and with the increase in computational power to
C H A P T E R 2 . R E L AT E D W O R K
track more sensors at the time, is starting to provide enough precision to allow natural communication.
2.2.2 3D Interfaces Considerations
With a 3D environment as one of the foundation requirements of VR, the interface mechanism of such systems must also be 3D. However, the problems adjacent to 3D are applied and user studies reveal that complex user actions, disorienting navigation and annoying occlusions can affect overall performance negatively [20]. For these reasons, a hybrid concept becomes a more modest approach in interface design. This approach consists of using 2D interfaces in a 3D environment that can be windows that leave shadows or icons that match real-world objects.
To guide the design of effective 3D interfaces in book [20] is presentment a list of basic and advanced features that assist the effectiveness of 3D interfaces:
Basic:
1. Use occlusion, shadows, perspective/ and other 3D techniques carefully. 2. Minimize the number of navigation steps for users to accomplish their tasks. 3. Keep text readable (better rendering, good contrast with background, and no
more than 30-degree tilt).
4. Avoid unnecessary visual clutter, distraction/ contrast shifts, and reflections. 5. Simplify user movement (keep movements planar/ avoid surprises like going
through walls).
6. Prevent errors (that is/ surgical tools that cut only where needed and chemistry kits that produce only realistic molecules and safe compounds).
7. Simplify object movement (facilitate docking/ follow predictable paths, limit rotation).
8. Organize groups of items in aligned structures to allow rapid visual search. 9. Enable users to construct visual groups to support spatial recall (placing items
in corners or tinted areas).
Advanced:
1. Provide overviews so users can see the big picture (plan view display, aggre-gated views)
2. Allow teleportation (rapid context shifts by selecting destination in an overview). 3. Offer x-ray vision so users can see into or beyond objects.
4. Provide history keeping (recording, undoing, replaying, editing). 5. Permit rich user actions on objects (save, copy, annotate, share, send).
2 . 3 . VIS S Y S T E M S W I T H V R
6. Enable remote collaboration (synchronous, asynchronous).
7. Give users control over explanatory text (pop-up, floating, or ex-centric labels and screen tips) and let users select for details on demand.
8. Offer tools to select, mark, and measure.
9. Implement dynamic queries to rapidly filter out unneeded items.
10. Support semantic zooming and movement (simple action brings object front and center and reveals more details).
11. Enable landmarks to show themselves even at a distance.
12. Allow multiple coordinated views (users can be in more than one place at a time, users can see data in more than one arrangement at a time).
13. Develop novel 3D icons to represent concepts that are more recognizable and memorable.
2.3
Vis Systems with VR
As discussed in point2.1.3.1, the use of 3D in a visualization system has many disadvan-tages. However, VR interfaces compared to the keyboard, mouse and monitor interface, introduce more elements that are beneficial for the user perception of a 3D image and may mitigate several of the disadvantages in Vis VR. Several researches already have positive feedback of VR technologies on Vis systems. One particular paper,[4], that gathers several novel VR studies
one of its conclusions fallows quoted:
“VR has been shown to lead to better discovery in domains that whose primary dimensions are spatial.”
Some of the studies where VR revealed useful are palaeontology, brain tumour, shape perception, underground cave analysis, only naming few, where the common attribute is the spatial data attribute. Also, some studies support VR usefulness for collaborative tasks and remote experiences.
2.4
Problem Solving Environments(PSE)
PSE is a type of system that grants all sorts of computational facilities required to solve some target audience problems [6]. The system comprises of solution methods, either automatic or semi-automatic and ways of easily integrate new solution methods. The system also uses a language that is easily understandable by the target audience and provides easy access to computer resources without specialized knowledge of them.
Current days PSE usually possess a graphical interface sometimes used to visualize data and are of great importance in many research fields. This broad search is leading
C H A P T E R 2 . R E L AT E D W O R K
to more generalized PSE environments that allow answering the needs of many science fields.
2.5
SCIRun
SCIRun is a specific PSE framework that allows assembly, debugging and steering of large scale scientific computations[12]. It is an open-source licensing software primarily funded by the SCI Institute’s NIH/NIGMS CIBC Center. It provides a high-level control over parameters, to the non-specialist, efficiently and intuitively using a graphical interface and scientific visualizations.
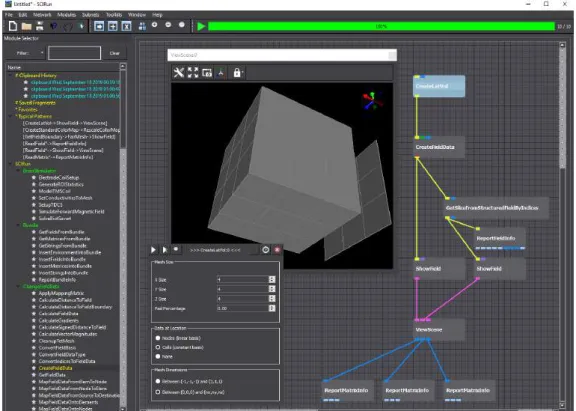
The graphical interface provides a menu with a list of modules, depicted in image2.8
on the left, where each contains its own set of input and output ports. The user may select them by dragging them on to the grid area an connect the module ports with the mouse and easily apply complex computations. The scientific visualizations allow the user to understand its data, and with interactive parameter control, understand the consequences of input changes.
The framework possesses some features that allow it to fulfil the requirements of PSE systems and more. In the following points its discussed such features.
Figure 2.8: The interface of the SCIRun system framework. On the left module list, on the right data flow network on center top a visualization widget and on center down is one module interface.
2 . 5 . SCIRUN
2.5.1 Modular Architecture
SCIRun modular architecture is the heart of this PSE system and is crucial to understand such methodology for both users and programmers.
Each module represents an algorithm or function that can perform the more diverse of tasks. Each one, depending on its functionality, may have input and/or output ports or even be managed dynamically. The four major groups of performed tasks by this system are data reading, geometric modelling, numerical analysis and scientific visualizations. By combining such tasks, through the graphical interface, the user can perform diverse and complex computations. Additionally, each module may possess its how interface for parameter changing, image2.8center down, allowing for even better control of the system and possibilities of execution.
2.5.2 Data Types, Ports and Connections
The framework possesses a variety of data types that represent a good portion of scientific data [21]. Besides the more common data types, like Strings, and primary types, like integers, some of the available complex data types are as follow: (1)Mesh, (2)Surface, (3)Matrix, (4)ScalarField, (5)VectorField, (6)Geometry (cone, cylinder, point, ...).
For each of the existing data types, there is a correspondent portag that can be used to assign some data structure into some module input or output port and are colour-coded to aid visualization. An output port can be connected to an input port by the user and allow passage of data from one module to another.
2.5.3 Dataflow network
The features addressed on the previous point allow to create a flow network, depicted in
2.8the right. The network fallows a data-driven policy. Meaning that modules that possess no input ports (no dependencies) are executed, and modules with dependencies await for the availability of their data dependencies to start execution.
For each module, a new execution thread is created, and a scheduler manages their creation along with the management of any interface changes that require re-computation of modules.
The user must have caution in the creation of dataflow graphs because it may create cyclic dependencies leading to deadlocks on the execution.
2.5.4 Module Development
The development over this tool uses C++ language, and it requires Qt, Git and Cmake modules for source code compilation. The system is designed to compile and run on the three major operating systems(Windows, MacOs, Linux).
A module as four different components although only the first two are required and they are as follows:
C H A P T E R 2 . R E L AT E D W O R K
Module configure: Consists of only one file(modulename.module) and is the root file that allows registration with the system. The following components must be discrimi-nated in this file, however, only the next one is mandatory. Also some basic module information must be written and the relative paths for files used.
Module Source: This element is comprised of two files (modulename.h and modulename.cc). The main function of it is to declare the module ports. Nonetheless, if implementing simple functionalities, the required code can all be written here.
Graphic Interface(Dialog): It contains three differentfiles. The UI file(modulenameDialog.ui)
created on Qt tool, where at its core is just a xml file declaring buttons or text-boxes, along with their id names and several other attributes, on its tag nested hierarchy. There are other two files (modulenameDialog.h and modulenameDialog.cc) that manage the mapping of UI variables to other variables declared either on Module Source and/or Algorithmic component files.
Algorithmic: Is composed of two files (modulenameAlgo.h and modulenameAlgo.cc). Usu-ally, they are meant to contain all the computation of the module and where the previous two components are meant for gathering the information needed to process such computations.
A more detailed explanation over module implementation exist in SCIRun documen-tation [19] along with example code.
2.5.5 Limitations
The major limitation of this framework, in context with the work, is the unavailability of an easy way to integrate any virtual reality system. Its interface and visualization widgets target the standard computer interface comprised of a display, mouse and keyboard, as the vast majority of human-in-the-loop computer systems does. The significant divergence between both interfaces in their ways operating and with the much greater complexity of implementing VR interfaces, forces this work to search a new framework that may lead to a more feasible development of a system that uses VR.
2.6
TOMO-GPU System
The project Tomo-GPU was founded by FCT/MCTES, and it developed a system with several modules using SCIRun framework. The objective is to assist material engineers in the analysis of tomographic images to aid the research of new composite materials.
Tomography is the scanning of some matter through the use of X-rays. The raw data generated from it corresponds to a 3D-matrix that represents a regular 3D grid of space, although in memory behaves as a one-directional vector data. In each position is stored one single value, more specifically a single byte int ranging from 0 to 255.
2 . 7 . U N R E A L E N G I N E 4 F R A M E W O R K
The implemented models provide several computations over the described data and are as follows:
Segmentation: This module possesses two different ways of process, those are
segmen-tation and bi-segmensegmen-tation and are selectable by its graphic interface. Both of them have the objective of deriving only three colours from the original dataset, white with the value of 255, black with the value 0, and grey with value 127. However, segmen-tation possesses just one input and splits based on that one value. Bi-segmensegmen-tation haves two input values splinting the black and white areas with a broader range of grey values.
Hysteresis: The module functionality consists in transforming all grey cells into black or white through analysis of its neighbourhood, leading to a fully divided space of black and white.
Image Labeling: Consists of identifying the reinforcements/objects within the data where
the objects consist of clusters of black cells. With such indentification a new storing structure is created. Instead of storing each cell with a value, only cells that belong to objects are stored, creating a more compact file.
Image Cleaning: It requires the objects to be discriminated, and its process is to remove the reinforcements that possess less than some inputted amount of cells.
VisAttributes: Its a module for visualizing the attributes obtained at the image labelling module.
The normal use of the implemented modules is sequential one, with the order pre-sented on the explanation list. Some other native modules of SCIRun must be used for visualization and data reading purposes. In image2.9, it is demonstrated such standard use of TOMO-GPU system.
2.7
Unreal Engine 4 Framework
The unavailability of VR support within the SCIRun framework, see 2.5.5, lead to the consideration of another framework that could handle VR heavy demands. The first needed requirement was to allow real-time renderization of an environment to "insert"the user along with the data to be visualized. The second requirement is an easy integration with the available virtual reality equipment on campus.
Two frameworks fulfil such demands; those were Unity engine and Unreal Engine 4 (UE4). At initial stages, the unreal engine was chosen because of previous knowledge of the tool. However, an available study [22] showed some quantitative analyses by bench-marking the two systems on a simple 3D Pac-man game and formulated some conclusions. The conclusions that UE4 performed better were: First, with the increasing
C H A P T E R 2 . R E L AT E D W O R K
Figure 2.9: Standard execution of Tomo-GPU. Retrieved from [25]
vertex count on the map, it performed better in terms of frame rate. Second, the average frame time with VR system was lower. Third, by lowering the render setting the relative speedup was greater. Some negative conclusions were made about UE4. The only one relevant is: with the increase of projection size for an increased resolution, made frame rate time rise more.
To be able to develop with Unreal Engine, some concepts and structures used are essential to understand and are discusses throughout this section.
2.7.1 Architecture Basics
The unreal engine framework provides a wide variety of classes that allow the implemen-tation of the most varied of functionalities from lighting to mesh insertions. However, four classes are the building blocks of the architecture:
UObject: The base block of the unreal engine where the vast majority of classes have it at their root. It registers the class on the system and provides it with some core services: Reflection properties and methods, serialization of properties, garbage collection, finding UObjects by name, Configurable values for properties, networking support and c++ blueprint communication.
AActor: Is a UObject that can be placed. It possesses position, rotation and scale and are the building blocks of world construction, not only, and where many classes derive from it. Some examples are AStaticMeshActor, APointLight and ACameraActor.
2 . 7 . U N R E A L E N G I N E 4 F R A M E W O R K
UActorComponent: Is a class meant for implementing shared functionalities across actors. Actors are usually assigned with higher-end tasks, while components are, typically, for lower-end tasks.
UStruct: Classic c++ structs, for data container construction, that benefit from services
provided by UObject class.
Some additional relevant classes are:
APawns: Are basic classes for implementation of moving objects either controlled by IA or player controller.
ACharacter: Extends the pawn class and is specially design for user use possessing some additional functionalities.
UProceduralMeshComponent: A component that allows creation and animation of meshes on runtime with explicit declaration of vertexes and triangles.
FNonAbandonableTask: A class that allows to easy implementation of async threads that must terminate.
UInstancedStaticMeshComponent: Its a component with the functionality of replicate one previously associated static mesh in an efficient way.
UMaterial: Object that possesses reference to a single material. Materials are complex structures with lots of properties. Those properties may be parameterized to allow the dynamic creation of materials by affecting such parameters with code.
UMaterialInstanceDynamic: Its a specific instance of a UMaterial.
One specific class that deserves special consideration is called AGameMode. Such class is where is possible to specify many options, mainly game oriented, like if the game can be paused or not. Another main feature is the mapping of some classes to core variables of the engine. Those variables are game session(AGameSession), game state (AGameState), player controller (APlayerController), HUD(HUD), default pawn (APawn), spectator (APawn) and spectator controller (AController).
UE4 uses a custom prefix notation. This notation is to identify the inheritance of classes where the used prefixes are: T for template classes, U object classes, A for actor classes, I for abstract interfaces, E for enums and F for other types although some subsystems posses their custom notation.
As mentioned before, UE4 has a reflection system that drives many useful systems. A reflective system, in computational terms, is a system that can monitor and even change its elements. A special annotation language exists, called property system, to access and manipulate some options of the reflection system where UE4 class wizard automatically generates many of them. Some of the most elemental are: UCLASS(), USTRUCT(),
C H A P T E R 2 . R E L AT E D W O R K
GENERATED_BODY(), UPROPERTY() and UFUNCTION(). Every markup has input parameters that allow changing behaviour, for example, the change policy on editor or if it is visible on blueprints system.
2.7.2 Development
There are two major ways of developing a system with UE4, and one must be selected on project creation. Those are editor only or C++ with editor.
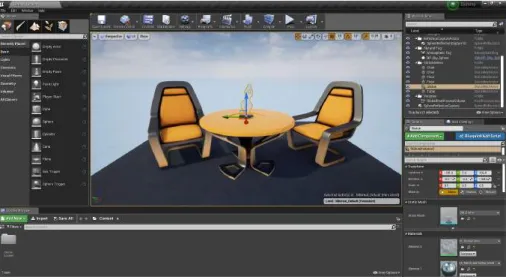
The editor is a central part of unreal engine development with its default main inter-face depicted on 2.10. It is basically a 3D environment builder with a vast amount of functionalities, and it consists of 5 different panels. The world viewport in the center where the environment can be inspected and modified. The word outliner on the top right that hierarchy lists all world instanced objects. The detail panel on the bottom right that lists the details of a selected object. The content browser on the bottom to manage all assets and objects created. Finally, the modes panel on the left that contains the most varied of tools to add and manage the classes that UE4 provides, on some world.
Figure 2.10: Unreal Engine 4 editor interface.
The major bifurcation of development is on logic implementation, where on the editor can be done using the blueprint system, discussed in the next point, or externally with Microsoft Visual Studio(VS) editor using c++ code. To use VS, one must specify on project creation to generate, also, the VS files and it possesses many tools to bridge functionalities with UE4 editor.
2.7.3 Blueprints
Blueprint is a system that can be used in on unreal engine editor, and an example may be seen in 2.11. They essentially are tools to aid the non-programmer in introducing logic on the system. They function through modules with the drag, drop and connect scheme, very similar to SCIRun dataflow network2.5.3. The use of such system is almost
2 . 7 . U N R E A L E N G I N E 4 F R A M E W O R K
as programming where module functionalities vary from the basic If or For statements, to complex functionalities of mesh loading, texture mappings and so forth.
Figure 2.11: UE4 blueprint system. Retrieved from [1]
The white line represents flux of execution, where other colour-coded lines represent data connection with colour representing its type. Each module possesses two types of ports, for flux lines and for data. At the left of the module, is their input ports, with one flux and n data ports, at its right is its output ports, with at least one flux and n data ports.
Such high-end system has its costs and processing large quantities of data with blueprints is inefficient. However, general best practices used them for event triggering management or bridging information between actors, for example.
2.7.4 Attachment System and World Composition
A typical structure found in real-time renderization engines is the object hierarchy n-ary tree. This system allows the implementation of many functionalities. A primary func-tionality is the implementation of relative positioning being very useful in the creation of environments where to find some object absolute position, one must iterate the transfor-mations of the object parents until the root is reached. On Unreal Engine isn’t mandatory to use such relative positioning and such n-ary tree may be used as a list. However UE4 leverages on such structure in many different ways but the main purpose is for the reflective system to keep track of all spawned entities in the world.
Figure 2.12: World with four levels. Adapted from [13]
To use such system the engine denominates attachment the act of creating a new relationship in such three. Parent and child objects must be given, along with some other information like rel-ative(or absolute) translation, rotation scaling and some other characteristics depending on the nature of the object attached.
There are two important concepts to build an en-vironment, those are level/map and world. A level is the root component of one hierarchy three, and the world is a grid of several levels. This system potential lies in the creation of large environments
C H A P T E R 2 . R E L AT E D W O R K
allowing partitioning the amount of objects that need loading depending on user position-ing on the map. This concept is better explained with the image2.12where each yellow square is a level or map, and all of the squares are the world. Nonetheless, for simple environments, only one level may be used.
One last concept is that for each world, one AGameMode class must be associated and as explained in2.7.1, such class possesses several references of some basic classes that are required for a world to be "playable".
2.7.5 Execution Flow
In this point is made the distinction of two separate flows, the launch flow and the active cyclic flow. The launch flow as also two major branches, the launch branch from the editor and the launch from the standalone version. There are some differences due to some pre-loaded elements that are required on the editor. Nonetheless, whatever may be the launch flow the GameMode class is of central interest here. It contains, usually, the first logic introduced by the developer. Also, important notice is that the launch flow possesses many stages and such stages must be respected on the system development to avoid errors.
The initializations made system launch provides the the elements to start actors and components life cycle. These objects life cycle may start on world creation, or if spawned, nonetheless these stages are almost the same and can be accessed with some built-in methods. Some of them are PostActorCreated(), BeginPlay() and BeginDestroy(). The mention methods are event driven and represent, usually, a small part of the object life cycle.
The cyclic flow of the unreal engine is at the core of this framework and is the functionality that, literally makes "time"move forward in the system. Internally it also works as an event driven method but is called cyclically to update the associated object, representing most of the object life cycle. Actors and Components can leverage from it with the use of the built-in method Tick() that it is called at every frame. Inside the engine it is what triggers all rendering functionalities after all inputs, IA’s, physics and many other systems have made their changes. Such a demanding process should lead to carefully consideration, where significant blocks of computation can reduce the system liveness.
2.7.6 VR Support
The unreal engine provides full support for two VR hardware systems. Those are OCulus Rift and HTC vive head set, where the latest is the available equipment for test and development.
The management of the SDK of each possible VR set is throght the plugin system. There are a vast number of native plugins on UE4. Usually they possess functionalities that are very specific and ain’t required on a majority of projects. Because of it they are considered plugins and may be added to a project on demand.
2 . 8 . P R O TO T Y P E F R A M E W O R K C H A R A C T E R I Z AT I O N
2.8
Prototype Framework Characterization
This section has the purpose of assembling some information gathered through the chapter and applies the framework assessed in the specific point2.1.1, to be able to describe the prototype. Such description will allow to categorize it and examine the current state of the art for such categories.
First, the system is for integration with TOMO-GPU project, that was design to help material engineers on the development of new composite materials. The data handled by the system corresponds to a 3D grid that is a representation of a regular grid of space, with some additional meta-data extracted. Nonetheless, the geometric element of data is the key component of this work because it is the one that would benefit the most with VR visualization. Has mentioned in point2.3, VR leads to a better understanding of data that its main characteristic is spacial. However, current TOMO-GPU implementation over the SCIRun framework didn’t possess support for VR interface leading the development to use Unreal Engine 4 framework.
With some knowledge over data, task, and development tools involved for visual-ization it is possible to initialize a prototype description by accessing the three major components of the Vis framework, with some additional help of current state of the art literature.
2.8.1 Geometric Data Abstraction(What)
With the focus on geometric data, having a abstract characterization of it will prove useful to describe design stages of the prototype. One possible characterization is presented on [18], and classifies geometric data sets as a structure with its associated attributes where this structure has a topology and a geometry component.
The topology consists of the connections established between vertexes if any. Possible topologies are depicted in image2.13along with exemplary numbered ordination that can be used to conventionalize vertex order in memory. A particular characteristic of this abstraction is its invariance under traditional geometric transformations(scale, rotation and translation).
The other major element, geometry, refers to a particular instance of a topology where positioning in space is specified.
The two elements describe a cell in its whole and are usually associated with some attribute data. Some common manifestations of such data are scalars, vectors, tensors, normal’s and UV’s.
To form a data set, cells must possess some type of organization. Usual structures are figured in2.14and are grouped into two primary categories, structured and unstructured. Structured means that there is a single mathematical formula to describe the relationship of cells allowing significant memory savings. Unstructured must be explicitly represented having higher memory costs.
C H A P T E R 2 . R E L AT E D W O R K
Figure 2.13: Geometry topology abstraction. Retrieved from [18]
Figure 2.14: Geometry dataset structures. Retrieved from [18]
2 . 8 . P R O TO T Y P E F R A M E W O R K C H A R A C T E R I Z AT I O N
Two different topologies structured into two types of data sets heavily influence this work. The first combination is the voxel topology structured into image data. Image data organization refers not only to the easily associated 2D images, but also to 1D lines and 3D voxels. Such a combination provides the first classification of data used by the TOMO-GPU system2.6. The tomography scan provides a regular grid of space(3D voxels) and is associated with one value(scalar).
The second combination is triangle strips with polygon data organization. Polygon organization is an unstructured one and falls in the range of UE4 engine structure. Such en-gines designed for the game industry have the objective of creating realistic environments where usually no mathematical formula can express all of the cells positioning. Triangle strip is a type of topology assembled with 2D triangles where those may share vertexes and edges. Such triangles don’t need to be coplanar and can then be used to describe complex 3D surfaces. It’s the primary method used in real-time rendering engines to describe such surfaces because it is more efficient for real-time rendering compared to other complex surface descriptors like quad strip or poly strip.
2.8.2 Material Engineer Tasks(Why)
The objective of material scientist engineer is the construction of new composite materials and techniques for such development. Composite proprieties depend not only on the elemental materials used but also, on the spatial characteristics and other chemical and physical phenomenons.
This work focuses mainly on the interpretation of the spatial characteristics. Some work on TOMO-GPU project [3] already provides many geometric meta-data. Those are centroid, oriented and axis-aligned bounding box, volume, surface area and principal component analysis. Such information provides only a resume of spatial data not allowing to perform some of the tasks in the geometrical realm, for example, shape recognition. Nontheless, SCIRun provides visualization modules for this type of data but is not suitable to explore the VR potential in 3D visualizations.
2.8.3 Visualization Algorithms of Geometric Data(How)
In this point, a classification algorithms, retrived from [18], used to transform geometric data will be presented, to establish the useful the ones for this work.
The classification possesses two primary components: structure and type. The algo-rithm structure is the definition of changes made in topology and geometry. The algoalgo-rithm type, is the type of data operated on, and also the type of data generated, if any.
Structural classes are: (1)Geometric transformations, that change only the geomet-ric part of data; (2)Topological transformations, that change only the topology part of data; (3)Attribute transformations: that convert attribute from one form to another; (4) Combined transformations, different combination of the previous three types.
C H A P T E R 2 . R E L AT E D W O R K
Type classes are: (1) Scalar algorithms, operate on scalar data; (2) Vector algorithms, operate on vector data; (3)Tensor algorithms, operate on tensor fields; (4) Modelling algorithms, that may generate topologies, geometries or attribute data that operate over more than one previous class and is meant as a catch-all class.
With the knowledge over data, gathered on2.8.1, and this algorithm classification is then possible to conclude the class of algorithms needed.
The algorithm structure needs to operate over scalar data and possess topological transformation from a regular grid(voxels) to an isosurface represented by a triangle strip, as required by the Unreal Engine framework. Such type of algorithms are well known in the computer field of graphics and visualization and are usually known as contouring or modeling algorithms that linearly interpolate the surface cell by cell of the regular grid using some technique.
With it many possible algorithms, in the following points it will only be addressed those that are implemented on the final prototype and those that heavily influence this area of knowledge.
2.8.3.1 Simple Cubes
The concept behind the simple cubes algorithm is to process each voxel by looking at its six face neighbours and draw a square face between filled and unfilled voxels. A slice side view of the algorithm behaviour is depicted on2.15aand a possible resulting mesh of a 3D sphere mapped on a regular grid on2.15b. The process creates a squared strip, but each square may be subdivided into two triangles to formulate a triangle strip required.
a ) Slice view. b ) 3D view of mesh.
Figure 2.15: Simple cubes algorithm.
The advantages of this algorithm are the easy of implementation, the nonexistent slivers(odd shapes formed on the mesh) and is locally independence, meaning that the process in each voxel does not account for the process of any other voxel. However, the produced mesh is rough, and features of its true form may be lost.
2 . 8 . P R O TO T Y P E F R A M E W O R K C H A R A C T E R I Z AT I O N
2.8.3.2 Marching Cubes
To understand the marching cubes algorithm first, we will address its simpler 2D version on a pixel topology denominated marching squares or contouring. The algorithm requires the scalar values to be attributed to each vertex. The threshold of the scalar value must be selected, deciding if a vertex belongs inside or outside of the contour. The binary classification of each vertex results in a 24= 16 possible combinations in a pixel topology, depicted on2.16.
Figure 2.16: Contouring algorithm cases. Retrieved from [18]
The marching cubes algorithm applies the same principle as the marching squares. However, the possible neighbourhood combination is much larger. By attributing the scalar value to a voxel vertex and classify each as inside or outside, it totals on 28= 256 possible cases of a neighbourhood. There are many mirrored cases on these combinations, and all combinations may be resumed to 15 different topological situations depicted on image2.17.
Compared with the previous algorithm, it has a much harder implementation and it may generate slivers on the mesh. However, it smoothens the object mesh and approxi-mates to it’s true form and is still a local independent process for each voxel.
Many algorithms derived from this one, the majority reflects one great problem that is the lack of expressivity [17]. This deficiency leads to the loss of thin features of an object meaning, if two vertexes of the real object lye inside of a voxel that information is lost. This problem can be counter by making a finer grain grid. However, that approach can quickly generate a large number of polygons.
2.8.3.3 Dual Marching Cubes
The dual marching cubes algorithm was developed to resolve the major problem that exists in the family of algorithms derived from the marching cubes algorithm discussed in the previous point.
The algorithm uses an octree structure, that is a typical structure used to represent grided volume where the eight children of each node are the respective octants of the parent volume and space is recursively subdivided to create a finer grain grid. The dual marching cubes adaptively samples this structure and allowing a significant reduction
C H A P T E R 2 . R E L AT E D W O R K
Figure 2.17: Marching cubes algorithm base cases. Retrieved from [18]
in generated polygons. A more detailed explanation can be explored in [17] however in image 2.18is depicted the result of dual marching cubes against marching cubes over a room with thin walls and it is possible to perceive the greater efficiency in reducing polygons generated.
Figure 2.18: Results of Marching cubes algorithm to the left and dual marching cubes to the right. Retrieved from [17]
2.9
Summary
In this chapter, it was gathered the knowledge required for the development of a visual-ization tool for composite material research.
At first we looked into a possible framework for designing Vis tools. The overall framework is described in2.3and reveals the different layers of abstraction to take into consideration. Furthermore, such layers are divided into two different parts, the upstream and downstream parts where only the downstream part can completely validate a system.
![Figure 2.1: Elements of interaction in visualization. Adapted from [15]](https://thumb-eu.123doks.com/thumbv2/123dok_br/15903086.1091735/22.892.208.681.420.590/figure-elements-interaction-visualization-adapted.webp)
![Figure 2.3: Construction and validation framework. Adapted from [11]](https://thumb-eu.123doks.com/thumbv2/123dok_br/15903086.1091735/24.892.474.758.348.675/figure-construction-validation-framework-adapted.webp)
![Figure 2.5: Visual channels for data encoding. Adapted from [11]](https://thumb-eu.123doks.com/thumbv2/123dok_br/15903086.1091735/25.892.173.725.801.990/figure-visual-channels-data-encoding-adapted-from.webp)
![Figure 2.9: Standard execution of Tomo-GPU. Retrieved from [25]](https://thumb-eu.123doks.com/thumbv2/123dok_br/15903086.1091735/36.892.285.605.150.520/figure-standard-execution-tomo-gpu-retrieved.webp)
![Figure 2.11: UE4 blueprint system. Retrieved from [1]](https://thumb-eu.123doks.com/thumbv2/123dok_br/15903086.1091735/39.892.193.705.217.364/figure-ue-blueprint-system-retrieved-from.webp)
![Figure 2.13: Geometry topology abstraction. Retrieved from [18]](https://thumb-eu.123doks.com/thumbv2/123dok_br/15903086.1091735/42.892.215.684.210.631/figure-geometry-topology-abstraction-retrieved-from.webp)
![Figure 2.16: Contouring algorithm cases. Retrieved from [18]](https://thumb-eu.123doks.com/thumbv2/123dok_br/15903086.1091735/45.892.179.711.345.511/figure-contouring-algorithm-cases-retrieved-from.webp)