INTEGRATED MASTER IN ENVIRONMENTAL ENGINEERING 2012/2013
E
FFECT OF PROTEIN IN AEROBIC GRANULAR SLUDGE
N
UNOM
IGUELL
EONARDOM
OREIRADissertation submitted for the degree of
MASTER IN ENVIRONMENTAL ENGINEERING FROM FACULTY OF ENGINEERING OF UNIVERSITY OF PORTO
President of the jury:
___________________________________________________________ Supervisor at the University:
Supervisors: Professor Mark van Loosdrecht, Full Professor; Mario Pronk, PhD Candidate (Delft University of Technology)
Edited by:
FACULTY OF ENGINEERING OF UNIVERSITY OF PORTO Rua Dr. Roberto Frias
4200-465 PORTO Portugal Phone: +351-22-508 1400 Fax: +351-22-508 1440 E-mail: feup@fe.up.pt Website: http://www.fe.up.pt
Partial reproductions of this document will be authorized in the condition of being mentioned the Author and referred the Integrated Master in Environmental Engineering – 2012/2013 – Faculty of Engineering of University of Porto, Porto, Portugal, 2013.
The opinions and information included in this document represent only the point of view of the respective Author. The Editor cannot accept any legal responsibility or other related with mistakes or omissions that might exist.
I
Acknowledgments
First of all I would like to thank Professor Mark van Loosdrecht for letting me have the opportunity to go abroad and finish my master degree. A big thank to my supervisor Mario Pronk, for sharing your knowledge, for being patient with some problems that I experienced during my stay and for all your support, it was a pleasure to be your “koala”.
A really big thank to all of my friends that worked with me in Julianalaan, for all the support in my work, it was amazing the laboratory experience with mutual help. I will keep with me all the good moments we have shared, and they were a lot. Thank you Emma, Jose, Marianna, Monica, Sandra, Manuel, Nico, Maria, Sheeva and all my lab colleagues!
Alex and Omar, it was a pleasure sharing the house with you, and thank you for not letting me go back to Portugal and accepting me in your house. (Haha! Andale, andale! NO MAMES :D)
Reyes, Pia, Javi, Adriana, nunca he pensado encontrar alguien como vosotros en que me hiciran sentir como se estubiera en casa. Tenemos que nos mantener sempre en contacto!! Vos echo!!
To all the friends that I have made in Delft, the biggest thank!! You made this journey unforgettable and full of happiness!
A huge thank to my friend Gustavo for helping me with this thesis and for all the support during my stay in Delft.
And finally, but not least, a special thank to my mother for all the support given and to my best friend and brother, Nuno Cordeiro.
II
Abstract
A sequentially batch reactor (SBR) system based on aerobic granular sludge (AGS) is a one-reactor system for complete wastewater treatment. This kind of system requires less space and economic investment than the conventional wastewater treatment plants (WWTP), like activated sludge systems. In this technology, it has been developed and optimized the chemical oxygen demand (COD) reduction and phosphate and N-removal.
It was studied the “effect of protein in aerobic granular sludge” with the objective of expect possible problems in WWTP’s, performed by industries discharges with high protein concentrations. The parameters analyzed to understand the protein influence were: granule morphology, COD removal, phosphate removal (P-removal), N-removal and any structural change in the microorganism’s population.
In the start-up, to get a stable system, the system was fed with readily and easily biodegradable substrate (acetate) as total influent COD. After the system got stable, protein was dosed as 20% of the total influent COD. The protein influence was followed using weakly measurements, batch tests, fluorescent in situ hybridization (FISH) and cycle tests.
Before adding the protein, the system was showing 100% COD removal, 98% phosphate removal, 76% N-removal and granules were smooth and round shaped. The first results obtained after adding the protein to the system showed a decrease in nutrient removal and filamentous grew in the outer layer of the granules. After microorganisms got adapted to the new substrate, good results were once again achieved. Protein degradation process was neglected due to the impossibility of getting conclusive results.
In the end of the research the system showed 100% COD removal, 96% P-removal and 55% N-P-removal with round shaped granules again. It was proved to be possible to have a waste water treatment with 20% of protein as the influent COD. For some reason that could not be explained in this thesis, it was noticed a decrease in glycogen accumulating organisms (GAO) population and phosphate accumulating organisms (PAO) suffered a shift from PAO I to PAO II.
III
Resumo
Um sistema de reator descontínuo em sequência com base em lamas de grânulos aeróbicos é um método utilizado para o tratamento completo de águas residuais. Este tipo de sistema requer menos espaço e menor investimento do que uma estação de tratamento de águas residuais (ETAR) convencional, como sistemas de lamas ativadas. Nesta tecnologia foi desenvolvida e otimizada a redução da carência química de oxigénio (COD) e a remoção de fosfato e azoto.
Foi estudado o “efeito de proteína em lamas de grânulos aeróbicos” com o intuito de prever possíveis problemas em ETARs, realizado por descargas industriais com altas concentrações proteicas. Os parâmetros analisados para entender a influência proteica foram: morfologia dos grânulos, remoção de COD, remoção de fosfato, remoção de azoto e qualquer alteração na população de microrganismos.
Neste start-up, para se obter um sistema estável, o sistema foi alimentado com substratos rápida e facilmente biodegradáveis (acetato) como COD afluente total. Depois da estabilização do sistema, a proteína foi doseada como 20% do COD afluente total. A influência proteica foi monitorizada usando medições semanais, baterias de testes, hibridização fluorescente in situ (FISH) e testes durante o ciclo do reator.
Antes de adicionar a proteína, o sistema mostrava 100% de remoção de COD, 98% de remoção de fosfato, 76% de remoção de azoto e os grânulos eram lisos e esféricos. Os primeiros resultados obtidos após a adição da proteína ao sistema mostraram uma diminuição da remoção de nutrientes e cresceram filamentos na camada externa dos grânulos. Após a adaptação dos microrganismos ao novo substrato foram atingidos bons resultados, novamente. O processo de degradação proteica foi negligenciado devido à impossibilidade de obter resultados conclusivos.
No final do estudo o sistema mostrava 100% de remoção de COD, 96% de remoção de fosfato e 55% de remoção de azoto, tendo os grânulos voltado à forma esférica inicial. Foi provado ser possível haver tratamento de águas residuais com 20% de proteína como COD afluente. Por alguma razão que não pode ser explicada neste trabalho, foi notada uma diminuição das populações de organismos acumuladores de glicogénio (GAO) e organismos acumuladores de fosfato (PAO) sofreram uma mudança de PAO I para PAO II.
IV
List of contents
1. Introduction ... 1
1.1 Characteristics of activated sludge systems ... 1
1.1.1 Biological processes in wastewater treatment ... 1
1.1.2 Biological phosphate removal ... 2
1.1.3 Removal of organic carbon ... 2
1.1.4 Removal of nitrogen compounds: nitrification and denitrification ... 3
1.1.5 Separation of biomass and effluent ... 3
1.2 Compact wastewater treatment plants ... 4
1.2.1 Aerobic granular sludge ... 4
1.3 The Research ... 9
1.3.1 Research introduction ... 10
2. Materials and Methods ... 12
2.1 Reactor Set-up and operation ... 12
2.2 Influent medium ... 14 2.3 Measurements ... 15 3. Results ... 17 3.1 Granule morphology ... 17 3.2 Reactor performance ... 19 3.2.1 Nitrogen removal ... 19 3.2.2 Phosphate removal ... 20 3.2.3 COD removal... 221 3.2.4 Protein degradation ... 22 3.2.5 FISH analysis ... 23 4. Discussion ... 26
4.1 Influence of protein on granule morphology ... 26
4.2 Influence of protein in nutrients removal ... 27
5. Conclusions ... 311
V
List of figures and tables
FIGURE 1.BASIC SCHEME OF AN ACTIVATED SLUDGE SYSTEM. ... 1
(SOURCE:CONVENTIONAL ACTIVATED SLUDGE SYSTEMS,INFORMATION LEAFLET,KRUGER,VEOLIA WATER) ... 1
FIGURE 2.SCHEMATIC REPRESENTATION OF EXTRACELLULAR POLYMERIC SUBSTANCE-ENHANCED BIOGRANULATION ... 7
FIGURE 3.SCHEMATIC REPRESENTATION OF THE LAYERED STRUCTURE OF AEROBIC GRANULES ... 7
FIGURE 4.SCHEMATIC LAB SCALE REACTOR SET-UP. ... 12
FIGURE 5.SOY PROTEIN USED IN THIS STUDY. ... 15
FIGURE 6.STANDARD TEST KIT DR LANGE TYPE LCK. ... 15
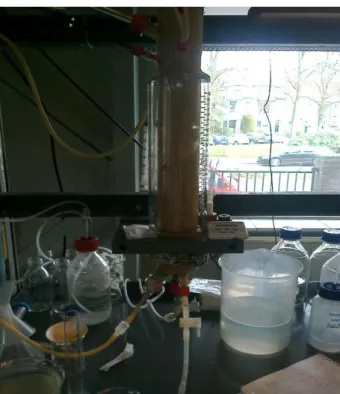
FIGURA 7.REACTOR USED TO EXECUTE THE EXPERIMENT ... 16
FIGURE 8.(A)GRANULAR SLUDGE TAKEN BEFORE ADDING SOY PROTEIN,7,8X, STEREOZOOM (15-04-2013, DAY 41);(B) GRANULAR SLUDGE TAKEN 20 DAYS AFTER ADDING SOY PROTEIN,7,8X, STEREOZOOM (14-05-2013, DAY 70);(C) FILAMENTOUS GRANULE,39,4X, STEREOZOOM (14-05-2013, DAY 70);(D)VORTICELLA SPP. GROWING ON THE OUT LAYER OF THE GRANULE,56.6X STEREOZOOM (22-06-2013, DAY 108).ALL RED BARS REPRESENT 1000µM. ... 17
FIGURE 9.NITROGEN COMPOUNDS CONCENTRATIONS IN THE EFFLUENT... 19
THE HORIZONTAL BROKEN CURVED LINE IS RELATED TO TOTAL N-PERCENTAGE REMOVAL AND THE VERTICAL BROKEN LINE REPRESENTS THE TIME WHEN PROTEIN WAS DOSED. ... 19
FIGURE 10.PHOSPHATE REMOVAL. ... 20
THE GREEN LINE REPRESENTS THE PO43-MEASURED AFTER FEEDING, AND THE ORANGE LINE IS RELATED TO PO43- IN THE EFFLUENT.THE BROKEN CURVED LINE IS RELATED TO % REMOVAL AND THE HORIZONTAL BROKEN LINE REPRESENT THE TIME WHEN PROTEIN WAS DOSED. ... 20
FIGURE 11. (A)C-SOURCE SAMPLE;(B)INFLUENT SAMPLE;(C)SAMPLE TAKEN RIGHT AFTER FEEDING;(D)EFFLUENT SAMPLE. ... 21
FIGURE 12.FISH PICTURES 40X, DAY 18(22-03-2013).DIFFERENT DATE PICTURES FROM EUBACTERIA,PAO AND GAO, WHITE AND BLACK PICTURE AND FLUORESCENCE PICTURES SHOWING GAO(GREEN),PAO(RED) AND EUBACTERIA (PURPLE).ALL BARS REPRESENT 20 µM. ... 23
FIGURE 13.FISH PICTURES 40X, DAY 93(07-06-2013).DIFFERENT DATE PICTURES FROM EUBACTERIA,PAO AND GAO, WHITE AND BLACK PICTURE AND FLUORESCENCE PICTURES SHOWING GAO(GREEN),PAO(RED) AND EUBACTERIA (PURPLE).ALL BARS REPRESENT 20 µM. ... 24
FIGURE 15.LAYERED STRUCTURE OF AEROBIC GRANULE AND PROTEIN HYDROLYZATION. ... 29
TABLE 1.TIMING OF ONE CYCLE. ... 19
VI
List of abbreviations
AGS – Aerobic Granular Sludge AOB – Ammonia-Oxidizing Bacteria COD – Chemical Oxygen Demand DO – Dissolved Oxygen
EBPR – Enhanced Biological Phosphorus Removal EPS – Extracellular Polymeric Structures
ETAR – Estação de Tratamento de Águas Residuais FISH – Fluorescent in Situ Hybridization
GAO – Glycogen Accumulating Organisms HRT – Hydraulic Retention Time
LCFA – Long Chain Fatty Acids
MFCS – Microsoft Foundation Classes Software NaAc – Sodium Acetate
N-removal – Nitrogen Removal NOB – Nitrite-Oxidizing Bacteria
PAO – Phosphate Accumulating Organisms PHA – Polyhydroxyalkanoates
PHB – Poly-β-hydroxybutyrate Poly-P – Poly-Phosphate
P-removal – Phosphate Removal
SBAR – Sequencing Batch Airlift Reactor SBR – Sequentially Batch Reactor
SND – Simultaneous Nitrification and Denitrification SRT – Solid Retention Time or sludge age
1
1. Introduction
1.1 Characteristics of activated sludge systems
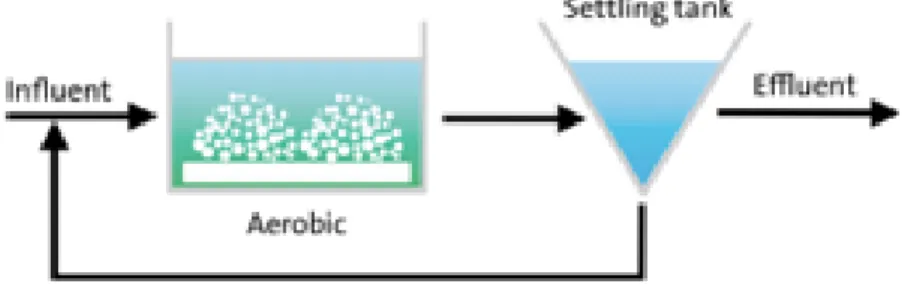
Activated sludge systems are still the most commonly used systems for biological wastewater treatment. Organic carbon and nutrients from the influent removal is performed by a mixed culture of suspended biomass. In these systems the treatment entails two basic steps: an aeration tank, in which biochemical processes take place, and a settling tank, in which the treated effluent is separated from the biomass (Figure 1) (De Kreuk et al., 2010).
The efficiency of biological wastewater treatment depends upon: i) the selection and growth of microorganisms metabolically capable of converting the polluting agents and growth under given circumstances and ii) upon the efficient separation of those organisms from the treated effluent in the settling tanks (De Kreuk et al., 2010).
1.1.1 Biological processes in wastewater treatment
In activated sludge systems, the microbial community is very large and diverse, containing viruses, bacteria, fungi, algae, protozoa and metazoan. The most common group is bacteria. The biochemical stage of an activated sludge plant can be separated in aerobic tanks (oxidation of organic carbon and ammonia), anoxic tanks (denitrification for complete nitrogen removal (N-removal)) and anaerobic zones (to select phosphate accumulating organisms (PAO) that are capable of biologically removing phosphate) (De Kreuk et al., 2010).
Figure 1. Basic scheme of an activated sludge system.
2
1.1.2 Biological phosphate removal
Bacteria have to be exposed to different anaerobic and aerobic conditions to achieve enhanced biological phosphorus removal (EBPR). Readily biodegradable substrate must be supplied under anaerobic conditions. In the course of the anaerobic period, the substrates that are easy degradable as acetate, are taken up in the cell and stored as polyhydroxyalkanoates (PHA). Acetate is stored as poly-β-hydroxybutyrate (PHB). The hydrolysis of intracellular stored poly-phosphate (poly-P) to orthophosphate releases the orthophosphate from the cell to the bulk liquid. This hydrolysis provides the energy for the acetate uptake and storage.
The reduction equivalents required for the conversion of acetate to PHB are supplied by conversions of glycogen, which is stored during the aerobic period from PHB (Blackall et al., 2002; Mino et al., 1998). During the aerobic or anoxic phase, when there is no external substrate, PHA is used as substrate to provide cell growth, poly-P synthesis and glycogen formation.
GAO and PAO have one metabolic difference, which is, the phosphate uptake that does not occur during GAO’s metabolism (De Kreuk et al., 2006).
1.1.3 Removal of organic carbon
Domestic sewage can be roughly divided into carbohydrates, fats and proteins. Organic carbon is mostly oxidized by heterotrophic organisms to CO2, using
oxygen or nitrite/nitrate as an electron acceptor (denitrification). Particulate and colloidal organic carbon must be hydrolyzed first before the bacteria can use it for their metabolism, while other part of organic carbon is assimilated to new biomass. The organic carbon part which is not degradable will be incorporated in the activated sludge flocs and removed from the system with the excess sludge.
Organisms can use the stored substrates to oxidize during famine periods and to regulate their growth rate (Beun, 2001; Martins et al., 2004; Van Aalst-Van Leeuwen et al., 1997).
3
1.1.4 Removal of nitrogen compounds: nitrification and denitrification
The nitrification process consists in the oxidation of ammonia into nitrite to nitrate. The group of bacteria from the genus known as Nitrosomonas is the responsible for the first conversion. The second conversion is performed by a group of bacteria from the genus known as Nitrobacter. The second conversion of the N-removal is the denitrification, where nitrate or nitrite is used as an electron acceptor for the organic carbon oxidation and it is converted to N2 gas. This procedure occurs
under anoxic conditions (De Kreuk et al., 2006)
Nitrification: NH4+ + O2 -> NO2- + H2O + 2 H+ + 240 kJ (Equation 1) NO2- + ½ O2 -> NO3- + 65 kJ (Equation 2) Denitrification: 8 NO3- + 5 CH3COO- + 13 H+ -> 4 N2 + 10 CO2 +14 H2O + 165,2 kJ (Equation 3) 8 NO2- + 3 CH3COO- + 11 H+ -> 4 N2 + 6 CO2 + 10 H2O + 107,7 kJ (Equation 4)
The bacteria responsible for the nitrification are autotrophic organisms (CO2 as
C-source) and have low growth rate.
Nitrification and denitrification can occur simultaneously (SND) within one sludge floc, as long as the oxygen penetration depth in the floc is limited and a substrate rich interior is present for denitrification (De Kreuk et al., 2005; Pochana and Keller, 1999; Satoh et al., 2003; Third et al., 2003).
1.1.5 Separation of biomass and effluent
Before the effluent can be discharged into the surface water, biomass and treated effluent need to be separated. This process takes place in the settling tank, where is produced a clarified final effluent and a thickened flow of sludge which returns to the activated sludge tank, are produced. Since there is no mixing in the settling tank, the suspended biomass usually form sludge flocs that settle relatively slow, which leads to long hydraulic retention time (HRT) before releasing the clear effluent.
4
1.2 Compact wastewater treatment plants
Conventional activated sludge systems require large surface area. Due to the relatively poor settling characteristics the permissible dry solids concentrations in aeration tanks are low.
Since wastewater treatment systems are built close to dense populated regions, land is limited. In result, during the last decades different compact treatment systems were developed, as biofilm systems, membrane bioreactors and aerobic granular sludge which were used to perform this study.
1.2.1 Aerobic granular sludge
At the end of the 1990’s, research showed the advantage of a discontinuous fed system (Beun et al., 1999; Heijnen and Van Loosdrecht, 1998; Morgenroth et al., 1997). In these aerobic Sequencing Batch Airlift Reactors (SBAR’s), it was proven to be possible to grow stable granular sludge with integrated COD and N-removal (De Kreuk et al., 2010).
Due to high settling capacity of the granules, the traditional settler becomes redundant and the installation can be designed as a high and slender reactor.
It was possible to grow granular sludge with slowly biodegradable substrates (e.g. methanol or ammonia) in continuously operated systems. In the case of easily biodegradable substrates, these systems can only be used when enough basalt is added to the system (as carrier material and for shear reasons, Kwok et al., 1998). The idea of growing aerobic granules without carrier material on readily biodegradable substrates in SBR (Beun et al., 1999; Dangcong et al., 1999; Morgenroth et al., 1997) came from the research about the formation and storage polymers (Krishna and van Loosdrech et al., 1999; Van Loosdrecht et al., 1997). Granule formation was facilitated due to the conversion of readily biodegradable COD into a substrate yielding a lower maximal growth.
5
1.2.1.1 Mechanisms of aerobic granulation
Many factors including substrate composition, organic loading, hydrodynamic shear force, feat-famine regime, feeding strategy, dissolved oxygen (DO), reactor configuration, solids retention time, cycle time, settling time, and exchange ratio, would influence the formation and properties of aerobic granules developed in SBR as Liu and Tay (2004) noted. Nevertheless, these parameters should be associated with selection pressures on the sludge particles to be able to form aerobic granules.
In SBR, two major selection pressures had been identified, i.e. the settling time and the volume exchange ratio (McSwain et al., 2004; Qin et al., 2004a, b; Hu et al., 2005; Liu et al., 2005a; Wang et al., 2005a), while Arrojo et al. (2004) and Wang et al. (2005a) further showed that the discharge time of SBR would be the third most important selection pressure of aerobic granulation.
Liu and Tay et al. (2002a) showed a generic four-step formation process for aerobic granulation:
Step 1: Physical movement to initiate bacterium-to-bacterium contact by following forces:
o Hydronamic force; o Diffusion force; o Gravity force;
o Thermodynamic forces;
o Cell mobility, cells can move by means of flagella, cilia or pseudopods.
Step 2: Initial attractive forces to keep stable bacterium-bacterium contact, including:
o Physical forces
Van der Walls forces; Opposite charge attraction Thermodynamic forces Hydrophobicity
Cross-link or bridge of individual bacteria by filamentous organisms
6 o Chemical forces
Hydrogen liaison
Formation of ionic pairs Formation of ionic triplet
Interparticulate bridge and so on o Biochemical forces
Cellular surface dehydration Cellular membrane fusion
Step 3: Microbial forces to mature aggregated bacteria o Production of extracellular polymers;
o Growth of cellular cluster;
o Metabolic change and genetic competence induced by environment.
Step 4: Stable three-dimensional structure of microbial granules shaped by hydrodynamic shear forces.
1.2.1.1.1
Role of extracellular polymeric substances (EPS)
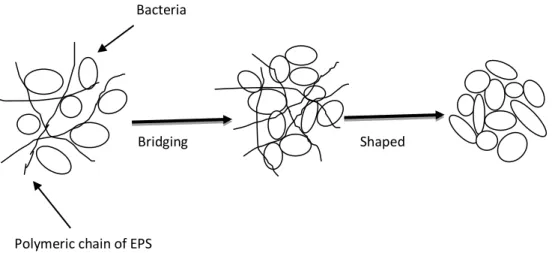
EPS are sticky materials secreted by cells, and may play an important role in cell adhesion phenomena, formation of matrix structure, microbial physiology, and improvement of long-term stability of granules (Schmidt and Ahring, 1994; Tay et al., 2001c; Liu et al., 2004b; McSwain et al., 2005). The accumulation of EPS as capsular material and peripheral slime has been correlated with biological adhesion and aggregation processes (Costerton et al., 1981; Tay et al., 2001c; Liu et al., 2002). The metabolic blocking of exopolysaccharide synthesis was found to prevent microbial aggregation (Cammarota and Sant’Anna, 1998; Yang et al., 2004). EPS in granules were hypothesized to bridge two neighboring bacterial cells physically to each other as well as with other inert particulate matter, and settle out as aggregates (Figure 2) (Liu et al., 2004b).
7
Figure 2. Schematic representation of extracellular polymeric substance-enhanced biogranulation
Extracellular polysaccharide matrices surrounding aggregated bacteria can provide sites available for attraction of organic and inorganic materials (Yu et al., 2001; Sponza, 2002; Liu et al., 2004b).
1.2.1.2 Structure of aerobic granules
The features of aerobically grown microbial granules, which are used in wastewater treatment, are as follows:
Spherical or ellipsoidal shape;
Size from 0,2 to 7mm;
Filamentous, smooth, or skin-like surface, which is dominantly hydrophobic or hydrophilic;
Gel-like interior (matrix);
Layers and microaggregates of specific microorganisms;
Channels and pores;
Inclusions of particulates.
Shaped Bridging
Polymeric chain of EPS
hain oBridging f EPS Bacteria Polymeric chain of EPS Bridging eria
8
1.2.1.2.1
Radial structures in granule
Arrangement of granule components as radial aggregates, spherical sub-granules, and concentric layers are an important structural property of microbial granules. Depth, thickness, and arrangement of these components can affect the formation, stability and activity of the granules (Ivanov et al., 2006).
In spherical granular biofilm, ammonia-oxidizing bacteria (AOB) were arranged in radially elongated aggregates within a layer with a depth from 70 to 100 µm from the surface of the biofilm (Tay et al., 2002a; Ivanov et al., 2005a, b).
Formation of radial aggregate of nitrifying bacteria in a direction that is normal to the granule surface could be due to the co-existence of steep oxygen gradient and reverse ammonia gradient created by release of ammonia from the central core of the granule where biomass is lysed. The decreasing widths of these nitrifying aggregates show the dependence of growth rate on the available concentration of DO and ammonia.
Cells of AOB are often arranged in the laminar biofilms as microbial colonies embedded in slime attached to a carrier surface (Okabe et al., 1999).
1.2.1.3 Conversion processes in aerobic granules
The mechanisms for nutrient removal with aerobic granular sludge are basically the same as used in activated sludge treatment. However, the main difference is that it does not occur in different tanks, but simultaneously in different zones inside the granules (De Kreuk et al., 2006).
To achieve stable, dense and smooth formation of aerobic granules it is necessary to decrease the growth rate of the organisms involved. A system with a feast-famine regime and feed with readily biodegradable substrate, so they can be stored as PHB, is a way to reach that granule formation. An aerobic feast phase induces the growth of heterotrophic organisms. During famine period the organisms use the stored substrates for growth and maintenance.
The distribution of heterotrophic and autotrophic organisms in the granule has an important role in simultaneous nitrification/denitrification. Since the concentration of external carbon is high during the feast period, it will diffuse into the granule
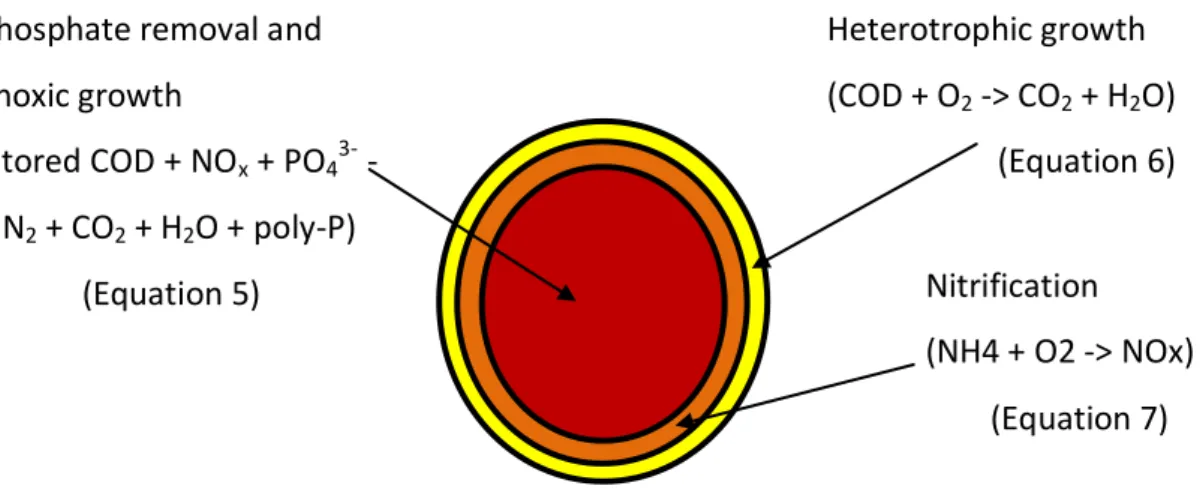
9 completely and will anaerobically (PAO), aerobically and anoxically be stored (Figure 3).
The autotrophic organisms exist in the outer layers of the granule so they can use the O2. Ammonium conversion to nitrate is processed in these layers. The resultant
nitrate can penetrate into the granule so denitrification can occur using the stored substrates as a carbon source. Optimal N-removal in the system will occur when the aerobic and anoxic volume are well balanced throughout the aeration period (Beun et al., 2001).
1.3 The Research
The study performed on thesis was developed in the lab from the department of environmental biotechnology of TU Delft, Delft, Netherlands. It had the duration of 5 months where the “effect of protein in the granular sludge” was studied.
This thesis has four chapters:
Chapter 1, Introduction. In this chapter the state of art is shown followed by literature review of the concepts, the objectives of the study and the incentives.
Chapter 2, Material and methods. Where is described how the analysis where performed and how the experience was conducted.
Chapter 3, Results. The results of the study are shown in this chapter. Phosphate removal and
anoxic growth (stored COD + NOx + PO43- -> N2 + CO2 + H2O + poly-P) (Equation 5) Nitrification (NH4 + O2 -> NOx) (Equation 7) Heterotrophic growth (COD + O2 -> CO2 + H2O) (Equation 6)
10
Chapter 4, Discussion. The discussion of the results obtained.
Chapter 5, Conclusions. Conclusions of the experiment are exposed. In the next point “Research introduction”, the incentives and objectives are described.
1.3.1 Research introduction
Slowly and particulate biodegradable substrates (protein, starch, etc..) form an important fraction of industrial wastewater and sewage (De Kreuk et al., 2010). For example, in The Netherlands, 50% of the influent COD in municipal WWTP’s comes from this kind of substrate.
De Kreuk studied the effect of starch as 100% of the influent COD but there is still a lack of information about protein (another slowly and particulate biodegradable substrate) influence in waste water treatment. Waste water with high protein concentration can be provided by diary industries, among others. Protein was chosen to be the model substrate of this study in order to forecast problems from possible discharges performed by this kind of industries.
When aerobic granular sludge technology is to be applied in sewage treatment, nutrient removal (COD, N and P) will be very important.
It is important to extend our knowledge of protein degradation and the microorganisms involved because the amino acids resulting from protein hydrolysis are important carbon and energy sources for poly-P-accumulating organisms, which are not only responsible for P-removal, but are also involved in N-removal via denitrification (Kong et al., 2004, 2005).
Part of the organic carbon can be directly oxidized by heterotrophic organisms using nitrite/nitrate or oxygen, or be assimilated to new biomass. The large molecules of particulate, slowly and colloidal biodegradable COD must be hydrolyzed first extracellularly before the bacteria can use it for their metabolism. Heterotrophic growth is often limited by the much slower process of hydrolysis (Dold et al., 1980; Orhon and ÇokgÖr, 1997; San Pedro et al., 1994). Microbial hydrolysis is the essential step in the degradation of organic matter in WWTP’s, and it is often the rate-limiting
11 step for processes related to nitrogen and phosphorus removal (Dueholm et al., 2001; Morgenroth et al., 2002).
In literature there is a restricted number of publications related to the waste water treatment (sewage or industrial effluent) containing complex substrates. In this study some problems were expected due to work performed by De Kreuk et al. (2010) in which used 100% particulate starch as influent COD.
The appearance of irregular filamentous in the granules surface due to starch hydrolysis, the increase of suspended solids in the bulk liquid, the bloom of protozoa and metazoans, were problems detected in their study.
Similar problems were expected in this research: (i) irregularity granules with filamentous growth; (ii) lower SND conversions; (iii) small particles in the bulk liquid; and (iv) decreased sludge age. P-removal efficiency seems to be most of the time neglected but it is part of the aim of this study. To better study the effect of protein on aerobic granular sludge the protein concentration as influent COD was increased stepwise to 40% and later on to 80% but this study only focus mainly on 20% of protein.
Nutrients conversions, granule morphology and PAO/GAO population changes by FISH were analyzed.
12
2. Materials and Methods
2.1 Reactor Set-up and operation
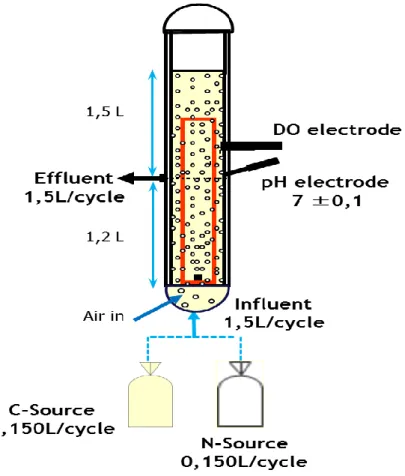
The experiments were performed in a double walled 3-litre SBAR was used with an internal diameter of 6,25 cm. Air was introduced via a fine bubble aerator at the bottom of the reactor with 4 L min-1 flow (upflow gas velocity 2,4 cm/s) to achieve mixing (Figure 4).
DO concentration was measured online with an electrode and controlled via the off-gas recycle as a percentage of the saturation. By recirculation of the gas through the reactor and dosage of extra air of N2 gas, the oxygen concentration could
be controlled. During the start-up, the DO was kept at 20% (2 mg O2 L-1). After 31 days
of operation the DO was increased to 40% (3,6 mg O2 L-1) to enhance N-removal and
obtain full nitrification (NH4+-N ≈ 0 mg/L). The pH was maintained at 7,0 ± 0,1 by
dosing 1 NaOH or 1 M HCl only during the aeration phase. The reactor was at room temperature ± 20ºC.
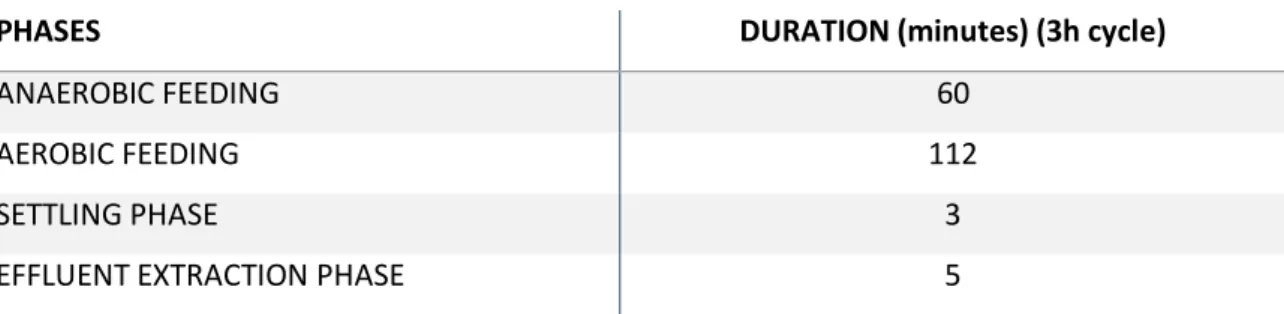
13 The reactor was operated in successive cycles, 3 hours long each, following an anaerobic feast, aerobic famine regime, settling phase and effluent extraction phase.
During the first hour the reactor was fed via plug-flow under anaerobic conditions, allowing the substrate accumulating bacteria to store metabolites. Afterwards, approximately 112 minutes of aeration followed, during which no substrate was fed into the reactor. At the end of the cycle, aeration was stopped and the biomass was allowed to settle during 3 minutes before the effluent was extracted via a valve at the bottom, leaving 1,2 L in the reactor (Table 1).
Table 1. Timing of one cycle:
The reactor was inoculated with activated sludge from waste water treatment plant with EBPR activity.
This re research studies the protein influence in: (i) aerobic granular formation and stability; (ii) related processes as COD, phosphate (PO43-) and N-removal; and (iii)
glycogen accumulation organisms (GAO) and phosphate PAO populations.
In the start-up the C-medium contained 100% of acetate of the total COD and after 50 days of operation the C-medium was changed to a composition in which 80% of the COD was present in the form of the acetate (readily biodegradable substrate) and the other 20% of COD contribution was provided by the soy protein (slowly and particulate biodegradable substrate).
PHASES DURATION (minutes) (3h cycle)
ANAEROBIC FEEDING 60
AEROBIC FEEDING 112
SETTLING PHASE 3
14
2.2 Influent medium
The used synthetic wastewater consists in 2 media. The influent media were separated in a carbon source (Medium 1: C-source Sodium Acetate (NaAc) 63 mM, MgSO4.7H2O 3,6 mM and KCl 4,7 mM) and a nitrogen source (Medium 2: N-source
NH4Cl 42,6 mM, KH2PO4 2,1 mM, K2HPO4 4,2 mM and 9,6 mL L-1 trace element solution
(trace element solution taken from Vishniac and Santer, 1957).
The Vishniac preparation, EDTA.H2.Na2.2H2O – 100g, 2- FeSO4.7H2O – 9,98 g,
ZnSO4.7H2O – 4,4 g, CaCl2.2H2O – 16,36g, MnCl2.4H2O – 10,12g, Na2MoO4.2H2O –
4,36g, CuSO4.5H2O – 3,14g, CoSO4.7H2O – 3,22g and 2L of distilled water. The EDTA
was dissolved completly in 1L of distilled water and then was setted the pH to 6 with KOH pellets. FeSO4.7H2O was added to the solution and completely dissolved before
adding KOH dand once again to adjust the pH to 6. The remaining compunds were added one by one after the previous compoud being completely dissolved and after adding the last one, the pH was setted to 4 with KOH pellets. To adjust the volume to 2L, distilled water was added.
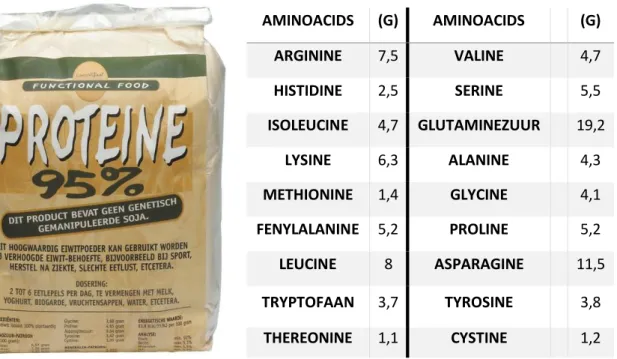
From both media, 150 mL per cycle was dosed together with 1200 mL tap water. The composition of the C-source was changed after 50 days of operation and the NaAc contribution of COD was switched to 80% and the remaining COD contribution, 20%, was substituted by soy protein. This changed the concentration of NaAC to 50,3 mM and added 0,23 mM of soy protein to the C-source. Later on COD contribution from protein was changed to 40% of the total influent COD.The protein used in this study it was a regular soy protein that can be bought in shops (Figure 5).
15
Figure 5. Soy protein used in this study.
2.3 Measurements
The analysis are divided in continuous measurements (online), daily to weekly measurements, some other less frequent measurements and the cycle measurements. The DO, pH-Control, influent addition of the reactor were followed on-line with Microsoft Foundation Classes Software (MFCS). Total suspended solids, volatile suspended solids, ash content of the granules and biomass concentration were determined as described in De Kreuk et al. (2005a). COD, PO43- -P, NH4+-N, NO2--N, NO3
--N concentrations in the bulk liquid were determined spectrophotometrically by using standard test kits (Dr. Lange type LCK; manufacturer: Hach Lange, Düsseldorf, Germany)(Figure 6). AMINOACIDS (G) AMINOACIDS (G) ARGININE 7,5 VALINE 4,7 HISTIDINE 2,5 SERINE 5,5 ISOLEUCINE 4,7 GLUTAMINEZUUR 19,2 LYSINE 6,3 ALANINE 4,3 METHIONINE 1,4 GLYCINE 4,1 FENYLALANINE 5,2 PROLINE 5,2 LEUCINE 8 ASPARAGINE 11,5 TRYPTOFAAN 3,7 TYROSINE 3,8 THEREONINE 1,1 CYSTINE 1,2
Table 2. Soy protein compounds:
16 Next to periodic measurements after the feeding phase at t=60 minutes and after the famine phase at t=180 minutes, a number of cycle measurements were performed. This showed the development of the SND and COD removal over time. The process of granulation was followed by using of a Leica stereozoom microscope.
FISH was performed on samples taken from the reactor. This way, an impression of the development of the microbial environment could be acquired. Probes used to detect the presence of PAOs, GAOs, EuB (Bacteria) were used: PAO 462 (CCGTCATCTACWCAGGGTATTAAC), GAO Q431 (TCCCCGCCTAAAGGGCTT), EUB 338 I (GCTGCCTCCCGTAGGAGT).
Several batch tests were executed to study the hydrolysis of protein. An HEPES buffer was used to keep the pH stable during the test. It was dosed 200mL to a vessel, together with a known concentration and volume of granular sludge. The vessels were sparged with pressurized air (aerobic conditions) or N2 gas (anaerobic conditions).
To measure the protein it was used a BC Assay Protein kit from Uptima. Cycle tests were performed in order to follow the conversion rates during the aeration phase.
17
3.
R
ESULTSThe reactor start-up was performed using 100% of NaAc as carbon source. Weakly measurements, FISH, Leica stereozoom microscope, batch and cycle tests were executed in order to follow nutrient conversions, granule morphology and PAO and GAO populations.
The start-up was running for 50 days until stable conditions were achieved. The reactor started with 20% DO concentration and later was switched to 40% so full nitrification (NH4+-N ≈ 0 mg/L) could be reached. In the end of the start-up the nutrients removal efficiencies were: (i) N-removal 76% with no ammonia in the effluent; (ii) P-removal 96%; (iii) COD removal 100%. The granules showed rounded shape and PAO, GAO populations were, more or less, with the same population size.
After adding soy protein as 20% of the influent COD, the system was followed showing the next results.
3.1 Granule morphology
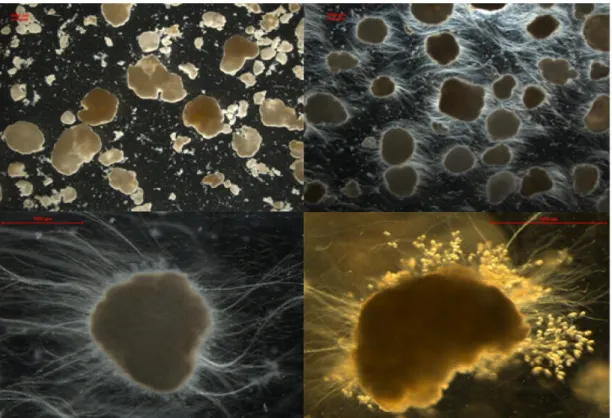
Figure 8. (A) Granular sludge taken before adding soy protein, 7,8x, stereozoom (15-04-2013, day 41); (B) Granular sludge taken 20 days after adding soy protein, 7,8x, stereozoom (14-05-2013, day 70); (C) Filamentous granule, 39,4x, stereozoom (14-05-2013, day 70); (D) Vorticella spp. growing on the out layer of the granule, 56.6x stereozoom (22-06-2013, day 108). All red bars represent 1000µm.
Effect of protein in aerobic granular sludge
18 Adding soy protein to the influent caused filamentous growth in the outermost layer of the granule (Figure 8). The particulate substrate gradually increased the number of sessile ciliates (e.g. Vorticella spp.) and rotifers at the surface of the granules (Figure 8(D)).
The presence of these organisms greatly contributes to the good effluent quality seen on real wastewater (<15 mg/L suspended solids).
The filamentous growth in the outermost layer of the granule did not influence their settling time. In the bulk liquid from the reactor started to appear small suspended and fluffy particles. These suspended particles were coming from the protein and also due to the shear stress during the reactor operation that broke some of the filaments. The granules became smaller.
In fact, after day 70, particulate suspended and fluffy solids started to disappear from the bulk liquid resulting also in a clear effluent. In the end of the experiment, around day 105, the granules were showing fewer filaments and when a stereozoom microscope was used to visualize their shape it was noticed the decreasing of the filaments structures and an increase of Vorticella spp. population attached to the granules (Figure 8(D)).
19
3.2 Reactor performance
3.2.1 Nitrogen removal
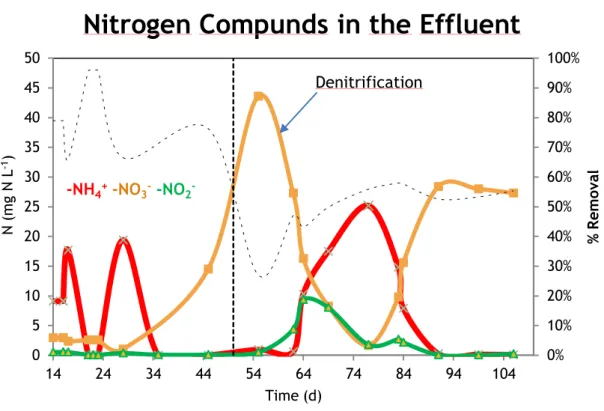
N-removal efficiency in the end of the start-up fluctuated between 70% and 80%, showing full nitrification (NH4+ - N in the effluent almost 0 mgL-1). After the DO
concentration being changed to 40% (day 31) and, full nitrification was reached. Nitrate (NO3-) concentration in the effluent started to increase, showing that
denitrification was inhibited (Figure 9).
At day 50, soy protein was added to the C-source and the first measurement performed (after 5 days) showed a decrease in N-removal efficiency to 27%. This was due to high nitrate concentration (43,6 mg N/L). Full nitrification stopped and nitrite concentration in the effluent started to increase followed by nitrate, which began to decrease.
At day 74, N-removal efficiency reached 55% due to good denitrification (nitrate and nitrite concentration almost 0 mg N/L) but bad nitrification performance.
0% 10% 20% 30% 40% 50% 60% 70% 80% 90% 100% 0 5 10 15 20 25 30 35 40 45 50 14 24 34 44 54 64 74 84 94 104 % R emo va l N ( m g N L -1) Time (d)
Nitrogen Compunds in the Effluent
Denitrification
-NH4+-NO
3- -NO2
-Figure 9. Nitrogen compounds concentrations in the effluent.
The horizontal broken curved line is related to total N-percentage removal and the vertical broken line represents the time when protein was dosed.
20 This day was the turning point because afterwards full nitrification was once again achieved, nitrite concentrations was also vestigial and nitrate reached a stable concentration fluctuating between 28-29 mg N/L, with a N-removal efficiency rate at the end of the study, of 55%.
3.2.2 Phosphate removal
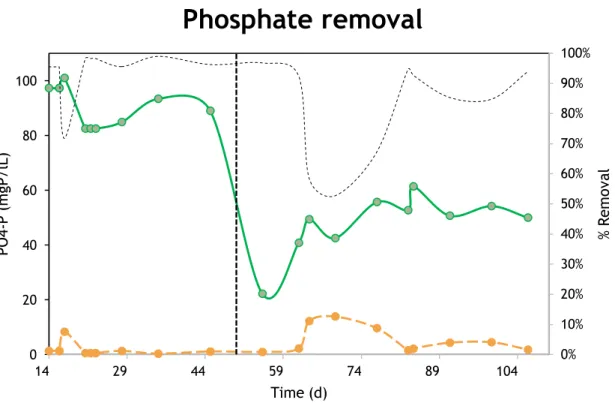
At the end of the start-up, P-removal efficiency was oscillating between 96% and 98%.
When protein was dosed at day 50, the first change noticed was a decrease in phosphate concentration after feeding, indicating a PAO deficiency to accumulate phosphate (Figure 10). The removal efficiency continued, roughly, the same until day 69, when it was registered high phosphate concentration in the effluent (13,6 mg P/L), resulting in a decrease of removal efficiency from 98% to 53%.
After this day, the next measurements performed showed a decrease on effluent phosphate concentration and a higher phosphate release during feeding
0% 10% 20% 30% 40% 50% 60% 70% 80% 90% 100% % R em ov al PO 4-P (m gP /l L) Time (d)
Phosphate removal
Figure 10. Phosphate removal.
The green line represents the PO43- measured after feeding, and the orange line is related to PO43- in the
effluent. The broken curved line is related to % removal and the horizontal broken line represent the time when protein was dosed.
21 phase, followed by removal efficiency increase. At the end of the study the same removal efficiency (98%) was achieved, with tendency to increase.
3.2.3 COD removal
Before adding the protein, COD removal efficiency was 100% and COD concentrations after feeding were showing values between 26,7 and 36,5 mg/L.
When the protein was added to the C-source small and fluffy particles appeared in the bulk liquid and, at the end of the cycle, these particles were washed out to the effluent. Due to this fact, COD removal efficiency decreased.
HPLC measurements were performed and acetate was registered right after feeding phase.
The highest COD concentration after feeding was registered in the first measurement performed, showing 83,0 mg/L. The next measurements revealed a decrease in this value and the last measurement performed showed a 46,3 mg/L.
Around day 74 the small and fluffy particles started to disappear from the bulk liquid, showing a clean effluent with no protein (Figure 11) and 100% COD removal was reached.
A
B
C
D
22
3.2.4 Protein degradation
Protein degradation was tried to be followed using a BC Assay Protein kit from Uptima.
The results from the kit were registered using the spectrophotometer (Dr. Lange type LCK; manufacturer: Hach Lange, Düsseldorf, Germany) and the absorption was read at 562nm.
When samples were taken from the reactor it was not used a filter, otherwise all protein would be filtered. However, it was found to be impossible to measure it due to the difficulty of separating the protein from the biomass and some of the protein could be absorbed and adsorbed by the granules, degraded and converted in amino acids, providing inconclusive results. Efforts to try to measure protein degradation were in vain, thus this topic was neglected.
The results showed an increase of protein during the cycle what led protein degradation aside.
23
3.2.5 FISH analysis
Pictures from GAO and PAO populations were taken to follow their development and protein influence was tested using FISH method (Figure 12) and (Figure 13).
Figure 12. FISH pictures 40x, day 18 (22-03-2013). Different date pictures from Eubacteria, PAO and GAO, white and black picture and fluorescence pictures showing GAO (green), PAO (red) and Eubacteria (Purple). All bars represent 20 µm.
24
Figure 13. FISH pictures 40x, day 93 (07-06-2013). Different date pictures from Eubacteria, PAO and GAO, white and black picture and fluorescence pictures showing GAO (green), PAO (red) and Eubacteria (Purple). All bars represent 20 µm.
In the start-up both populations were, approximately, in same number. After adding protein, the number of GAO cells started to decrease, filamentous bacteria appeared and it was noticed a shift of PAO I to PAO II (Figure 14).
25
Figure 14. (1) FISH 40x, day 18 (22-03-2013); (2) FISH 40x, day 71 (15-05-2013); (3) FISH 40x, day 104 (18-06-2013); (4) Filamentous bacteria day 90 (4-6-2013). (1),(2),(3) FISH pictures from shift evolution of PAO I (red) to PAO II (green), and (4) white and black picture from filamentous bacteria. All bars represent 20 µm except (4) that is 10 µm.
1
2
26
4. D
ISCUSSIONDuring this study it was shown that granules need some time to adapt to protein. The system needed around one month to get adapt and after this time good nutrient conversions rates were reached.
Protein hydrolyzation is an anaerobic and aerobic process and in an aerobic system occurs outside the granule consuming the O2 available. This process breaks the
peptide bonds resulting in amino acids and/or volatile fatty acids and/or PHB.
The increase of Protozoa growth is also responsible for the lack of protein in the effluent. Protozoa are known to filter water resulting in less suspended solids in the effluent (De Kreuk et al., 2010). Nevertheless this contribution was not quantified.
The appearance of filamentous bacteria can also be responsible for this process. It was not identified yet what kind of species it is but is reported in Nielsen et al. (2002), a filamentous bacteria called Microthrix parvicella that is known to be the responsible for uptake and storage of long chain fatty acids (LCFA) during aerobic conditions and it is able to take up and store organic matter under anaerobic conditions (short chain fatty acids and glucose, but not LCFA) and subsequently use the storaged material for growth with nitrate or oxygen as electron acceptor (Nielsen et al., 2002).
4.1 Influence of protein on granule morphology
The slowly and particulate biodegradable substrate (protein) favoured the growth of filamentous on the surface granule. The filamentous organisms have a higher outgrowth velocity due to their preferential growth in one direction, instead of three directions as floc-forming bacterial structures (Martins et al., 2003, 2004). The possible causes of filamentous growth are identified and included: long retention times of solids, low substrate concentration in the liquid phase, high substrate gradient within the granule, DO deficiency in the granule, nutrient deficiency inside the granule, temperature shift and flow patterns (Yu Liu et al., 2005).
In this study the overall solid retention time (SRT) or sludge age dropped, the loose cells were very young but granules not. The top of bed was very low in SRT, while the bottom was very high.
27 Due to the protein hydrolysis outside the granule, the O2 availability for aerobic
processes such as nitrification and heterotrophic growth decreased. The O2 depth
decrease inside the granule made the organisms compete for O2 and consequently the
filamentous growth because they gain advantage since they can grow further the outermost layer of the granule.
Produced substrate is consumed locally, enhancing substrate gradients inside the granules, and this stimulating the outgrowth of filamentous structures. The higher accumulation of starch on the tips of the finger-like structures has further enhanced this phenomenon of irregular substrate uptake over the granule (De Kreuk et al., 2010). This information from De Kreuk, from their study with starch, shows what happened with the protein. Nevertheless, with 20% protein of influent COD, the filamentous growth did not create irregularities on the granules.
One hypothesis is if we add low slowly biodegradable substrate concentrations to the influent, the granules will have time to adapt. In this study more or less one month after adding protein the granules started to show less size of filamentous that could only be seen with a stereozoom microscope.
Even with long filamentous growth, the settleability was not influenced and the granules remained with the same settling time. However, during the first month after adding protein, the bulk liquid showed the presence of small and fluffy particles suggesting that the protein degradation was not occurring properly. In addition, shear forces from the aeration increased these particles due to the filamentous break.
After some time running with 40% of influent COD from protein, the filamentous growth disappeared altogether pointing to complete hydrolysis during the anaerobic feeding and possibly the development of a specialized organism with this kind of substrate.
4.2 Influence of protein in nutrients removal
When protein entered into the system, it affected the N-removal. The last measurement performed during the start-up showed 80% of N-removal and the first measurement, after adding protein, revealed a decrease to 27% of N-removal, showing lower nitrification efficiency.
28 During the period in which the external substrate is available (feast period), oxygen is quickly consumed in the outer layers by growth, substrate storage and nitrification (De Kreuk et al., 2010). In the outermost layer and in the anoxic zone inside the granule, acetate is stored as PHB.
The oxygen penetration depth during the famine period was higher due to decrease of respiration rates of the heterotrophic organisms, but still limited due to increased nitrification relatively to the feast phase (Third et al., 2003). It was expected that protein hydrolysis would influence this process due to the consumption of the oxygen surrounding the granule which caused lower oxygen availability to aerobic processes such as heterotrophic growth and nitrification. Furthermore, the fast aerobic growth on the protein could overgrow the slower growing nitrifiers and PAOs.
During the start-up, DO concentration was changed to 40% to achieve full nitrification (ammonia effluent concentration ≈ 0 mg/L). After reaching full nitrification was reached it was noticed an increase of nitrate concentration due to a higher O2
availability in the system, which decreased the denitrification process. O2 depth inside
the granule increased which made the anoxic zone, where denitrification occurs, lose volume and, consequently, nitrate removal decreased.
Right after adding protein nitrate effluent concentrations reached the higher value of 43.6 mg N/L, showing the difficulty of the organisms to convert nitrate.
After this point, a gradually increase of nitrite and ammonia in the effluent was noticed, followed by a decrease of nitrate.
The AOB, the responsible of the conversion of NH4+ to NO2-, and
nitrite-oxidizing bacteria (NOB), the responsible of the conversion of NO2- to NO3-, uses the O2
to perform their conversion process (Nitrification).
Since protein hydrolysis occurred outside the granule and need oxygen, the decrease of oxygen depth inside the granule suppressed AOB and NOB activity and consequently nitrification (Figure 15). This provided good denitrification conditions, since the anoxic zone increased.
29 This nitrification deficiency could be seen during 27 days and at day 77 the worst nitrification results were obtained. Even with lower nitrification efficiency the N-removal increased to 56% as a result of good denitrification efficiency due to higher anoxic conditions.
During this period O2 was taken by filamentous growth, inhibiting the nitrifiers.
Once the filamentous bacteria have stabilised, the nitrifiers could grow towards the oxygen again.
The result of this hypothesis, together with protozoa and rotifers filtering the bulk liquid and the protein being degraded faster, changed the system again.
Oxygen availability became higher, filamentous started to decrease their size, O2 penetration depth increased and, at day 91, full nitrification was once again
achieved and nitrate effluent concentration increased to a stable value of ± 28 mg N/L resulting in a N-removal efficiency of 55%.
P-removal efficiency was also affected and decreased, from an average 98% in the start-up, to 56% after adding protein. There was a difference in this removal decrease because it was noticed 15 days after the end of the start-up. The first impact shown in phosphate was the concentration decrease after feeding phase, showing the difficult release of phosphate during this phase. This was due to medium change, which reduced the acetate concentration, therefore leaving acetate for PAO. The slow decrease it is probably due to protein/filamentous.
30 Since HPLC measurements revealed the presence of acetate right after feeding (t=61 minutes), it was easy to understand that acetate uptake and storage as PHB during anaerobic phase suffered an inhibition, followed by a lower phosphate release.
This provided incapacity of P-removal during the aerobic phase, resulting in higher phosphate effluent concentrations.
Around day 85, the acetate uptake during anaerobic phase started to gradually increase, showing higher phosphate release and phosphate effluent concentration got to lower values.
In the end of the study P-removal efficiency was 94%, showing good adaptation to the protein.
Slowly and particulate COD in the influent, after the system gets adapted, can be completely removed. The increase of protozoa (mainly Vorticella spp.) and rotifers were the main responsible for filtering and cleaning the bulk liquid with particulate substrate (protein), resulting in a good effluent quality.
It seems that the slowly biodegradable (particulate) substrate in the influent of an AGS reactor is removed by adsorption at the granule surface, after which it is hydrolysed and hydrolysis products are consumed by the bacteria (De Kreuk et al., 2010).
Completely COD removal was achieved in the end of the study, resulting in an effluent with no protein.
GAO suffered a decrease in their number making PAO the dominant organisms inside the granule, showing PAO higher capacity to compete for the organic substrate.
The shift of PAO I to PAO II is responsible for lower denitrification efficiency since PAO I have the ability of nitrate reduction.
31
5. C
ONCLUSIONSSlowly and particulate substrate (soy protein) in the influent is proven to be removed by the adsorption at the granule surface, where it is hydrolysed and later on the products of this process are digested by bacteria. Slowly biodegradable substrate hydrolysis cause filamentous growth in the granule surface.
Nutrient removal efficiency decreases when soy protein is added to the influent substrate and causes an excessive bloom of small and fluffy particles in the bulk liquid. This problem is solved after granules adaption to the protein. After a period of adaptation, nutrient removal efficiency increases, showing 100% COD removal, 94% phosphate removal, full nitrification and 55% of N-removal.
An increase of Protozoa and rotifers provided a fraction of the suspended solids removal giving contribute to a good effluent quality.
With not enough information about how it happened, GAO population suffered a decrease, representing at the end of this study only 10% of the total GAO and PAO population. There is also not enough information about the shift from PAO I to PAO II.
32
6. R
EFERENCESArrojo, B., Mosquera-Corral, A., Garrido, J.M., Mendez, R., 2004. Aerobic granulation with industrial wastewater in sequencing batch reactors. Water. Res. 38 (14e15), 3389-3399.
Beun, J.J., Hendriks, A., van Loosdrecht, M.C.M., Morgenroth, M., Wilderer, P.A., Heijnen, J.J., 1999. Aerobic granulation in a sequencing batch reactor. Water. Res. 33 (10), 2283-2290.
Beun, J.J., Van Loosdrecht, M.C.M., Heijnen, J.J., 2001. N-removal in a Granular Sludge Sequencing Batch Airlift Reactor. Biotechnol. Bioeng., 75 (1), 82-92.
Beun, J.J., Van Loosdrecht, M.C.M., Heijnen, J.J., 2002. Aerobic granulation in a sequencing batch airlift reactor. Water Res. 36 (3), 702-712.
Blackburne, R., Yuan, Z., Keller, J., 2008. Partial nitrification to nitrite using low dissolved oxygen concentration as the main selection factor. Biodegradation 19(2): 303-312.
Cammarota, M.C., Sant'Anna, G.L., 1998. Metabolic blocking of exopolysaccharides synthesis: effects on microbial adhesion and biofilm accumulation. Biotechnol. Lett., 20, 1-4.
Costerton, J.W., Irvin, R.T., Cheng, K.J., 1981. The bacterial glycocalyx in nature and disease. Annu. Rev. Microbiol., 35, 299-324.
Dangcong, P., Bernet, N., Delgene, J.-P., Moletta, R., 1999. Aerobic granular sludge- a case resport. Water Res. 33(3), 890-893.
De Kreuk, M.K., Van Loosdrecht, M.C.M., 2004. Selection of slow growing organisms as a means for improving aerobic granular sludge stability. Water. Sci. Technol. 49 (11e12), 9e19.
33 De Kreuk, M.K., Heijnen, J.J., Van Loosdrecht, M.C.M., 2005a. Simultaneous COD, nitrogen and phosphate removal by aerobic granular sludge. Biotechnol. Bioeng. 90 (6), 761e769.
De Kreuk, M.K., Pronk, M., Van Loosdrecht, M.C.M., 2005b. Formation of aerobic granules and conversion processes in an aerobic granular sludge reactor at moderate and low temperatures. Water. Res. 39 (18), 4476-4484.
De Kreuk, M.K., Van Loosdrecht, M.C.M., 2006. Formation of aerobic granules with domestic sewage. J Environ Eng e ASCE 132 (6).
De Kreuk, M.K., Kishida, N., Van Loosdrecht, M.C.M., 2007. Aerobic granular sludge e sate of the art. Water. Sci. Technol 55 (8e9), 75-81.
Dold, P.L., Ekama, G.A., Van Marais, G.R., 1980. A general model for the activated sludge process. Progr. Water. Technol 12 (6), 47-77.
Flowers, J.J., He, S., Yilmaz, S., Noguera, D.R., McMahon, K. D., 2009. Denitrification capabilities of two biological phosphorus removal sludges dominated by different "Candidatus Accumulibacter" clades. Environ Microbiol. Rep. 1(6): 583-588.
Gieseke, A., Purkhold, U., Wagner, M., Amann, R., Schramm, A., 2001. Community structure and activity dynamics of nitrifying bacteria in a phosphate-removing biofilm. Appl. Environ. Microbiol. 67(3): 1351-1362.
Heijnen J.J., Van Loosdrecht, M.C.M., 1998. Method for acquiring grain-shaped growth of a microorganism in a reactor. US, European patent patent WO 88/37027.
Hu, L., Wang, J., Wen, X., Qian, Y., 2005. The formation and characteristics of aerobic granules in sequencing batch reactor (SBR) by seeding anaerobic granules. Process Biochem., 40, 5-11.
34 Ivanov, V., Tay, J.-H., Tay, S.T.-L., Tay, H.-L., Jiang, R., 2004. Removal of micro-particles by microbial granules used for aerobic wastewater treatment. Water Sci. Technol., 50 (12), 147-154.
Ivanov, V., Tay, S.T.-L., Liu, Q.-S., Wang, X.-H., Wang, Z-.W., Tay, J.-H., 2005a. Formation and structure of granulated microbial aggregates used in aerobic wastewater treatment. Water Sci. Technol., 52 (7), 13-19.
Ivanov, V., Tay, J.-H., Liu, Q.-S., Wang, X.-H., Wang, Z-.W, Maszenan, A.M., Yi, S., Zhuang, W.-Q., Liu, Y.-Q., Pan, S., Tay, S.T.-L., 2005b. Microstructural optimization of wastewater treatment by aerobic granular sludge. Aerobic Granular Sludge, Water and Environmental Management Series, 43-52.
Krishna, C., Van Loosdrecht, M.C.M., 1999. Effect of temperature on storage polymers and settleability of activated sludge. Water Res. 33(1), 2374-2382.
Kwok, W.K., Picioreanu, C., Ong, S.L., Van Loosdrecht, M.C.M., Ng, W.J., Hejnen, J.J., 1998. Influence of biomass production and detachment forces on biofilm structures in a biofilm airlift suspension reactor. Biotech. and Bioeng. 58(4), 400-407.
Lanham, A.B., Reis, M.A.M., Lemos, P.C., 2008. Defluviicoccus vanus related glycogen accumulating organisms kinetic and metabolic data. 4º European Bioremediation Conference.
Liu, Y., Tay, J.H., 2002. The essential role of hydrodynamic shear force in the formation of biofilm and granular sludge. Water Res., 36, 1653-1665.
Liu, Y., Tay, J.H., 2004. State of the art of biogranulation technology for wastewater treatment. Biotechnol. Adv., 22, 533-563.
Liu, Y., Xu, H.L., Show, K.Y., Tay, J.H., 2002. Anaerobic granulation technology for wastewater treatment. World J. Microbiol. Biotechnol., 18, 99-113.
35 Liu, Y., Yang, S.E, Liu, Q.S., Tay, J.H., 2003. The role of cell hydrophobicity in the formation of aerobic granules. Curr. Microbiol., 46, 270-274.
Liu, Y., Yang, S.E, Tay, J.H., Liu, Q.S., Qin, L., Li, Y., 2004a. Cell hydrophobicity is a triggering force of biogranulation. Enzyme Microb. Technol., 34, 371-379.
Liu, Y.Q., Liu, Y., Tay, J.H., 2004b. The effects of extracellular polymeric substances on the formation and stability of biogranules. Appl. Microbiol. Biotechnol., 65, 143-148.
Martins, A.M.P., Heijnen, J.J., Van Loosdrecht, M.C.M., 2003. Effect of feeding pattern and storage on the sludge settleability under aerobic conditions. Water. Res. 37 (11), 2555e2570.
Matsumoto, S., Katoku, M., Saeki, G., Terada, A., Aoi, Y., Tsuneda, S., Picioreanu, C., Van Loosdrecht, M.C.M., 2010. Microbial community structure in autotrophic nitrifying granules characterized by experimental and simulation analyses. Environ. Microbiol. 12(1): 192-206.
McSwain, B.S., Irvine, R.L., Wilderer, P.A., 2004. The influence of settling time on the formation of aerobic granules. Water Sci. Technol., 50, 195-202.
McSwain, B.S., Irvine, R.L., Hausner, M., Wilderer, EA., 2005. Composition and distribution of extracellular polymeric substances in aerobic flocs and granular sludge. Appl. Environ. Microbiol., 71, 1051-1057.
Morgenroth, E., Sherden, T., Van Loosdrecht, M.C.M., Heijnen, J.J., Wilderer, P.A., 1997. Aerobic granular sludge in a sequencing batch reactor. Water Res., 31, 3191-3194.
Mosquera-Corral, A., Montrás, A., Heijnen, J.J., Van Loosdrecht, M.C.M., 2003. Degradation of polymers in a biofilm airlift suspension reactor. Water Research 37, 485-492.
36 Nielsen, P.H., Roslev P., Dueholm, T.E., Nielsen, J.L., 2002. Microthrix parvicella, a specialized lipid consumer in anaerobic–aerobic activated sludge plants. Water Science and Technology 46 (2) 73–80.
Vazquez-Padin, J.R., Figueroa, M., Mosquera-Corral, A., Campos, J.L., Mendez, R., 2009. Population dynamics of nitrite oxidizers in nitrifying granules. Water Sci Technol 60(10): 2529-2536.