Comparative feeding behaviour of early larvae of sardine Sardina pilchardus (Walbaum, 1792) and anchovy Engraulis encrasicolus (Linnaeus, 1758)
89
0
0
Texto
(2) Universidade de Lisboa Faculdade de Ciências Departamento de Biologia Animal. Comparative feeding behaviour of early larvae of sardine Sardina pilchardus (Walbaum, 1792) and anchovy Engraulis encrasicolus (Linnaeus, 1758). Maria Luísa Pinto Ferreira Palma Ramalho. Dissertação Mestrado em Ecologia Marinha. Orientadores: Doutora Susana Garrido Professor Doutor Pedro Ré 2015.
(3) “If something is not impossible, there must be a way of doing it” – Nicholas Winton “What are men compared to rocks and mountains” – Jane Austen.
(4) Agradecimentos/Acknowledgements Ao projeto VITAL PTDC/MAR/111304/2009, designado por Taxas vitais de larvas de peixes pelágicos (VITAL) financiado pela Fundação para a Ciência e a Tecnologia, pela oportunidade de trabalhar nesta área de investigação. Gostaria de agradecer a todas as pessoas, que me ajudaram durante todo este percurso e contribuiram para a realização desta tese, nomeadamente: À Doutora Susana Garrido, por me fazer “partir pedra”, pela ajuda no melhoramento dos conteúdos desta tese, e me fazer ultrapassar os meus próprios medos e obstáculos, que me fizeram crescer, avançar e tornar mais independente tanto na escrita como no tratamento estatístico. Às bolseiras Carina, Ana Rita e Claúdia, que me acompanharam durante as experiências no Oceanário de Lisboa. À equipa do Oceanário de Lisboa, particularmente ao Hugo Batista e à Patricia Napier que sempre se mostraram disponíveis em ajudar e ao Carlos por todas as piadas pelos corredores. Ao Professor Doutor Pedro Ré, pelo interesse e apoio que demonstrou durante todo este percurso. Ao Professor Carlos Assis, pelo apoio constante e Professora Filomena Magalhães, pelo redespertar do ponto de vista (a ideia dos papers de estatística foi super).. À minha numerosa Família pelo apoio incondicional (e por vezes incompreensão) que me fez avançar ainda mais, para lhes mostrar como é este meu mundo. Farrusca, Caju e Fritz por vos poder agarrar e me darem alento (mesmo que não se tenham apercebido). Tenho a felicidade de ter grandes tesouros como amigos que me apoiaram ao longo deste ano e que, mesmo sendo (em alguns casos) de áreas completamente diferentes, quiseram ouvir e estar comigo durante este percurso. Obrigada por terem aparecido e querido ficar, mesmo nas alturas mais sombrias. Obrigada pelos vossos risos, alegria e companhia constante!. i.
(5) To the VITAL project PTDC/MAR/111304/2009, designated “Vital rates of pelagic fish larvae” funded by the Fundação para a Ciência e a Tecnologia, for the opportunity to work on this area of investigation. I would like to express my thank you to all the people that helped me throughout this journey and contributed to the realization of this thesis, particularly: To Dr. Susana Garrido, for the help in improving this thesis, making me surpass my fears and my own obstacles, which allowed me to grow, progress and become more independent, both in writing as well as in the statistical analysis. To Carina, Ana Rita and Claúdia grant holders that accompanied me throughout the experiments in Oceanário de Lisboa. To the Oceanário team, particularly to Hugo Batista and Patrícia Napier, for always being available to help me and Carlos, for all the jokes in the corridors. To Prof. Dr. Pedro Ré, for the interest and support shown during this journey. To Prof. Dr. Carlos Assis, for the constant caring and Prof. Dr. Filomena Magalhães, for the advice relative to the statistical papers.. To my numerous Family for the unconditional support (and sometimes incomprehension) that made me go even forward, to showed them how this world of mine is. Farrusca, Caju and Fritz for giving me encouragement (even though you haven’t realized it). I have the happiness of having huge treasures as friends that supported me throughout this year and that, despite being (in some cases) from completely different areas, wanted to hear more and stay with me during this journey. Thank you for arriving and wanting to stay, even in the gloomiest times. Thank you for your laughs, happiness and constant companionship!. ii.
(6) Resumo Os pequenos peixes pelágicos, como os biqueirões e as sardinhas, são elementos essenciais dos ecossistemas marinhos, não só por serem muito importantes para a pesca mundial, representando quase 50 % dos desembarques, como também por representarem uma biomassa significativa nos níveis intermédios da rede trófica pelágica, tendo um papel importante de ligação dos níveis tróficos superiores e inferiores, especialmente nas áreas de afloramento costeiro. Na verdade, estes ecossistemas têm sido descritos como apresentando uma configuração "Wasp-waist", nos quais os pequenos pelágicos dominam as variações da cadeia trófica e exercem um controlo de cima para baixo (“top-down”) sobre o plâncton e de baixo para cima (“bottom-up”) sobre predadores de topo. As espécies de pequenos pelágicos europeus de biqueirão e de sardinha, têm uma grande variabilidade no tamanho da população, que tem sido atribuída à variabilidade do recrutamento, o qual é definido como sendo a reposição de novos indivíduos à população explorada, pois serão a próxima geração de reprodutores. Os primeiros estados de desenvolvimento dos peixes são caracterizados por terem altas taxas de mortalidade, e como tal, são considerados com preocupação por serem os principais factores responsáveis pela variação das populações, isto é, por serem as fases críticas para o recrutamento das espécies. Portanto, conhecer as principais causas das altas taxas de mortalidade nestas fases de desenvolvimento, é essencial para aumentar o conhecimento e também a capacidade de previsão quanto à variabilidade do recrutamento dos pequenos peixes pelágicos marinhos. Inúmeras teorias baseadas em factores biológicos e/ou físicos, que têm impacto sobre as fases iniciais do ciclo de vida, têm sido as propostas e as que têm tentado explicar quais os factores que controlam e regulam as variações do recrutamento destas populações de peixes. Assim, a predação, os padrões de circulação dos oceanos e limitação de alimento são considerados os factores mais importantes que influenciam a sobrevivência larvar. A alimentação foi considerada como sendo o factor determinante na sobrevivência dos estados larvares, por poder afectar a mortalidade larvar e impedir o sucesso do recrutamento, quer directamente através de inanição, quer indiretamente através da redução das taxas de crescimento. Desse modo, isso leva a que permaneçam mais tempo nos estágios iniciais de desenvolvimento, um período em que estão particularmente vulneráveis à mortalidade por predação.. iii.
(7) O principal objetivo deste trabalho foi comparar a ecologia e comportamento alimentar do biqueirão Engraulis encrasicolus e da sardinha Sardina pilchardus, com a perspectiva de eventualmente existir uma sobreposição de dietas, ingestão de presas com tamanho semelhante e interacções tróficas, durante estes estágios iniciais de desenvolvimento larval desde eclosão até 15 dias após eclosão (dph, days post hatch). Para tal, foram realizadas experiencias de ingestão (no 15 dph) em condições controladas com temperatura a 17,5 ⁰C, salinidade a 35 e tendo naúplios de Acartia grani como presa disponível em 3 concentrações diferentes de alimento, de limitada a ad libitum. Foram estabelecidas comparações entre as taxas de ingestão e o comportamento alimentar de ambas as espécies de larvas, tal como foram medidas as presas disponíveis nos tanques e as que permaneceram após o período das experiências de ingestão ter finalizado, de forma a aferir o espectro de tamanho de presas ingeridas por cada espécie de larva. Em ambas as espécies, foi registrado um aumento na capacidade de natação com o aumento da idade e desenvolvimento larvar. Embora as larvas de sardinha tenham tido tempos de natação mais elevados, o biqueirão teve maior sucesso de caça, sendo que as larvas de ambas as espécies aumentaram o número de fixações e ataques a presas com a idade. Em relação às taxas de ingestão, os resultados mostraram que houve um aumento das mesmas, com o aumento das concentrações de alimento. As larvas de biqueirão (aos 15 dph) apresentaram valores de ingestão mais elevados (82,36 N larva-1 h-1 para a concentração Intermédia e 145,13 N larva-1 h-1 para a concentração Elevada de alimento) que as larvas de sardinha (19,95 N larva-1 h-1 e N 42,35 larva-1 h-1, para a concentração Intermédia e para a concentração Elevada de alimento, respectivamente). Para além do mais, tendo sido oferecidos náuplios de Acartia grani nas experiências de ingestão, observou-se que as larvas de biqueirão (15 dph) com um comprimento total médio de 6,69 mm, preferiram presas de classes de tamanho dentro do intervalo de 130 a 160 µm de comprimento total, enquanto que as larvas de sardinha com um comprimento total médio de 10,51 mm preferiram presas em classes entre os 100 e os 120 µm. O presente trabalho observou, pela primeira vez, esta diferença e compartimentação dos recursos alimentares com base no tamanho das presas, em estágios iniciais de desenvolvimentos larvar nas espécies europeias de biqueirão Engraulis encrasicolus e de sardinha Sardina pilchardus. Os nossos resultados mostraram que a sardinha alimentou-se com base em presas de menores dimensões, quando em comparação com o biqueirão, evitando assim uma sobreposição directa pelo mesmo recurso alimentar e alimentando-se a um nível trófico mais baixo. De facto, esta diferença entre as presas ingeridas pelo biqueirão e pela sardinha já tinha sido observada para estágios de desenvolvimento larvar iv.
(8) mais tardios e para juvenis e adultos das mesmas espécies co-habitando no Nordeste do Mediterrâneo e entre as espécie Engraulis encrasicolus e Sardinops sagax que co-habitam na Corrente de Benguela. Quanto à possível sobreposição trófica das fases larvares iniciais destas duas espécies de peixes pelágicos Engraulis encrasicolus e Sardina pilchardus pelo mesmo tipo de presas, esta pode ser compensada pela grande variabilidade das suas dietas (como por exemplo, copépodes calanoides e harpacticoides, ciliados, tintinideos e cladocerae, entre outros), períodos de eclosão diferentes, e consequente desfazamento temporal, localizações espaciais diferentes e também diferentes capacidades de mobilidade. Desta forma, conhecer e averiguar as principais causas das elevadas taxas de mortalidade nesta fase do ciclo de vida tão vulnerável é essencial para aumentar o conhecimento disponível e consequentemente melhorar a capacidade de previsão sobre a variabilidade do recrutamento destes pequenos peixes pelágicos.. Palavras chave: Estágios larvares iniciais, Engraulis encrasicolus, Sardina pilchardus, taxas de ingestão; tamanho de presas ingeridas. v.
(9) vi.
(10) Abstract Feeding has been hypothesised as being a determining factor in survival of the larval stages, for it can affect larval mortality and prevent recruitment success either directly through starvation, or indirectly through a reduction in growth rates. Until now, no work studied the behaviour and feeding ecology of sardine Sardina pilchardus and anchovy Engraulis encrasicolus early larvae pairs at exactly the same experimental conditions (17.5 ⁰C, 35 of salinity and a mixed diet composed of dinoflagellates, rotifers and calanoid copepod nauplii), from hatching to 15 days post-hatching (dph). An increase of swimming capacity was registered as both species aged and developed. Although sardine spent more time swimming, anchovy had a higher hunting success, with both larval species increasing the number of fixations and attacks to prey with increasing age. Regarding ingestion rates, results show that they increased with prey concentration, with anchovy (15 dph) presenting higher values (82.36 N larva-1 h-1 for the Intermediate and 145.13 N larva-1 h-1 for the High food concentrations) than sardine (19.95 N larva-1 h-1 and 42.35 N larva-1 h-1, for Intermediate and High concentrations, respectively). Moreover, having been offered nauplii of Acartia grani at the ingestion experiments, anchovy (mean 6.69 mm total length, TL) preferred prey size classes within the range of 130-160 µm prosome length, while sardine larvae (mean 10.51 mm TL) preferred within the range of 100-120 µm. The present work observed, for the first time, this size-based resource partitioning in early larvae developmental stages of Engraulis encrasicolus and Sardina pilchardus, with sardine feeding on smaller prey items when in comparison with anchovy, hence avoiding direct competition and feeding at a lower trophic level. Therefore, ascertaining the prime causes of the high mortality rates, at these stages, is essential to understand, improve our knowledge and prediction capability regarding recruitment variability of small pelagic marine fish.. Key words: Early larvae, Engraulis encrasicolus, Sardina pilchardus, Ingestion rates, Prey size. vii.
(11) viii.
(12) Table of contents Agradecimentos/Acknowledgements ................................................................................................. i Resumo ............................................................................................................................................ iii Abstract ........................................................................................................................................... vii List of Figures..................................................................................................................................... x List of Tables ..................................................................................................................................... xi List of Annexes................................................................................................................................. xii Introduction ......................................................................................................................................1 Importance of small pelagic fish in the world........................................................................................... 1 Recruitment of small pelagic fish species and the importance of the early life stages ............................ 2 Small pelagics under study: Engraulis encrasicolus and Sardina pilchardus ............................................ 5 Distribution of the European Anchovy and Sardine ............................................................................. 5 Current State of the Atlanto-Iberian Stocks ......................................................................................... 6 Reproduction ........................................................................................................................................ 8 Larval Diet of the European Anchovy and Sardine ................................................................................. 12 Aim of the thesis ..................................................................................................................................... 15 Materials and Methods .................................................................................................................... 17 Larval Rearing.......................................................................................................................................... 17 Modal Action Patterns - MAPs Experiments........................................................................................... 19 Ingestion Experiments ............................................................................................................................ 20 Concentration and size of prey ............................................................................................................... 21 Statistical Analysis ................................................................................................................................... 22 Results............................................................................................................................................. 23 Growth Experiments ............................................................................................................................... 23 Modal Action Patterns - MAPs Experiments........................................................................................... 25 Ingestion Experiments ............................................................................................................................ 30 Prey size spectrum .................................................................................................................................. 31 Discussion........................................................................................................................................ 36 Final Remarks .................................................................................................................................. 49 References....................................................................................................................................... 50 Annexes........................................................................................................................................... 66 ix.
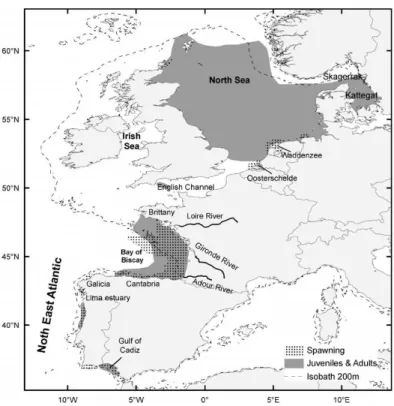
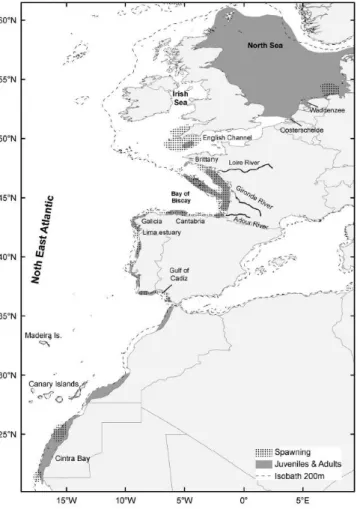
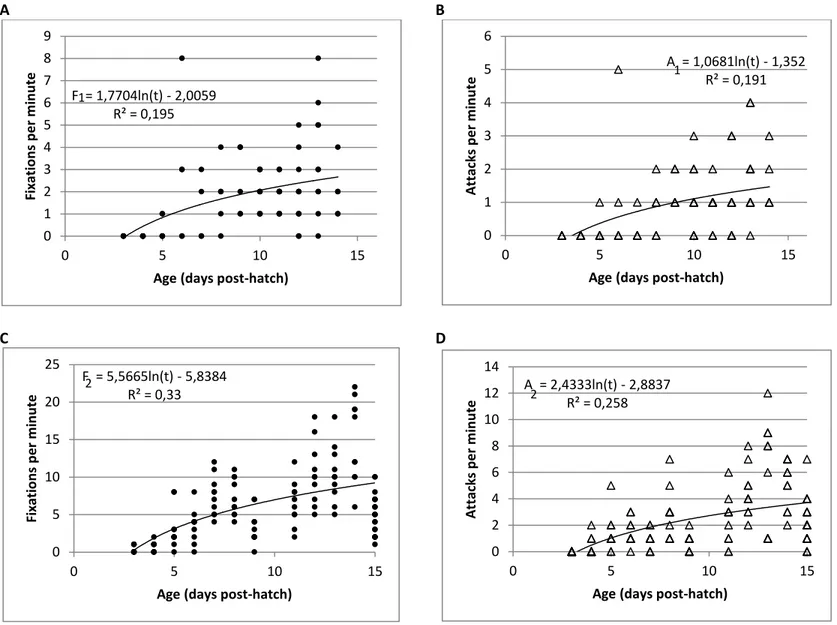
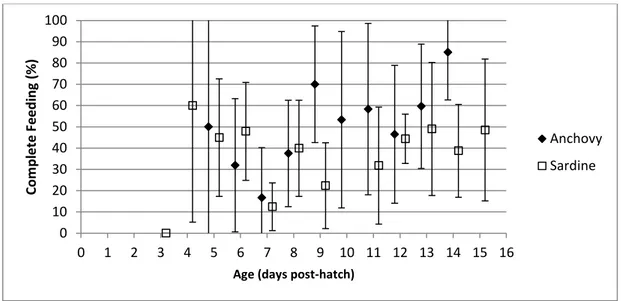
(13) List of Figures Pages Figure 1. Schematic energy transference through trophic levels and Wasp-waist model. Trophic groups based on trophic ecology, as: zooplankton (2), planktivorous prey or LTLs (3), meso-predators (4) and upper trophic level predators (5); arrows indicate inputs of a trophic group to another. WW model: arrow size is proportional to prey inputs expected under wasp-waist ecosystem dynamics. (Source Madigan et al., 2012) Figure 2. Geographical distribution of the Division IXa and Subdivisions IXa-North, IX-Central North, IXaCentral South, IXa-South (Portugal) and IXa-South (Spain). (Source: ICES 2014) Figure 3. European anchovy (Engraulis encrasicolus) in Northeast Atlantic Waters. (Garrido and van der Lingen, 2014). Figure 4. European sardine (Sardina pilchardus) spawning and nursery grounds in northeast Atlantic waters (Garrido and van der Lingen, 2014). Figure 5. Average larval length vs. age from hatch to 15 days post-hatching (dph) for anchovy Engraulis encrasicolus and sardine Sardina pilchardus larvae reared in the stocking tanks with the optimum diet (See Table 1). Equations for anchovy (above) and sardine (below) were fitted for the common ages (0 to 15 dph).. 2. 7 10 11. 24. Figure 6. Time spent swimming by anchovy Engraulis encrasicolus and sardine Sardina pilchardus larvae for a 60s observation period throughout larval growth, with respective trendlines (anchovy above and sardine below).. 26. Figure 7. Frequency of (A) fixations and (B) attacks on prey by anchovy Engraulis encrasicolus larvae; (C) fixations and (D) attacks on prey by sardine Sardina pilchardus larvae throughout ontogeny for larvae reared in optimum prey concentrations. F1 and A1 are the number of fixations and attacks of anchovy, F2 and A2 are the number of fixations and attacks of sardine and t is larval age (dph).. 27. Figure 8. Average complete feeding sequence throughout experimental period for anchovy Engraulis encrasicolus and sardine Sardina pilchardus larvae.. 28. Figure 9. Time spent swimming by anchovy Engraulis encrasicolus and sardine Sardina pilchardus larvae for a 60 s observation period for the different experimental tanks corresponding to the three food concentrations Low, Intermediate and High.. 29. Figure 10. Average complete feeding sequence (%) in the three prey concentrations (Low, Intermediate and High) for anchovy Engraulis encrasicolus and sardine Sardina pilchardus larvae. Figure 11. Box & Whisker Plot (mean, standard deviation and quartiles) for anchovy Engraulis encrasicolus, with mean prey size (black squares) of Acartia grani. Data from Control tanks and from Low, Intermediate and High food concentrations. Figure 12. Frequency distribution of prey size-classes given to anchovy Engraulis encrasicolus, in ingestion experiments, according to prey size classes determined in the control tanks and in the replica tanks after the 4h of ingestion. Figure 13. Box-whisker plot (mean, standard deviation and quartiles) for sardine Sardina pilchardus larvae, with mean prey size (black squares) of Acartia grani. Data from Control tanks and from Low, Intermediate and High food concentrations. Figure 14. Frequency distribution of prey given to sardine Sardina pilchardus, in ingestion experiments, according to prey size class in the control tanks and replica tanks after 4h of ingestion.. 30 32. 33. 34 35. x.
(14) List of Tables Pages Table 1. Feeding regimes used throughout anchovy and sardine larvae growth experiments. Table 2. Behaviour patterns anchovy (Engraulis encrasicolus) and sardine (Sardina pilchardus) larvae (adapted from Barlow 1968) Table 3. Feeding diets used in anchovy (E. encrasicolus) and sardine (S. pilchardus) larvae ingestion experiments. The prey was nauplii of the calanoid copepod A. grani. Each replica had a maximum of 5 larvae. Table 4. Average total length (mean ± SD, mm) throughout the experimental period for anchovy Engraulis encrasicolus and sardine Sardina pilchardus larvae. Table 5. Instantaneous growth rates of first feeding anchovy Engraulis encrasicolus and sardine -1 Sardina pilchardus larvae (mm d ). Table 6. Average swimming time (s) for anchovy Engraulis encrasicolus and sardine Sardina pilchardus larvae, per age. Table 7. Average complete feeding sequence (%) for anchovy Engraulis encrasicolus and sardine Sardina pilchardus larvae, per age. Table 8. Frequency of fixations and attacks events for anchovy Engraulis encrasicolus and sardine Sardina pilchardus larvae, per minute. Table 9. Kruskal-Wallis test results for prey size distribution values after diferent conditions for anchovy and sardina species. Comparisons were made amongst all food concentrations, i.e. Low, Intermediate and High food concentrations and Initial Control for both larvae species. Significant differences (p < 0.05) are presented in bold.. 18 19 20 23 24 25 28 29. 31. xi.
(15) List of Annexes Pages Annex 1. Annual global capture of anchovies and sardines between 1950 and 2009. (Source: FAO 2012). 66. Annex 2. Historical series of anchovy annual landings (t) in the Atlantic Iberian coast (Division IXa), since 1989 and onwards, concerning the period with available data for all the Subdivisions. Subdivision IXa South is differentiated between Algarve (A) and Gulf of Cadiz (C) (ICES, 2014).. 67. Annex 3. Recent series of anchovy landings in the Atlantic Iberian coast, Division IXa (1989-2013, the period with available data for all the Subdivisions). Sub-areas are pooled in order to differentiate the anchovy fishery harvested throughout the Atlantic facade of the Iberian Peninsula (ICES Subdivisions IXa North, Central-North and Central-South) from the fishery in the Gulf of Cadiz and Algarve (Subdivision IXa South), where both the stock and the fishery are mainly located (ICES, 2014).. 68. Annex 4. Age composition in Spanish anchovy landings (all fleets) in number of catches, concerning the Gulf of Cadiz (1995-2013) (ICES, 2014).. 68. Annex 5. Bay of Biscay anchovy: Series of anchovy biomass estimates (in tonnes) obtained from the BIOMAN DEPM survey (ICES, 2014).. 69. Annex 6. Historical series of sardine annual landings (t) in the Atlantic Iberian coast (Division IXa), for the period of 1978-2013, which present available data for all the Subdivisions. Subdivision IXa South is differentiated between Algarve (A) and Gulf of Cadiz (C) (ICES, 2014).. 70. Annex 7. Atlantic Iberian coast and Cantabrian Sea Sardine: Relative distribution of sardine catches of each group within each Subdivision (ICES, 2014).. 71. Annex 8. Atlantic Iberian coast and Cantabrian Sea Sardine: Historical summary biomass (B1+, biomass of age 1 and older) (a) and recruitment (b) trajectories in the period 1978 – 2013. The ICES 2013 assessment is shown for comparison (ICES, 2014).. 71. Annex 9. Simplification of the complexity of factors that influence prey selection and diet composition of larval and juvenile fish (Nunn et al., 2012).. 72. Annex 10. Conceptual schematic of how physical forcing (wind, etc.) might lead to environments that favour either sardine or anchovy (van der Lingen et al., 2006).. 72. xii.
(16)
(17)
(18) Introduction Importance of small pelagic fish in the world Small pelagic fish, such as anchovies and sardines, are essential elements of marine ecosystems, not only because they are very important in the world’s fisheries, representing almost 50 percent of the landings (FAO, 2012, Annex 1), but also because they represent a significant biomass at intermediate levels of the pelagic trophic web, having an important role by linking the lower and upper trophic levels, especially in upwelling areas (Cury et al., 2000; Bakun, 2006; Palomera et al., 2007; Checkley et al., 2009). In fact, these ecosystems have been described as having a “Wasp-waist” (WW) configuration, where small pelagic fish dominate the fluctuations of the trophic food web exerting top-down control on plankton and bottom-up control on top predators (Rice, 1995, Bakun, 1996). In WW ecosystems, population dynamics is largely controlled by large biomass of planktivorous lower trophic levels (LTL) species (such as sardine, anchovy and small squids), rather than the bottom (zooplankton) or the top (predators such as tunas, seabirds, marine mammals and sharks). These are highly productive systems that support low diversity (few species) but high abundance of LTLs, with environmental factors greatly affecting their abundance (Bakun, 1996; Cury et al., 2000). Models of WW upwelling systems (Fig. 1) have shown that they become more vulnerable to collapse when forage fish decline, for the lack of the chief energetic links that LTLs provide as intermediary (Cury et al., 2000). However, recent works from Fréon et al. (2009) and Madigan et al. (2012) have assessed and challenged the WW hypothesis attributed to the anchovy and sardine effect on the ecosystems, and have supported that every WW system shouldn’t be a priori considered as such and rather must be examined throughout the years and over multiple different oceanographic conditions, to ascertain trophic relationships (Madigan et al., 2012).Nevertheless, the importance of small pelagic fish and, particularly, of anchovy and sardine in upwelling and temperate non-upwelling ecosystems is not disputed, for they greatly contribute, due to their critical mid-trophic-level position, in the energy transfer between lower and higher trophic levels, as well the greatness of biomass that they represent in these ecosystems (Cury et al., 2000; van der Lingen et al., 2006; van der Lingen et al., 2009).. 1.
(19) Energy. Fig. 1. Schematic energy transference through trophic levels and Wasp-waist model. Trophic groups based on trophic ecology, as: zooplankton (2), planktivorous prey or LTLs (3), mesopredators (4) and upper trophic level predators (5); arrows indicate inputs of a trophic group to another WW model: arrow size is proportional to prey inputs expected under wasp-waist ecosystem dynamics. (Source Madigan et al., 2012). Recruitment of small pelagic fish species and the importance of the early life stages The European anchovy and sardine species of small pelagic fish usually have a large variability in population size, which has been attributed to recruitment variability (Garrido and van der Lingen, 2014), which is, by Myers (2002) definition to fisheries biology, the addition of new individuals to the harvested stock, for they are to be the next generation of breeders. Embryonic and larval stages of fish development, characterized by high mortality rates, are considered with concern for being the most important and the main factors responsible for the populations’ fluctuations, ie, being the critical phases for the species’ recruitment (Hjort, 1914, Miller et al., 1988). Therefore, ascertaining the prime causes of the high mortality rates, at these stages, is essential to understand, improve our knowledge and prediction capability regarding recruitment variability of small pelagic marine fish (Blaxter & Hunter 1982; Houde 1987).. 2.
(20) Numerous theories based on biological and/or physical factors impacting on early life stages (Mullon et al., 2003) have been the proposed ones that endeavour to explain which factors control the fluctuations and regulation of these fishes populations’ recruitment (e.g. Hjort 1914, Lasker 1975, Bakun 1996). Initially, theories and hypothesis proposed took into account the existence of environmental factors that controlled the recruitment of larvae with Hjort (1914, 1926) and Cushing (1975) (in Chícharo et al., 1998) presenting an explanation based on starvation. The first, proposed the Critical Period Hypothesis in which year-class strength of marine pelagic fish is determined within the first week of life, with mortality related to inadequate feeding conditions when larvae first transit to exogenous feeding, at the time the yolk sac reserves deplete (Blaxter and Hempel, 1963). The latter proposed, with the Hypothesis of Synchrony or ‘match–mismatch’ (Cushing, 1975; Cushing, 1990 in Chı ́charo et al., 1998), the intrinsic association between the timing of maximum larvae production and the plankton blooms (Cushing, 1990; Houde, 2001). Bailey and Houde (1989) acknowledged not only starvation but also predation as the 2 main agents of mortality during the larval stage. Some studies describe that good larval condition relates to higher growth and increase juvenile survival and, therefore, recruitment (Sponaugle et al., 2006), since have been observed in some species (herring, hake, cod, flounder, anchovy) that starved larvae are more vulnerable to predation than fed larvae (Neilson et al., 1986, Booman et al., 1991, Takasuka et al., 2003). With these models, the interaction between starvation and predation was gaining a more central role (Dower et al., 1997; Houde, 2002) in the mortality of eggs and larvae, with Miller (1988) presenting the Bigger the Better hypothesis. Miller (1988) refers that fish larvae survival is intimately related to their ability to find, capture and ingest sufficient quantities of appropriate prey, in order to improve fitness, ensure high rates of growth and prevent starvation (Blaxter, 1965; Checkley, 1982; Pryor & Epifano, 1993). Therefore, larvae may be able to more effectively avoid predation when featuring larger and well-fed (Neilson et al., 1986; Miller et al., 1988; Morote et al., 2010). In addition to the factors mentioned above, other authors reported the importance of abiotic factors. More particularly, the offshore advection and/or disruption of food patches that significantly affects larval mortality due to starvation (Wilhelm et al., 2005). The larval retention hypothesis presented by Iles & Sinclair (1982) refers that the spawning area would be adapted to locations with stable and predictable hydrodynamics, in order to allow larval retention (Iles & Sinclair, 1982, Sinclair 1988). Bakun (1996) presented the Basic Triad Hypothesis in which it considers the mechanisms of nutrient enrichment of the water column (such as upwelling or river discharge), the concentration of 3.
(21) planktonic prey and transport processes, and retention larval fish as the decisive factors in the recruitment success (Silva, 2012). Thus, predation, ocean circulation patterns and food limitation (starvation) are considered the most important factors influencing larval survival (Anderson, 1988; Peck & Hufnagl, 2012). Regarding the latter subject, food throughout fish larvae ontogeny, knowledge about which suitable prey field (ingested species and sizes) and the required prey concentrations that support survival and high rates of feeding and growth, are crucial (Caldeira et al., 2014). Therefore, all processes occurring at ontogeny (growth, survival and abundance) are dependent from the interaction between biotic and abiotic factors, which directly influents larval survival (Chícharo et al., 1998) and the success of recruitment. Although upwelling systems have high primary production and consequently high zooplankton productivity, which are favourable conditions for larvae to feed and grow, larvae become accessible and exposed to offshore transportation (outer shelf and oceanic zones) (Parrish et al., 1981 in Ramzi et al., 2006). This transportation can result in high mortality rates (Bailey, 1981; Parrish et al., 1981; Mann & Lazier, 1991; Santos et al., 2007), and in turn influence the recruitment. For too long it was considered that larval fish were a passive component of plankton (reviewed in Leis 2006) and that their movement would be associated to the currents, leading to the Simplistic Hypothesis. In it, the duration of the larval stage would be the only biological variable that was contrary and interfered with the larvae’s dispersion (Leis 2006). Recently, some studies have shown that larval behavioural skills refute the Simplistic Hypothesis, with Sponaugle et al. (2002) defending that the simple vertical migration movement, and therewith position in the water column, can increase larvae survival. So, possible mechanisms to prevent and avoid larvae’s dispersion are performance of vertical migrations (Santos et al., 2007) along with larval behaviour, that leads to both being important factors in larvae’s dispersion, allowing an advantage over the different speeds and directions between the current depths (Sponaugle et al., 2002).. 4.
(22) Small pelagics under study: Engraulis encrasicolus and Sardina pilchardus Distribution of the European Anchovy and Sardine The European anchovy (Engraulis encrasicolus, Linnaeus, 1758) is a small pelagic fish widely distributed extending from North Sea (Norway) in the North East Atlantic (NEA), to South Africa (Garrido et al., 2012), being abundant in the Southeastern Atlantic (Benguela Current system) (Garrido et al., 2012; Garrido and van der Lingen, 2014). It is abundant in the Mediterranean Sea and along the eastern Atlantic coast (Grant and Bowen, 1998; Bacha & Amara, 2009; Garrido et al., 2012), being the only representative of the family Engraulidae in the Northeastern Atlantic and in the Mediterranean (Ré, 1996). In recent years it is also showing a northern expansion into the North and Baltic Seas (Whitehead et al., 1988; Garrido and van der Lingen, 2014). The European sardine (Sardina pilchardus, Walbaum 1792) has a wide and continuous distribution along NEA shelf from Celtic Sea and North Sea, to Mauritania in the South (Parrish et al., 1989; Beare et al.,2004; Kanstinger & Peck, 2009; ICES, 2014). Sardine is also found in the Mediterranean, the Adriatic and the Black Sea (Whitehead et al., 1988; Muus & Nielsen, 1999; ICES., 2014) with populations in Madeira, the Azores and the Canary Islands as the western limit distribution (Parrish et al., 1989). With the global change of the environmental conditions, sardine distribution has been affected by direct displacement of populations into novel areas (Beare et al.,2004; Rijnsdorp et al., 2009) with this species occurring occasionally as far as the coast of Scotland in the North (Beare et al., 2004) and as Senegal in the South (Fréon and Stequert, 1979) during episodes of low water temperature (Corten and van Kamp, 1996; Binet et al., 1998). Both species share to great extent their habitat in Northeast Atlantic. Despite juvenile anchovy in the Bay of Biscay present an oceanic phase (Checkley et al., 2009), these species are almost entirely constrained within the continental shelf (within the 200 m isobath), with anchovy habitat being frequently associated with estuarine and bay areas, such as the Mira estuary, the Bay of Biscay and the Gulf of Cádiz (Ré, 1996; Uriarte et al., 1996; Bellier et al., 2007; Garrido et al., 2012; ICES, 2014), while sardine prevails in upwelling coastal areas, such as the western Iberian Peninsula coast (Ré et al., 1990; Santos et al., 2004; Garrido et al., 2007; Chouvelon et al., 2014; ICES 2014).. 5.
(23) Current State of the Atlanto-Iberian Stocks Small pelagic fish, such as anchovy and sardines, have a very important and central part in the Iberian Peninsula’s social-economics, representing the main targets of purse-seine fisheries (99% in 2013) in these countries (INE, 2014; ICES, 2014), but also for several others located at Europe and western Africa (Whitehead et al., 1988; ICES, 2014). Anchovy total landings in the Atlantic Iberian coast (Division IXa, Fig. 4), for 2013 were 5632 t, similar to the value of catches landed in the previous year (5589 t) and close to the historical average in the recent series (Annex 2 and 3), with the bulk of the fishery (92%) accounted in the Gulf of Cádiz (Subdivision IXa South). The anchovies age distribution, based on captured specimens of the fisheries, consisted in 2013 of individuals belonging to the age groups of 0, 1 and 2 years old, with complete absence of 3 years old anchovies (Annex 4) (ICES, 2014). Small pelagic fish stocks can present a strong decline, as happened in the Bay of Biscay, in 2004, where anchovy stock were considered to be in poor condition (Annex 5), and, because the Iberian anchovy stock is managed by an EU TAC (Total Admissible Catch - a management measure which aims to limit the volume of global catch to a certain level for a specific stock, which is then distributed in fishing quotas for all Member-states (INE, 2014; ICES, 2014), this lead to the closing of fisheries, from 2005 to 2009, so that the stock could recover. Acoustic surveys, such as PELAGO (Portuguese) and PELACUS (Spanish), continued to prospect and access the area, and so, in 2010, the stock biomass estimated was sufficiently recovered to allow fisheries to reopen. Currently, in 2014, anchovy’s species biomass along the Atlantic Iberian coast is estimated to be 30 864 t, well above the average of 2007-2013 (26 771 t), and in the region of the Bay of Biscay, the English Chanel and the North Sea (Subarea VIII) is estimated to be at 66 158 t (ranging between 46 981 and 92 833 t) (ICES, 2014).. 6.
(24) Fig. 2. Geographical distribution of the Division IXa and Subdivisions IXa-North, IX-Central North, IXaCentral South, IXa-South (Portugal) and IXa-South (Spain). (Source: ICES 2014). Sardines are the main target of purse-seine fishery for Portugal and Spain. Particularly, in the coastal waters off Portugal, sardine fishery is traditionally an important commercial species which represents more than 40% in weight and 19% in value (first sale) of the total annual national landings (Garrido and van der Lingen, 2014; Ramos et al., 2009). In 1996, following an evaluation by the International Council for the Exploration of the Sea (ICES, 1995), it was concluded that the sardine stocks concerning de Atlantic Iberian area (Division IXa, Fig. 4) were below safe biological limits. Therefore, because Iberian sardine stock is not managed by an EU TAC and it doesn’t have a TAC established for it, both Portugal and Spain agreed to the implementation of an action plan (national legislation and management measures) to promote the recovery of the stock and the need to insure its sustainability (INE, 2014). In the past few decades the Iberian sardine stock biomass has shown a declining trend, since 2006. Total sardine landings, in 2013, concerning Atlantic Iberian coast and Cantabrian Sea areas (Divisions IXa 7.
(25) and VIIIc) were 45 818 t, i.e. have suffered a decline of 17% with respect to the 2012 values (54 857 t) (Annex 6) (ICES, 2014). The dominant age in the 2013 fishery catches was the age group 0 (33%), whereas in previous years the most abundant year class was age 1, with 78% of all stock population in Atlantic Iberian coast and Cantabrian Sea areas consisting in age groups of 0, 1 and 2 years old (Annex 7) (ICES, 2014). Sardine biomass is at an historically low level, with the biomass of age 1 and older fish, in 2013, estimated in 149 thousand tonnes, which is 69% below the historical mean (Annex 8a) (ICES, 2014) and the last strong recruitment assessment placed in 2004, and being 44% lower than the historical geometric mean (Annex 8b). Because these species are short lived, population size fluctuates as a translation of any fluctuations in recruitment success (Cole and McGlade 1998). Therefore, the recovery of the stock biomass is mainly dependent on the strength of the incoming recruitment (ICES, 2014). In fact, sardine fishing was closed and prohibited, in September of 2014 until December of the same year, a period when normally fishing is allowed, in order to not compromise the sustainability of the resource (Portaria n.⁰ 188-A/2014 de 19 de Setembro).. Reproduction Sardines and anchovies are indeterminate, broadcast spawners, producing numerous batches of eggs during a single reproductive season (e.g., Alheit et al., 1984; van der Lingen & Durholtz, 2003; Garrido et al., 2007; Ganias et al., 2003), having females accumulating lipid reserves prior to and/or during the spawning season (Garrido et al., 2007). Environmental variables that control the timing of reproduction are day length, being nocturnal or crepuscular spawners with pelagic eggs, food availability and a resurgence of growth (Blaxter and Hunter, 1982). Spawning in pelagic fish usually occurs in areas where there are favorable food concentrations to the larvae and along the coast, to enable retention, avoid dispersion, and minimum transportation away to the outer shelf and oceanic zones (Parrish et al., 1981; Ramzi et al., 2006). Generally, the spawning periods of coexisting species pairs, like anchovies and sardines, are prolonged and exhibit even longer periods at lower latitudes or upwelling areas, in which they are very variable, of high amplitude, and may broadly overlap. However, the spawning peaks of sardines and anchovies are usually different (Luo and Musick, 1991; Zastrow et al., 1991, Bassista and Hartman, 2005). 8.
(26) European anchovy spawns from spring to autumn (Somarakis et al., 2004), but, being a summer spawner, essentially spawns from mid-March to August, presenting its spawning’s peak during May and June (Motos et al., 1996). Temperature has a strong influence on the sexual cycle of the European anchovy, wherein high temperatures lead to spawning and low temperatures prevent sexual activity (Whitehead et al., 1988; Djabali & Hamida, 1989 in Mezedjri et al., 2013). Laboratory evaluations regarding spawning frequency of European anchovy (E. encrasicolus) shows that the optimal sea temperature at which anchovy presents high spawning activity and good larval growth is between 19 – 20 °C (Garrido et al., 2012). However, spawning temperature range of the European anchovy varies according to geographical area. There are authors that place the temperature range between 16 °C and 28 °C in Black Sea (Lisovenko & Andrianov, 1996), others between 13.5 and 23 °C in the Bay of Biscay (Motos, 1994 in Alday et al., 2008) and 15 and 26 °C in the Mediterranean Sea (Somarakis et al., 2004). According to Motos et al. (1996) the extent of the spawning duration varies strongly each year, even in the same area of distribution, which lead the authors to consider anchovy spawning as temperature mediated, and spawning being activated by the process of water warming instead of having an absolute value of temperature. In the Northeast Atlantic one of the main areas for anchovy spawning is the Bay of Biscay (Fig. 2) (e.g., Ibaibarriaga et al., 2007; Planque et al., 2011; Petitgas et al., 2013). There is a second spawning area for the European anchovy located in the Spanish coast, the Gulf of Cadiz (ICES, 2014) and also a residual spawning and recruitment area in the Portuguese NW coast (Fig. 2) (Ré et al., 1990). Anchovy spawning seems to occur exclusively in near shore and estuarine areas (Kanstinger & Peck, 2009). Moreover, depending upon the age groups of the anchovy population, there is a difference between the spawning areas, with the use of coastal areas by one-year-old anchovy, whereas oceanic areas, in association with the shelf, are used by two-year-old or older anchovies (e.g., Motos et al., 1996; Uriarte et al., 1996; Vaz and Petitgas, 2002). As for the embryonic development, i.e. the time it takes to complete egg developmental stages and hatching to occur differs according to the environmental temperature, with the duration of every stage being lower as temperature increases (Miranda et al., 1990; Bernal et al., 2011), lasting 55h (circa 3 days) at 18 °C to the Gulf of Cádiz anchovy Engraulis encrasicolus (Bernal et al., 2011). After hatching, Atlantic European anchovy begins metamorphosis when larvae reaches 75 dph (35 mm), while in the Bay of Biscay, anchovy with optimal growth temperatures above 16 °C would require 40 to 50 days (4 to 5 cm) to metamorphose (Pecquerie et al., 2009; Aldanondo et al., 2010; Petitgas et al., 2012).. 9.
(27) In the Portuguese spawning area, anchovy larvae are mainly limited to the estuaries, but can dominate, in summer months, the near-shore ichthyoplankton communities (John and Ré, 1995 in Garrido et al., 2009), while in the Bay of Biscay, late larvae and early juvenile are distributed over the shelf and off-shelf areas (Irigoien et al., 2008; Petitgas et al., 2010, ICES, 2012).. Fig. 3. European anchovy (Engraulis encrasicolus) in Northeast Atlantic Waters. (Garrido and van der Lingen, 2014).. In the Iberian Atlantic coast upwelling ecosystem European sardine spawning period ranges from autumn to spring (winter spawner) with maximum spawning intensity from November through April/May (Ré et al., 1990; Zwolinski et al., 2001; Stratoudakis et al., 2003; Santos et al., 2004; Bernal et al., 2007; Figueiredo & Santos, 1989 in Santos et al., 2007) reaching spawning peaks twice in NovemberJanuary and April-May (Ré, 1986; Ré et al., 1990; Borges et al., 2003; Figueiredo and Santos, 1989 in Santos et al., 2007; Pestana, 1989 in Ramos et al., 2009). The seasonal reproductive performance of Atlantic sardine populations primarily depends on the seasonal amplitude of temperature of the respective habitat (Stratoudakis et al., 2007) with spawning temperature range of the European sardine varying according to the geographical area. In European Atlantic waters, spawning exhibits clear limits both for temperature and bottom depth, in the North East Atlantic (NEA) Coast more generally between 12 and 17 °C, with a preference for spawning between 13.5 and 15 °C and with spawning mainly restricted to the shelf (bottom depth: 10–150 m) (Bernal et al., 10.
(28) 2007; Ramos et al., 2009; Silva, 2012). However, for this same area (from the English Channel to Portugal) different optimal temperatures have been considered, with Stratoudakis et al. (2007) and Coombs et al. (2006) determining the optimal temperature between 14 to 15 °C and avoidance for temperatures lower than 12 °C and above 16 °C. In the Northeast Atlantic two main sardine spawning areas exist (Fig. 3), one is in the Iberian Peninsula, along the Western Portuguese coast (Cunha and Figueiredo, 1988) where the larvae of this species usually dominate the ichthyoplankton communities (Garrido et al., 2009) and the other is in the Cantabrian Sea (García et al., 1998a; Ramos et al., 2009). According to Bernal et al. (2007) the main geographical range is from the Strait of Gibraltar until the middle part of the Armorican shelf.. Fig. 4. European sardine (Sardina pilchardus) spawning and nursery grounds in northeast Atlantic waters (Garrido and van der Lingen, 2014).. As for the embryonic development of sardines, it lasts 45 h (circa 2 days) at 18 °C to the European sardine species (Miranda et al., 1990) and after hatching, larvae stage begins from day 1 until 66 dph (40 mm) (Santos et al., 2007). There is a difference in the coastal distribution between different age 11.
(29) groups, with sardine of older age, in the Bay of Biscay, distributing farther offshore over the continental shelf and along the shelf break (Petitgas et al., 2006), whereas in northern Portugal and Gulf of Cádiz a spatial dependence of young sardines to recruitment hotspots, at depths lower than 30 m during the summer months has been observed and young specimens are found inshore (Petitgas et al., 2006; Checkley et al., 2009). Apart from the Lima Estuary, that roosts S. pilcharddus larvae has the second most abundant species in the ichthyoplankton assemblage (Ramos et al., 2006) and the Cantabrian Sea (Ramos et al., 2009) (Fig. 3), early life stages of European sardine have their habitat limited to the coastal mid-shelf areas with avoidance of high turbidity areas, as well as low salinity waters of North Atlantic estuaries (Prista et al., 2003; Borges et al., 2007; Garrido and van der Lingen, 2014). Recruitment season is most successful and the probability of survival of early sardine larvae higher if upwelling events are weaker, in order to avoid dispersion of larvae to outer shelf and oceanic zones (Bode et al., 2007).. Larval Diet of the European Anchovy and Sardine Several studies indicate a possible correlation between high nutritional condition of fish larvae with high growth rates, enhanced recruitment with survival of the larvae and juvenile fish under natural conditions (Searcy & Sponaugle, 2001; Bergenius et al., 2002; McCormick & Hoey, 2004; Sponaugle et al., 2006; Nunn et al., 2012). Moreover, laboratory research on early life stages of small pelagic fish has shown that larvae either grow slowly or often die when provided only monospecific diets (e.g. dinoflagellates or copepod nauplii). Studies have shown the requirement of high concentrations of different prey types, perhaps reflecting the rapidly changing optimal prey sizes and/or types required as larvae grow and develop, in order to achieve growth rates similar to those in nature (Garrido et al., 2012; Hunter & Thomas, 1974; Peck et al., 2013; Theilacker, 1987; Lasker et al., 1970). Thus, laboratory-derived feeding rates that study the relation of these species larvae to prey availability are important for they help to understand and to infer the natural conditions at which larvae are able to survive and grow. There are numerous factors that influence the foraging ecology of larval fish, such as ontogeny, morphology, behaviour, availability of potential food items, local habitat complexity and hunger of the fish (Annex 9) (Nunn et al., 2012). When they first hatch, small pelagic fish larvae are completely dependent on maternal reserves that are present in the yolk sac and after exhausting the reserves, which varies from hours to days, 12.
(30) depending mostly on temperature and species (likewise to egg phase duration (Pepin, 1991), larvae transit to exogenous feeding (Garrido and van der Lingen, 2014). The ability to larvae withstand starvation varies over the larval period, being more vulnerable at first-feeding, at the time the yolk sac reserves deplete (Hunter and Sanchez, 1976). Studies about larval Engraulis encrasicolus anchovy’s diet have mostly been based on stomach content analyses (Garrido and van der Lingen, 2014). Initially very few studies existed about the diet of Engraulis encrasicolus larvae in Atlantic Iberian waters, with Ferreira and Ré (1993) study from a Portuguese estuary (Mira), during Spring season, being the first one on this subject and considering the diet composition to be mainly composed of tintinnids (> 80 %). Soon after, a detailed study by Conway et al. (1998) on anchovies’ larval diet, in Adriatic Sea, indicated that it consisted principally on the various stages of copepod development, particularly Calanoid and Cyclopoid copepod eggs and nauplii and also the cyclopoid copepod Oithona spp. This author also reported additional items in the guts of larvae, as the presence of pollen grains and the dinoflagellate Peridinium. (Conway et al., 1998; van der Lingen et al., 2009). Contrary to the lack of studies in Atlantic waters, and mostly due to recent efforts and work in this subject, knowledge on E. encrasicolus larval diet in the Mediterranean Sea became substantial (review in Garrido and van der Lingen, 2014). In a Mediterranean Sea diet study, as well in the Cantabrian Sea (Munuera, 2006) stomach contents of larvae consisted mostly of copepod eggs, nauplii and copepodites (Tudela et al., 2002), with microzooplankton as an important component of the diet of early anchovy larvae (Rossi et al., 2006). The diet differs with Morote et al. (2010) referring that not only calanoid copepods were important to the diet of early larvae, but also existing significant contributions of harpacticoids (genus Microsetella and Euterpina) and cladocerans for older anchovy larvae (Garrido et al., 2012), contrary to Catalán et al. (2010) which refers that early larvae rejected abundant taxa such as cladocerans and ingested essentially calanoid copepods. Also, it was observed an increase in size range of ingested prey (van der Lingen et al., 2009) and a shift to larger developmental stages of prey as larvae grew (Garrido et al., 2012), similar to results shown for anchovy in the Adriatic Sea by Conway et al. (1998). The diet of the European sardine, Sardina pilchardus, and its composition has presented itself a complex subject to analyse and discern throughout the years. Contrasting with results found for adults, the diet’s composition of sardine larvae is almost exclusively zooplanktivorous, being crustacean eggs and early developmental stages of copepods (particularly calanoids) the bulk of stomach contents, either by numerical abundance (Conway et al., 1994; Munuera, 2006) or by their contribution to total 13.
(31) ingested carbon (Munuera, 2006; Morote et al., 2010; Catalán et al., 2006; Voss et al., 2009; Nikolioudakis et al., 2012). Both old and recent studies that analyze the stomach contents of sardine larvae (which is common to other small pelagic fish), collected in the sea find it challenging, due to a very high percentage of empty guts obtained, because of regurgitation associated with handling stress and its easiness, by the straightened and lengthened of the intestine (Lazzaro, 1987), thereby preventing a proper estimation of their feeding rates (e.g., 90 % in Blaxter 1969; 73 % in Conway et al., 1998; 77 % in Munuera, 2006; 68 % in Voss et al., 2009; 75 % in Catalán et al., 2010; 70 % in Morote et al., 2010 and 98% Costalago, 2012 in Garrido and van der Lingen, 2014). Even though larvae can still ingest phytoplankton, early larvae present a poorly developed digestive system and are probably unable to digest non-naked microalgae cells, as demonstrated in studies in which laboratory-reared larvae showed no enhancement in their survival by the presence of various phytoplankton cells, furthermore having microalgae such as the diatom Dunaliella spp. alive and moving in the gut (Blaxter, 1969). Both European Engraulis encrasicolus and Sardina pilchardus species larvae are exclusively selective visual feeders, at this stage (Blaxter, 1969; Conway et al., 1998), for they lack the mechanism of concentrating planktonic particles, by not having their feeding apparatus fully developed (Andreu, 1969; Bode et al., 2004; van der Lingen et al., 2009; Morote et al., 2010; Costalago, 2012 in Garrido and van der Lingen, 2014). Hence, to capture their planktonic prey they adopt an S-posture and open their mouth, straighten their body and engulf the prey, increasing their success as larval age increases (Garrido and van der Lingen, 2014). Feeding has been hypothesised as being a determining factor in survival of the larval stages (e.g. Buckley and Lough, 1987), for it can affect larval mortality and prevent recruitment success either directly through starvation (e.g. Anderson, 1994; Fortier et al., 1995), or indirectly through a reduction in growth rates (e.g. Gotceitas et al., 1996; von Westernhagen et al., 1998; Nunn et al., 2012) (Annex 9). Thereby, this causes them to spend more time in early development stages, a period in which they are at particularly vulnerable to predation mortality (Houde & Sheckter, 1980; Munk & Kiørboe, 1985; Anderson, 1988; Bailey and Houde, 1989; Rice et al., 1993; Munk, 1997). Complementary laboratory studies are of most importance and previous laboratory experiments have been performed with sardine (Caldeira et al., 2014; Silva et al., 2014) and anchovy (Garrido et al., 2012) larvae that showed that they depend of mixed prey assemblages provided in sufficient concentrations to be able to survive. However, up until now, no work has studied the feeding ecology of 14.
(32) sardine and anchovy pairs at exactly the same experimental conditions. Therefore, more studies should be carried out so larval feeding rates are quantified, prey types, size and concentrations are identified in relation to larval size, providing in this way optimal and adequate conditions to support larval growth and consequently larval survival (Caldeira et al., 2014). Important insights that might help understand the mechanisms of recruitment regulation and the knowledge necessary to establish sustainable exploitation rates of the fish populations (Peck et al., 2013).. Aim of the thesis The present work provides the first laboratory comparative study between early larvae of European anchovy Engraulis encrasicolus and sardine Sardina pilchardus feeding, under the same controlled conditions, in the Oceanário de Lisboa, during these early stages of larval development. The main objective of this work was to compare the feeding ecology of anchovy E. encrasicolus and sardine S. pilchardus early larvae from the perspective of possible diet overlap and similar prey size ingestion, and trophic interactions between these species’ early larvae. Particularly, the objectives of this thesis were to: . Perform ingestion experiments under controlled conditions of 17.5 ⁰C, 35 of salinity and with Acartia grani nauplii as prey offered in 3 different prey concentrations ranging from food-limited to ad libitum concentrations, and analyze and compare the ingestion rates and feeding behaviour.. . Measure and compare the size of the prey offered and of those that remained in the tanks following the end of the ingestion experiments and ascertain the prey size spectrum of the ingested items by both species’ larvae.. . Compare all data collected with other laboratory studies and discuss it so as to infer and compare to the natural and field oceanic environmental studies.. This study was conducted in the frame of the VITAL project - Vital rates of pelagic fish larvae (PTDC/MAR/111304/2009) which aimed to obtain vital rates of Engraulis encrasicolus and Sardina pilchardus larvae due to the variation of physical and biological factors responsible for their growth and survival.. 15.
(33) This work is expected to increase awareness of both E. encrasicolus and S. pilchardus early developmental stage larvae and complement the information available in the scientific community in relation to food diet, behaviour and preference of prey size, which may help determine the survival of early stages of these small pelagic fish.. 16.
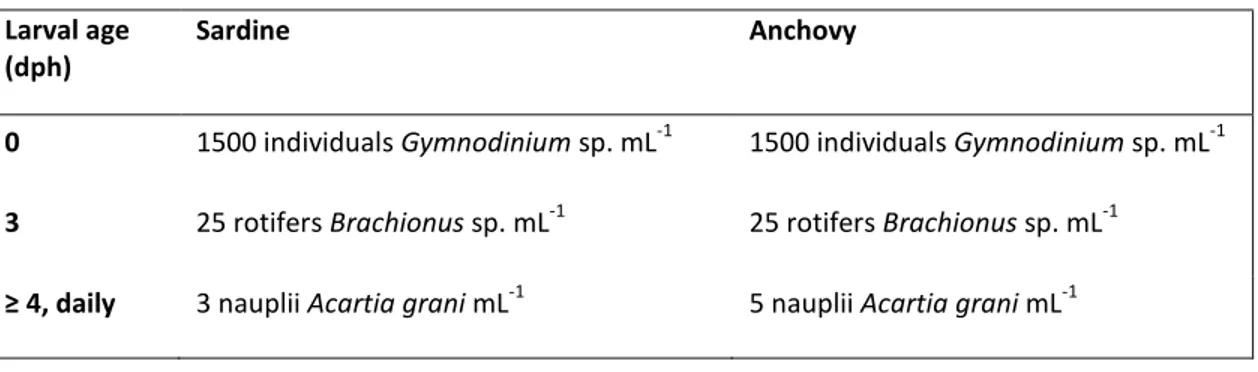
(34) Materials and Methods Larval Rearing Sardine (Sardina pilchardus) eggs were obtained from spawning captive adult fish, captured by purse-seine fishery in the fishing port of Peniche (Western Portugal) in June of 2009 and July of 2010 and maintained in a large cylindrical tank (15000 L) in the Oceanário de Lisboa, and the anchovy (Engraulis encrasicolus) eggs were spawned by adults captured in the fishing port of Punta Umbria, Huelva, in September of 2011 and maintained in a large cylindrical tank (9000 L). Natural spawning of the adults of both fish species was induced by adjusting the photoperiod and temperature to natural conditions and by increasing food concentration. Adults were fed a mixture of diets composed by Aquasoja 3mm prepared food and also algae, nauplii, Cyclops sp. and rotifers, shrimp, mussels, cockles, Atlantic ditch shrimp, with a vitamin plus every week. Since anchovy and sardine spawn at different times of the year, anchovy are summer spawners (Motos et al., 1996), whereas sardines are winter spawners (Stratoudakis et al., 2007), we tried to follow this natural cycle and induce spawning of each species in the summer months for anchovy and winter months for sardines. Egg collectors (500-µm mesh) were placed in the skimmer compartments of the tank to where the overflow directed the eggs. The egg collectors were inspected for the presence of eggs each morning. Eggs were counted (10% subsample) under a stereoscopic microscope (Zeiss STEMI 2000-C) and only when a minimum of 500 eggs were present, they were transferred into 30 L experimental tanks (stocking tanks) by pipette, where larvae were reared and incubated at a temperature of 17.5 ± 0.4 ⁰C (mean ± SD, ⁰C) and a salinity of 35 ± 0.5. These conditions were maintained throughout the whole experimental period. Sardine and anchovy larvae were reared in transparent cylindrical tanks (30 L) filled with 25 L filtered seawater with gentle aeration and kept in a black compartment filled with water at a controlled and constant temperature, in order to maintain all experimental tanks with high prey conspicuousness and minimum and equal temperature variations. Such conditions aim to recreate the natural habitat conditions at which sardine spawning activity takes place. The light regime was kept at 8 h light and 16 h dark.. The supply of constant aeration was kept to maintain water circulation and high oxygen. concentrations. The tanks were cleaned and siphoned every day, allowing for a daily record of mortality. 17.
(35) rate. Temperature, salinity, oxygen and water quality parameters (nitrates, ammonia) were measured daily to assure water quality. The diet and prey concentration used to grow the larvae is based on growth and survival studies previously performed in the framework of Project VITAL - Taxas vitais de larvas de peixes pelágicos, PTDC/MAR/111304/2009, considering these as the optimal concentrations for early sardine and anchovy larvae (Table 1), for they proved suitable in providing high growth and survival rates (Garrido unpublished data). The diet included the dinoflagellate Gymnodinium sp., rotifers Brachionus sp. and nauplii of the calanoid copepod Acartia grani, with these concentrations being maintained throughout the experimental period. Table 1. Feeding regimes used throughout anchovy and sardine larvae growth experiments. Larval age (dph). Sardine. 0. 1500 individuals Gymnodinium sp. mL. 3. 25 rotifers Brachionus sp. mL. ≥ 4, daily. 3 nauplii Acartia grani mL. Anchovy. -1. -1. -1. 1500 individuals Gymnodinium sp. mL 25 rotifers Brachionus sp. mL 5 nauplii Acartia grani mL. -1. -1. -1. Although too small to be fed directly by anchovy and sardine larvae, the microalgae Nannochloropsis sp. was added daily to the tanks to get the “green-water” effect and also to provide food for Acartia grani nauplii and rotifers. Acartia grani was kept in stock cultures and fed ad libitum with a mixture of Rhodomonas sp. and Gymnodinium sp., while rotifers were fed ad libitum with Nannochloropsis sp. Every day the concentration of food that remained in the larval tanks was monitored, 25% of the tank water was renewed, and new food was added so that food concentration values present in the experiments remained constant throughout the experimental period. A Sedgwick–Rafter counting chamber was used to estimate the dinoflagellates under a microscope (Leica DM 2000). using a subsample of 10 %; rotifers and copepod nauplii were counted in a. zooplankton Bogorov counting chamber, in an 8 ml subsample with Lugol solution, an then under a stereoscopic microscope (Zeiss STEMI 2000-C). Groups of larvae were randomly selected and collected from the rearing tank by sampling at 0 day post-hatching (dph), 3 dph, and after 5 dph every 5 days, until 15 dph. Larval growth rates of both. 18.
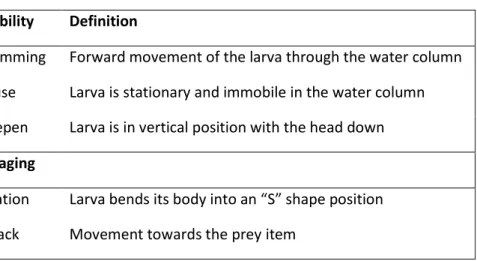
(36) E. encrasicolus and S. pilchardus experimental tanks were assessed by measuring their total length (TL ± 0⋅05 mm) in vivo and growth was fitted to exponential curves, using the equation: 𝑇𝐿 = 𝑙0 × 𝑒 𝑘𝑡 Where 𝒍𝟎 is length at hatching, 𝒌 is the instantaneous growth rate and 𝒕 is age (dph).. Modal Action Patterns - MAPs Experiments The feeding behaviour of both anchovy E. encrasicolus and sardine S. pilchardus larvae were observed and registered daily throughout growth and ingestion experiments (for each replica and control beakers, described below). A larva was selected randomly and its behavior was observed and registered for 1 minute interval, while applying the focal animal technique (Martin & Bateson 1993). The protocol was repeated daily for a maximum of 5 larvae, since day 3 post-hatch. Adapted from Barlow (1968) and resumed in Table 2, behaviours were arranged into modal action patterns (MAPs), particularly: time larvae spent swimming (Swim), how many times it adopted the formation “S” or S-shape (Fixation), when larvae actually attacked a prey (Attack), and finally when larvae stayed in the vertical position with the head down (Deepen). MAPs recorded were grouped into foraging and locomotory behaviours. The former were recorded as frequency of occurrence, whereas the latter was recorded as time variables. Successful feeding and complete feeding sequence were only considered when a fixation was followed by an attack. Table 2. Behaviour patterns anchovy (Engraulis encrasicolus) and sardine (Sardina pilchardus) larvae (adapted from Barlow 1968). Mobility. Definition. Swimming. Forward movement of the larva through the water column. Pause. Larva is stationary and immobile in the water column. Deepen. Larva is in vertical position with the head down. Foraging Fixation. Larva bends its body into an “S” shape position. Attack. Movement towards the prey item 19.
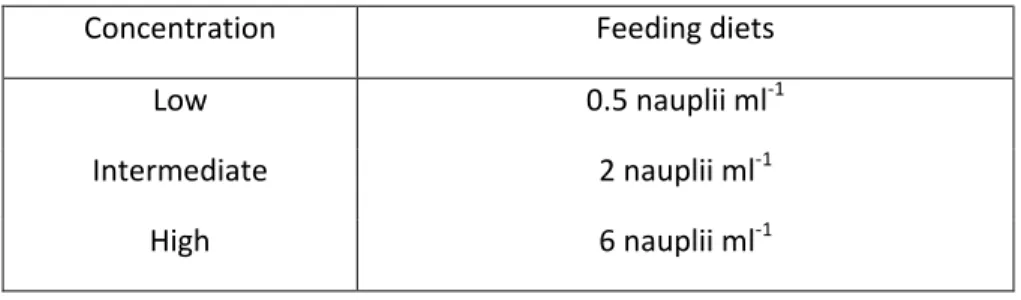
(37) Ingestion Experiments For both anchovy (Engraulis encrasicolus) and sardine (Sardina pilchardus) larvae ingestion experiments consisted of providing three different known concentrations of Acartia grani nauplii, that were previously observed to induce from restricted growth to optimal conditions, at the start of the experiments and determining the feeding rates. Ingestion experiments used 3 replicates of 3 food concentrations: Low (0.5 N ml-1), Intermediate (2 N ml-1) and High (6 N ml-1). These food regimes were also based in previous studies included in VITAL project (Table 3). For each food concentration and control data, 2 replicas without larvae were added to the experiments in order to access natural mortality of prey, one initial and one that completed the 4 h experiment. The preparation for the ingestion experiments started the day before, at 14th dph, with the transference of the surviving larvae to 5L beakers (4L water volume), considering a minimum of 5 larvae per replica. Beakers were previously acclimated and placed in a bath at 17.5 ⁰C in order to keep the temperature similar and constant amongst all. Larvae were 18h without food before the start of the experiment, after which food was provided and a 4 h experimental period was set in order to allow larvae feed. Table 3. Feeding diets used in anchovy (E. encrasicolus) and sardine (S. pilchardus) larvae ingestion experiments. The prey was nauplii of the calanoid copepod A. grani. Each replica had a maximum of 5 larvae.. Concentration. Feeding diets. Low. 0.5 nauplii ml-1. Intermediate. 2 nauplii ml-1. High. 6 nauplii ml-1. After the 4 h ingestion period, the 5L experimental beakers (4L water volume), with the surviving larvae were placed one by one in the freezer, in order to prevent regurgitation associated with handling stress. Larvae were, thereafter, rapidly removed and with the assistance of previously diluted phenoxyethanol or MS-222 anaesthetics, the total length (TL) of the surviving larva of each replica tank was measured in vivo under a stereoscopic microscope (to the nearest ± 0.05 mm, micrometre on a Zeiss Stemi 2000 dissecting scope).. 20.
(38) In order to determine final prey concentration at the end of the experiments, all water volume from every replica was filtered, using a 90 mm sieve and preserved in sample cups with 2 % of Lugol solution for posterior counting and determination of prey-size. Water volume of initial and final controls was also filtered to determine natural prey mortality. For each replicate larval beaker, ingestion (𝐼; number of prey ingested per larva per hour or prey larvae-1 h-1) and clearance rates (𝐹; millilitres of water filtered per larva per hour or mL larvae-1 h-1) were determined based on the equations: 𝐶𝑖 −𝐶𝑙 −(𝐶𝑖 −𝐶𝑓 ). 𝐼=(. 𝑛. )⁄𝑡. (3). and 𝑙𝑛(𝐶𝑓 ⁄𝐶𝑖 )−𝑙𝑛(𝐶𝑙 ⁄𝐶𝑖 ). 𝐹 = (𝑉 × (. 𝑡. )) /𝑛. (4). Where 𝐶𝑖 is the initial prey concentration, 𝐶𝑓 the average final prey concentration in the control beakers, 𝐶𝑙 is the final prey concentration in the larval beakers, 𝑛 the number of surviving larvae at the end of the experiment, 𝑡 is the duration of the experiment in hours and 𝑉 is the volume of water in the beaker. To determine the carbon content (µg C) of the prey, conversion factors were used. The carbon content (𝐶𝐶) of nauplii prey was derived from its size and estimated from the equation of van der Lingen (2002), based on nauplii total length (𝑇𝐿): 𝐶𝐶 = 4.24 × (80.627 × (𝑇𝐿)4.27. Concentration and size of prey For determination of prey concentration present at the end of the experiments, every food concentration replica and controls were analysed and Acartia grani nauplii were counted. This assessment was made using a subsample of the water volume present in the sample cups, depending of the food concentration, and with a Bogorov counting chamber under a stereoscopic microscope (Zeiss STEMI 2000-C). In order to determine prey size present in the ingestion experiments, photographs were taken of every replica sample cup as well of controls (initial and final), with the assistance of a stereoscopic microscope (Zeiss STEMI 2000-C, at x10 magnification) coupled with a digital camera (Canon EOS SLR 21.
(39) 550). Afterwards, the photographs were analysed with the image analysis software program Image Pro Plus Software (version 4.5.0.29) in order to take with more accuracy (to the nearest 0.01 mm) the morphometric measurement, prosome length (PRL), of copepod Acartia grani nauplii.. Statistical Analysis A descriptive analysis was performed as an intrinsic part of processing the data obtained concerning Growth, MAPs and Ingestion experiments. In order to verify if there were differences of prey size distribution among the food concentrations (Initial Control, Low, Intermediate and High concentrations) given to anchovy (Engraulis encrasicolus) and sardine (Sardina pilchardus) during the ingestion experiments, two different statistical tests were performed, a one-way ANOVA or a Kruskal–Wallis test. This depended of the normality (Shapiro–Wilk’s test) and/or homocedasticity (Levene’s test) of the data, and appropriate transformations were applied to non-normal and heteroscedastic data. To identify significant differences in mean values an a posteriori Tukey HSD test (parametric) or a multiple comparisons Dunn’s test (non-parametric) was performed. All statistical and data analyses were performed with Microsoft Office Excel 2010 and Statistica 12 software, with significance level accepted at p < 0.05 in all test procedures.. 22.
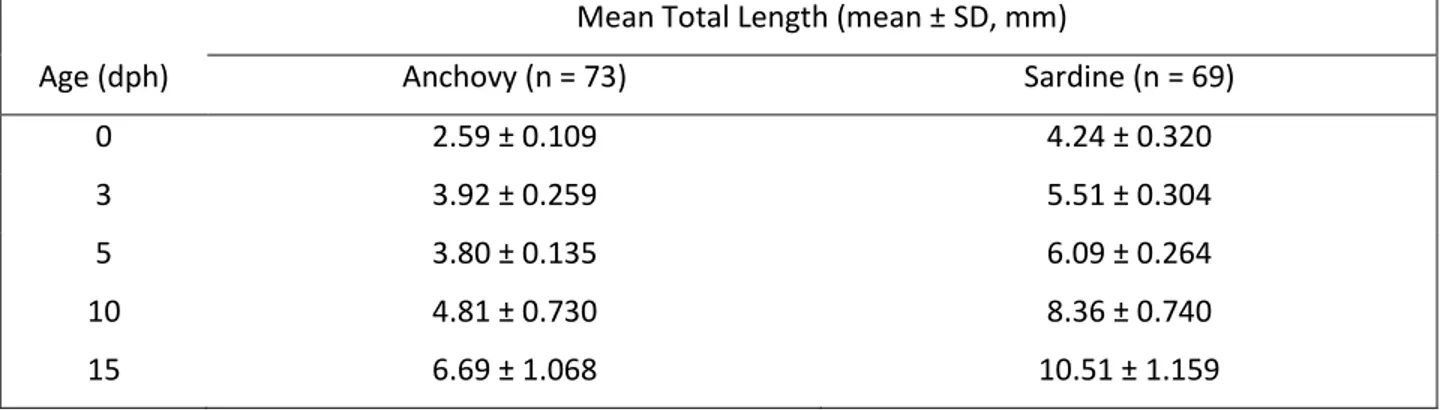
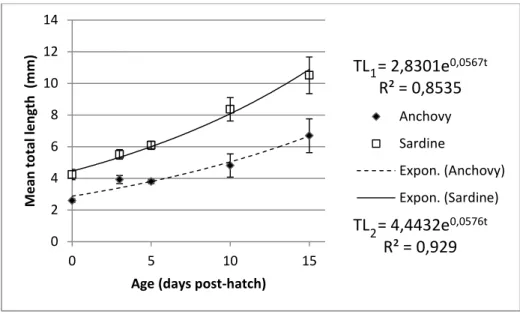
(40) Results Growth Experiments Approximately 48h after the eggs were removed from the egg collector, anchovy larvae hatched with a mean (±SD) total length (TL) of 2.59 (± 0.109) mm, and sardine larvae hatched with 4.24 (± 0.320) mm (Table 1). Initially larvae of both species hatch without their mouth open and it takes 3 to 4 dph for them to be able to begin exogenous feeding.. Table 4. Average total length (mean ± SD, mm) throughout the experimental period for anchovy Engraulis encrasicolus and sardine Sardina pilchardus larvae.. Mean Total Length (mean ± SD, mm) Age (dph). Anchovy (n = 73). Sardine (n = 69). 0. 2.59 ± 0.109. 4.24 ± 0.320. 3. 3.92 ± 0.259. 5.51 ± 0.304. 5. 3.80 ± 0.135. 6.09 ± 0.264. 10. 4.81 ± 0.730. 8.36 ± 0.740. 15. 6.69 ± 1.068. 10.51 ± 1.159. Throughout the experimental period sardine larvae had a significantly higher TL-at-age than anchovy larvae. With increasing age TL increased, reaching at age 15 day post-hatch (dph) a maximum value of 8.50 mm for anchovy and 12.70 mm for sardine larvae. Larval growth rates of both E. encrasicolus and S. pilchardus larvae were fitted to exponential curves, which describe the relation between TL and “t” age (dph) as 𝑇𝐿1 = 2.8301𝑒 0.0567𝑡 , (R2 = 0.854, n= 73) for anchovy larvae and 𝑇𝐿2 = 4.4432 𝑒 0.0576𝑡 , (R2 = 0.929, n= 69) for sardine larvae (Fig. 1).. 23.
(41) Mean total length (mm). 14 12. TL1 = 2,8301e0,0567t R² = 0,8535. 10 8. Anchovy. 6. Sardine Expon. (Anchovy). 4. Expon. (Sardine). 2 0 0. 5. 10. 15. TL2 = 4,4432e0,0576t R² = 0,929. Age (days post-hatch). Fig. 5. Average larval length vs. age from hatch to 15 days post-hatching (dph) for anchovy Engraulis encrasicolus and sardine Sardina pilchardus larvae reared in the stocking tanks with the optimum diet (See Table 1). Equations for anchovy (above) and sardine (below) were fitted for the common ages (0 to 15 dph).. Instantaneous growth rates were computed for the first 15 dph of the experimental period and corresponded to 0.27 (± 1.271) mm day-1 for anchovy larvae (3-7 mm mean TL) and 0.42 (± 1.995) mm day-1 for sardine larvae (4-11 mm mean TL). Therefore with the diet given, that included nauplii of Acartia grani (3-5 nauplii ml-1), rotifers and Gymnodinium sp. (see Table 1), and at this temperature sardine larvae grew significantly faster in total length than anchovies. When depending on yolk reserves, at the beginning of the development, anchovy grew faster than sardines (from 0 to 3 dph), but afterwards anchovy larvae growth rate decreased significantly between 3-5 dph while sardine larvae growth rate was high throughout the experimental period (Table 2).. Table 5. Instantaneous growth rates of first feeding anchovy Engraulis encrasicolus and -1 sardine Sardina pilchardus larvae (mm d ).. Growth rate measured (mm d-1) Age (dph). Anchovy. Sardine. [0,3]. 0.138. 0.087. [3,5]. 0.000. 0.050. [5,10]. 0.047. 0.063. [10,15]. 0.066. 0.046. 24.
Imagem
+7
Documentos relacionados