Coupling Demographic and Genetic
Variability from Archived Collections of
European Anchovy (Engraulis encrasicolus)
Paolo Ruggeri1, Andrea Splendiani1, Cristina Di Muri1, Tatiana Fioravanti1,
Alberto Santojanni2, Iole Leonori2, Andrea De Felice2, Ilaria Biagiotti2, Piera Carpi2, Enrico Arneri3, Paola Nisi Cerioni1, Massimo Giovannotti1, Vincenzo Caputo Barucchi1,2*
1Dipartimento di Scienze della Vita e dell’Ambiente, UniversitàPolitecnica delle Marche, Via Brecce Bianche, 60131 Ancona, Italy,2Consiglio Nazionale delle Ricerche, Istituto di Scienze Marine Sezione Pesca Marittima, Largo Fiera della Pesca, 60125 Ancona, Italy,3FAO-FIRF, Fisheries and Aquaculture Department, AdriaMed Project, Viale delle Terme di Caracalla, 00153 Roma, Italy
*v.caputo@univpm.it
Abstract
It is well known that temporal fluctuations in small populations deeply influence evolutionary potential. Less well known is whether fluctuations can influence the evolutionary potentials of species with large census sizes. Here, we estimated genetic population parameters from as survey of polymorphic microsatellite DNA loci in archived otoliths from Adriatic European anchovy (Engraulis encrasicolus), a fish with large census sizes that supports numerous local fisheries. Stocks have fluctuated greatly over the past few decades, and the Adriatic fishery collapsed in 1987. Our results show a significant reduction of mean genetic parame-ters as a consequence of the population collapse. In addition, estimates of effective popula-tion size (Ne) are much smaller than those expected in a fishes with large population census sizes (Nc). Estimates ofNeindicate low effective population sizes, even before the popula-tion collapse. The ratioNe/Neranged between 10−6and 10−8, indicating a large discrepancy between the anchovy gene pool and population census size. Therefore, anchovy popula-tions may be more vulnerable to fishery effort and environmental change than previously thought.
Introduction
Population dynamics are driven by a complex set of ecological and evolutionary variables that mold population demography on several spatial and temporal scales [1]. Unfortunately, a tem-poral dimension is not always considered in the assessment of population structure, because historical samples are not always available, or because of the high costs of retrospective labora-tory analysis [reviewed in 2]. Among vertebrates, populations of bony fishes are most often examined for historical trends because of the availability of historical tissues [3], which are sometimes available from archeological excavations [3] and from archived fish scales and oto-liths used for aging by fishery managers [4]. The extraction of DNA from these archived
a11111
OPEN ACCESS
Citation:Ruggeri P, Splendiani A, Di Muri C, Fioravanti T, Santojanni A, Leonori I, et al. (2016) Coupling Demographic and Genetic Variability from Archived Collections of European Anchovy (Engraulis encrasicolus). PLoS ONE 11(3): e0151507. doi:10.1371/journal.pone.0151507
Editor:Erik Sotka, College of Charleston, UNITED STATES
Received:July 20, 2015
Accepted:February 29, 2016
Published:March 16, 2016
Copyright:© 2016 Ruggeri et al. This is an open access article distributed under the terms of the
Creative Commons Attribution License, which permits unrestricted use, distribution, and reproduction in any medium, provided the original author and source are credited.
Data Availability Statement:The citation for Dryad data repository and its related DOI are the following: Ruggeri P, Splendiani A, Di Muri C, Fioravanti T, Santojanni A, Leonori I, De Felice A, Biagiotti I, Carpi P, Arneri E, Nisi Cerioni P, Giovannotti M, Caputo Barucchi V. Data from: Coupling demographic and genetic variability from archived collections of European anchovy (Engraulis encrasicolus). Dryad Digital Repository:http://dx.doi.org/10.5061/dryad. j8p21.
collections (archived DNA) offers the opportunity to investigate the temporal dynamics of fish populations [2].
Several key variables influencing the evolutionary potential of fish populations and conser-vation status can be evaluated using archived DNA [5]. This approach has successfully detected the loss of genetic variability as a consequence of natural fluctuations in population census size (Nc) [2,3,5]. Many marine fishes with largeNcare thought to be sheltered from rapid genetic
collapse because of large population sizes, but recent genetic studies cast doubt on this conclu-sion [6,7]. Temporal genetic analyses of archived samples have also demonstrated that fishing can lead to the loss of allelic richness and heterozygosity in over-exploited marine populations, indicating that overharvesting can drive the loss of evolutionary potential [8–11]. The analysis of archived DNA can provide estimates of effective population size (Ne),“the size of an ideal
population (i.e., with discrete generations, random mating, and constant population sizes) that would undergo the same amount of genetic drift, measured by the rate of loss of heterozygosity, as the actual population”[12].Neis a key conservation parameter, which represents the
“genetic currency”of evolutionary potential of a population [2,13].Nemeasures the extent of
genetic erosion by genetic drift and, together with life history traits of a species, can predict future population viability [13].
Among marine species, small pelagic fish periodically experience rapid fluctuations inNc
[14,15], but the mechanisms leading to the rapid loss of individuals are still uncertain [16,17]. Many stocks of small pelagic fishes are the targets of intensive fishing throughout the world. Unfortunately, how fishing activities influence local fluctuations inNcand the effect on the
evolutionary dynamics of local populations are not fully understood [8]. The Mediterranean area is one of the most exploited in the world with over 80% of its stocks are facing overex-ploited [18]. In recent years, European anchovy (Engraulis encrasicolus, hereafter“anchovy”) stocks were over-exploited in two Spanish GSAs (Geographical Sub-Areas) (GSA 1 and GSA 6) [18], and signs of overfishing were found in the northern Adriatic Sea (GSA 17) [19]. Adriatic anchovy populations have experienced strong fluctuations over the past four decades [20–23]. A decline, beginning in 1978, led to a stock collapse in 1987, with a recent partial recovery [24]. The 1987 stock collapse was preceded by low recruitment in 1986 and 1987 [25]. Recruitment failure has been suggested for the anchovy stock collapse, but the effects of intense fishing pres-sure cannot be excluded [21,26]
Recent genetic studies of small pelagic fishes other than anchovies show that temporal varia-tion inNeand genetic diversity is often lower than previously believed [6,27]. These studies
suggest that both fishing and other factors, such as environment shifts and interactions with other species, can lead to the loss of genetic diversity [8]. The evaluation of genetic variables can help to understand the status and factors influencing the short-term standing variation of European anchovies in the Mediterranean Sea. The goal of this study is to assess temporal genetic variation in European anchovies with a survey of microsatellite DNA extracted from archived otoliths collected over the past four decades at two sites in the Adriatic Sea. The results were used to address two questions: i) whether the large fluctuations inNcexperienced
by Adriatic anchovies produced a critical loss of genetic diversity that could lead to a loss in evolutionary potential; and ii) whether genetic population structure changed in response to the demographic fluctuations.
Materials and Methods
Samples studied
We used 408 archived anchovy specimens, each providing two otoliths. Samples were provided by the ISMAR–CNR of Ancona, Italy (Istituto di Scienze Marine–Consiglio Nazionale delle
University and Research) SP2_WP1_AZ4_UO02. Annual funds are provided by Università Politecnica delle Marche (Ancona, Italy) to Vincenzo Caputo Barucchi.
Ricerche) and were collected 1978–2000. After removal from individuals for age determination, otoliths were stored individually in plastic tubes at room temperature. We analyzed a time series of samples from two spawning grounds, the northern Adriatic (Chioggia) from 1978, 1987, 1994 and 2000, and the middle-southern Adriatic (Vieste) from 1985, 1987 and 1989 (Fig 1). Samples from these years were chosen to include the biomass fluctuations starting in the mid 1970s. This objective was easily fulfilled for samples from Chioggia, because of a more complete time series. Unfortunately, the Vieste time series was available for only 1985–1989. We used otoliths collected between May and September to include individuals collected only during the spawning period. These time series were compared with 73 contemporary fish col-lected in 2010 in surveys off Chioggia and Vieste. The number of specimens used for each sam-pling year and location appears inS1 Table.
Ethics statement
Ethical procedures were not required to manipulate specimens in this study. Tissues used in this study were recovered from previously collected otoliths and from Italian commercial catches.
Genomic DNA extraction
Genomic DNA was extracted from tissue residuals on otolith following the method described in [28]. Each set of otoliths was incubated at 55°C (up to 5 hours) in 500μL of digestion buffer (100 mmolL–1Tris–HCl, pH 8.0; 100 mmolL–1NaCl; 1 mmolL–1EDTA, pH 8.0; 0.5% SDS). EDTA and SDS concentrations in the digestion buffer were reduced according to [29]. Fin or caudal muscle tissues from contemporary samples were used for DNA extraction by standard phenol–chloroform procedures described in [30].
Fig 1. Sampling area.The solid circle indicates the location of the Chioggia time series between 1978 and 2010. The solid triangle indicates the locations of the Vieste time series between 1985 and 2010.
PCR amplification and genotyping
Samples were screened at 7 microsatellite loci that yielded short alleles less than 200 bp, a fea-ture enhancing the ability to amplify degraded DNA from archived tissues. Primers for 6 of these loci were obtained from the European anchovy genome described by [31] (Ee10) and [32] (Ee2-508, Ee2-165b, Ee2-135, Ee2-407 and Ee2-91b). Primers for the seventh locus (Eja183) was described by [33] in the Japanese anchovy (Engraulis japonicus) genome (S2 Table). However, new primers were needed to obtain molecular sizes smaller than those pro-duced by the original primers. Hence, primer sequences for these loci, except 91b and Ee2-135, were re-designed using the online program Primer3Plus (http://www.bioinformatics.nl/ cgi-bin/primer3plus/primer3plus.cgi/) [34] from their NCBI (National Center for Biotechnol-ogy Information) clone sequence references (S2 Table). Attempts to develop additional primers producing shorter alleles to increase the number of loci failed because sequence constraints did not allow the design of new primers.
PCR conditions were optimized for all loci using touchdown amplification. The PCR reac-tion mixture contained approximately 5–10 ng genomic DNA, 0.25 U Taq DNA polymerase (MyTaq, Bioline), 0.5μmolL–1of each primer, and 1× MyTaq (Bioline) Reaction buffer (15 mmolL–1MgCl2, 1.25 mmolL–1of each dNTP, plus stabilizers and enhancers) in a total
vol-ume of 10μL. Each PCR plate included a blank control, including an extra control from each DNA extraction. PCR products were separated on a 2% (w/v) agarose gel and stained with GelRed™(Biotium, Inc.) to check for size and PCR specificity. Subsequently, these products were run on a 5% denaturing polyacrylamide sequencing gel and visualized by a silver staining protocol [35]. Genotyping procedures were described in [6].
Accuracy of extraction and genotyping archived DNA
Archived DNA is particularly prone to genotyping errors due to i) its degraded nature increases the risks for allele dropout and null alleles and ii) potential contamination from exogenous DNA. To address these issues, a standardized protocol was used for DNA extraction and geno-typing. First, archived DNAs were extracted in an ancient-DNA room equipped with sterilized laboratory utensils regularly sterilized and supplies dedicated to analyzing archived materials. Secondly, DNA extractions were performed in clusters of individuals from the same locality and year. These precautions helped to avoid potential contamination of DNA between individ-uals from different years and sampling sites. To further reduce sample contamination, no con-temporary anchovy samples were processed while working on archived samples.
Genotyping errors occur primarily during PCR amplification by increasing the number of DNA copies from non-target individuals. Hence, PCRs were carried out in a separate ancient-DNA room, furnished with PCR workstations, set of pipettes, reagents and thermal cyclers used exclusively to amplify archived DNA. PCRs were carried out in single tubes and individu-als were amplified in clusters belonging to the same sampling site and year. Additional atten-tion was paid to the number of individuals amplified per PCR; less than 1/4 of the capacity of each thermal cycler was used to maximize the space between tubes. Thermal cyclers were steril-ized by UV light and by cleaning with 10–20% bleach before PCR.
Genotypes were not clearly detectable after these three trials were excluded from the dataset. A set of 10 individuals were randomly selected from each site and genotyped again as quality controls.
Finally, the probability of identity,PID, and probability of siblings,PID(sib), were used to test
whether contamination biased genotype quality of our dataset.PID, the probability that two
unrelated individuals in a dataset will have the same multilocus genotype by chance, andPID (sib), an analogous that takes inbreeding into account, were calculated with GenAlEx 6.502 [36].
Since we analyzed years and sampling locations independently, we assumed that DNA contam-ination would only be by individuals in the same sample. Therefore, cross-contaminated DNA should share more common genotypes than non-contaminated DNA. Thresholds for detecting contaminated samples were set atPID>0.001–0.0001 andPID(sib)>0.01, as proposed by [37].
Statistical treatment of data
We estimated genetic diversities from genotypic and allelic frequencies only after checking the quality of the genotypes (amplification success rate and genotype consistency) and the occur-rence of null alleles and other genotyping errors (allele dropout and stutter peaks) using MICRO-CHECKER 2.2.1 [38]. Loci affected by null alleles were corrected following the Brook-field algorithm [39]. Mean number of alleles observed for each locus (NA), allelic richness (RS),
observed (Ho) and expected (He) heterozygosities, and the inbreeding coefficient (FIS) were
estimated with FSTAT 2.9.3 [40]. Linkage disequilibrium between loci was tested with a Monte Carlo Markov Chain (MCMC) test executed by 1000 batches of 2000 iterations each, using Genepop 4.0.10 [41]. A sequential Bonferroni adjustment of P-values was applied to account for an increase in type-I error from multiple comparisons [42]. Outlier loci were detected by departures from the neutral expectations withfdist[43] implemented in Lositan [44] and a LnRH method developed for microsatellites [45] (S1 File).
Temporal variation in genetic diversity was quantified using estimates of expected (He) and
observed (Ho) heterozygosity and the expected number of alleles (NA). Since estimates of
genetic diversity can be biased by differences in sample sizes, the software POPTOOLS 3.1.0 [46] (http://www.cse.csiro.au/poptools) was used to standardize and analyze temporal trends in these variables. Estimates were standardized by generating 1000 'real' samples (n = 24) with sampling without replacement for each year and location (Chioggia and Vieste). A total of 9000“real”samples were generated. In addition, 9000“randomized”samples were generated pooling together the samples from the Chioggia and Vieste time series. Statistical significances of temporal trends were estimated by calculating the slope (b) and the Pearson’s correlation coefficient (r) of linear regressions ofHe,Ho, andNAagainst years. The r and b estimates of
"real" parameters for each year in both the Chioggia and Vieste time series were compared with randomized values, using MCMC chains of 1000 iterations. We evaluated the significance of trends inHe,Ho, andNAover the entire time-series and between consecutive years.
Effective population size (Ne) was estimated using a moment-based temporal method and a
coalescent likelihood-based method. These methods are generally robust and are often used on historical time series [13]. Both temporal methods use changes in allele frequencies between two samples separated by a known number of generations. Since anchovies become mature at one year of age [24], one generation per year was assumed. Following [47],Newas also
esti-mated over the whole timeframe of each time series to detect consistency with estimates obtained from intermediate temporal timeframes. NE-ESTIMATOR 2.01 [48] was used to esti-mate moment-basedNevalues. We implemented the following procedures: i) we used Plan II
we estimated 95% confidence intervals from jackknifing, and iv) we used a threshold of 0.01 as the lowest allele frequency considered to estimateNevalues, because allele frequencies were
sel-dom lower than 0.01. The TM3 software [50] was used to obtain coalescent likelihood-based estimates ofNe. TM3 uses a Bayesian approach based on coalescent theory and MCMC
simula-tions to generate a posterior distribution ofNevalues. In addition, we used maximumNevalues
(Ne MAX) and the number of generations between consecutive samples (T) as priors in the TM3 simulations. To test for consistency between simulations, three independent runs were performed using Ne MAXes equal to 1000, 5000, and 10,000. Simulations were performed with 20,000 MCMC iterations and were conducted separately for Chioggia and Vieste samples.
Estimates ofNefrom the moment-based temporal method were used to provide temporal
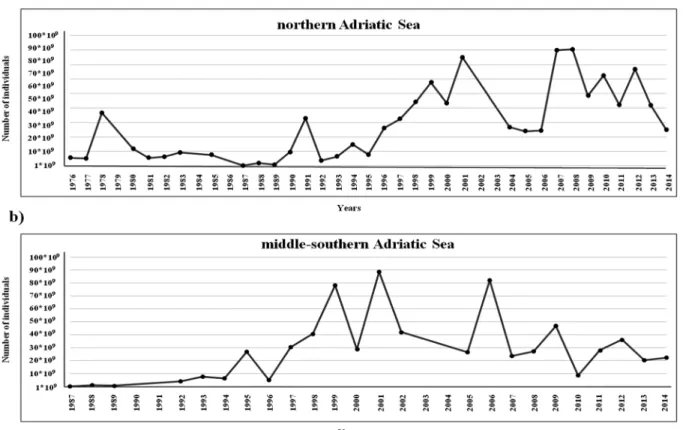
trends inNe/Ncratios from both time series. Estimates ofNcwere obtained from annual
acous-tic surveys (MEDIAS Project,http://www.medias-project.eu;Fig 2) [22,23] for stocks in the northern and middle-southern Adriatic Sea.
Datasets were tested for genetic population bottleneck signatures with a heterozygosity-excess based method implemented in BOTTLENECK 1.2 [51]. This test assumes that during a strong reduction in population size, allele numbers decline faster thanHe. Since expected
het-erozygosity at mutation–drift equilibrium (Heq) is calculated from the number of observed
alleles,Hebecomes larger thanHeq,leading to heterozygosity excess (Hexc) [52]. Values ofHexc
were tested with Wilcoxon’s signed rank tests [53], a powerful and robust test when the dataset contains few (<20) polymorphic loci [51]. We used 1000 iterations and three mutational
Fig 2. Graphical representation of temporal trends of anchovy population abundance (expressed as number of individuals) obtained from annual MEDIAS acoustic surveys data (black dots).(a) trend of abundance in the northern Adriatic Sea. (b) trend of abundance in the middle-southern Adriatic Sea.
models: infinite allele model (IAM), stepwise mutation model (SMM), and a two phase muta-tion model (TPM) with 95% single-step mutamuta-tions and 5% multistep mutamuta-tions, as recom-mended in [51].
In addition, purported bottlenecks were verified by simulating bottlenecked populations using BOTTLESIM 2.6 [54]. Genotypic data for CH78 and VI85 were used independently as founder populations to simulate bottleneck events lasting 32 and 25 generations, respectively. Population declines were tested using 1000 iterations with the following criteria: dioecious organisms with random mating system, balanced sex ratio (1:1), two years of expected lifespan for the species, given its high natural mortality [19], one year at first reproduction [24], and 90% generational overlap. The moment-basedNeestimates from NE-ESTIMATOR were used
as analogues of population size. Simulated values ofHeandNAwere plotted and compared
with observedHeandNAestimates to provide evidence of a population bottleneck.
Finally, we estimated the degree of geographic and temporal variability among samples first with pairwise values ofθST[55], calculated with FSTAT and second with a Bayesian approach,
implemented in STRUCTURE 2.3.2.1 [56,57]. The second approach estimates the number of populations (K) under Hardy–Weinberg expectations and linkage equilibrium. The most prob-able number was tested using priors ranging fromK= 1 toK= 6, under an admixture model and with correlated allele frequencies. Ten independent runs were performed for eachKusing an MCMC of 500,000 iterations after a burn-in of 50,000 iterations.
Results
Missing genotypes accounted for 7.51% of the overall dataset. A pool of 90 individuals were randomly chosen (10 individuals per sampling year and site) to re-genotype 7 of the screened loci (a total of 630 control genotypes were produced). We were unable to PCR-amplify 2.3% of control genotypes (15 of 630), but the remaining 615 genotypes were consistent with their first molecular size detection. There was a lack of allele dropout and stuttering throughout the entire dataset. The occurrence of null alleles was detected in 16 of 63 tests, and after the Brook-field correction [39] 6 of 63 remained significant. Since the BrookBrook-field correction improved our dataset, and no loci showed a systematic presence of null alleles, the entire corrected dataset was used for subsequent statistical analyses.
PIDvalues ranged from 7.731 x 10⁻⁹(CH87) to 2.854 x 10⁻⁷(CH94), andPID(sib)values
ran-ged from 1.133 x 10⁻³(CH87) to 2.743 x 10⁻³(CH94) (S3 Table). Both values were lower than expected thresholds for unrelated or unbiased multilocus genotypes, suggesting enough power and sufficient quality of the data.
The observed number of alleles ranged from 7 (Ee2-165m) to 38 (Ee2-407m) across sam-ples. MeanNAranged from 9.143 (CH10) and 12.000 (VI89 and VI10), whereasRSranged
from 6.982 (CH94) to 8.769 (VI87). MeanHeranged from 0.703 (CH94) to 0.767 (CH87 and
CH10), while meanHovaried from 0.590 (CH87) to 0.746 (CH00) (S4 Table). There were 4 of
63 significantFISvalues (critical P<0.00079). Two deviations were related to the Ee2-165m
locus and led to heterozygote excesses in samples CH94 and CH00, while the remaining two were related to the Ee2-407m locus and suggested heterozygote deficiency in CH87, and VI87 (S4 Table). Significant heterozygote deficits were found in samples CH78, CH87, and VI10 (S4 Table), and for the Ee2-407m locus overall. No evidence for linkage disequilibrium was detected.
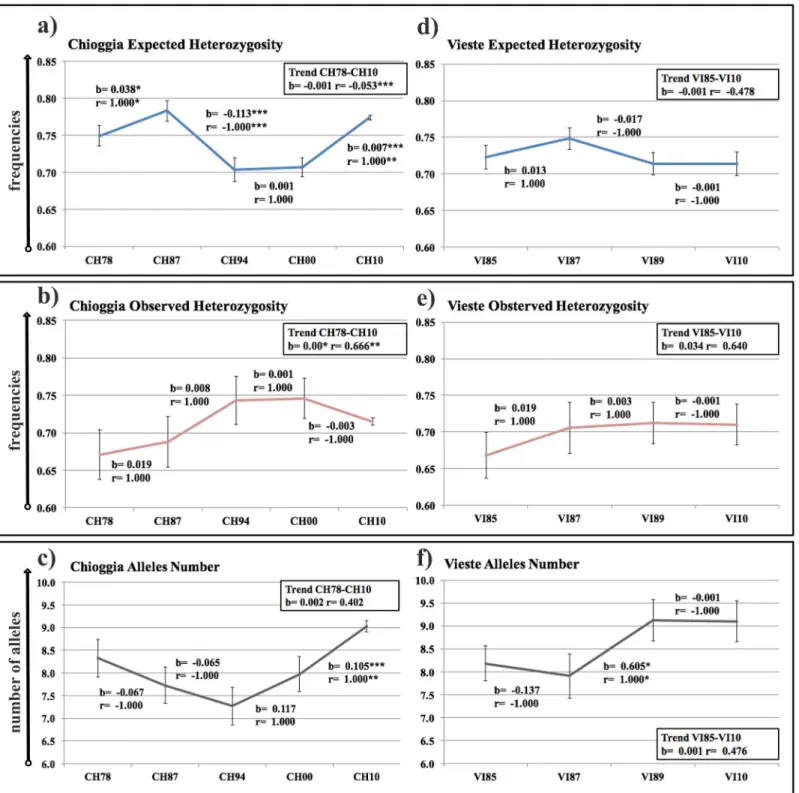
The overall temporal trends inHe,Ho, andNAof the Chioggia time series indicated a
signifi-cant overall decrease inHe(r= -0.053,P<0.001;b= -0.001,P>0.05), a significant overall
increase inHo(r= 0.666,P<0.01;b= 0.002,P<0.05), and a non-significant overall increase
Fig 3. Temporal changes in estimates of expected (He) and observed (Ho)heterozygosities, and mean number of alleles (NA).Panels (a) (He), (b)
(HO) and (c) (NA) depict temporal trends at Chioggia, and panels (d) (He), (e) (Ho) and (f) (NA) depict temporal trends at Vieste. Standard deviation intervals
are provided for each sample, estimated from 1000 resampled samples per year and standardized at 24 individuals. Statistical significances ofb(slope) and
r(Pearson’s regression coefficient) indicate global trends (into the box to the left of each panel) and trends from consecutive temporal samples (above or below each timeframe considered). Level of significance:*P<0.05;**P<0.01;***P<0.001.
significant decreasing trend was observed inHebetween CH87 and CH94 (Fig 3a;r= -1.000,
P<0.001;b= -0.113,P<0.001), whereas significant increasing trends were observed inHe
between CH78–CH87 (Fig 3a;r= 1.000,P<0.05; b = 0.038,P<0.05) and between
CH00-CH10 (Fig 3a;r= 1.000, P<0.01; b = 0.007,P<0.001), as well as, inNAbetween
CH00–CH10 (Fig 3c;r= 1.000,P<0.01;b= 0.105,P<0.001). The Vieste time series showed
a non-significant overall decrease inHe(r= -0.474,P>0.05;b= -0.001,P>0.05), a
non-sig-nificant overall increase inHo(r= 0.481,P>0.05;b= 0.001,P>0.05) and a non-significant
overall increase inNA(r= 0.640,P>0.05;b= 0.034,P>0.05) (Fig 3d, 3e and 3f). Uniquely,
the VI87–VI89 trend showed a significant increase inNA(Fig 3f;r= 1.000, P<0.05;b= 0.605,
P<0.05).
Moment-based estimators yieldedNevalues between 103.50 and 416.70 from the Chioggia
time series (Table 1) and values between 68.00 and 891.20 from the Vieste time series (Table 1). Estimates from the overall timeframes showedNevalues of 597.70 in Chioggia and
666.70 in Vieste (Table 1).
The TM3 coalescent likelihood-based method showedNebetween 161.15 and 2373.85 for
the Chioggia time series (Table 2) and between 134.17 and 2883.85 for the Vieste time series (Table 2). For both sets of estimates, the overallNeestimates were consistent with the
magni-tudes of shorter timeframes estimates.
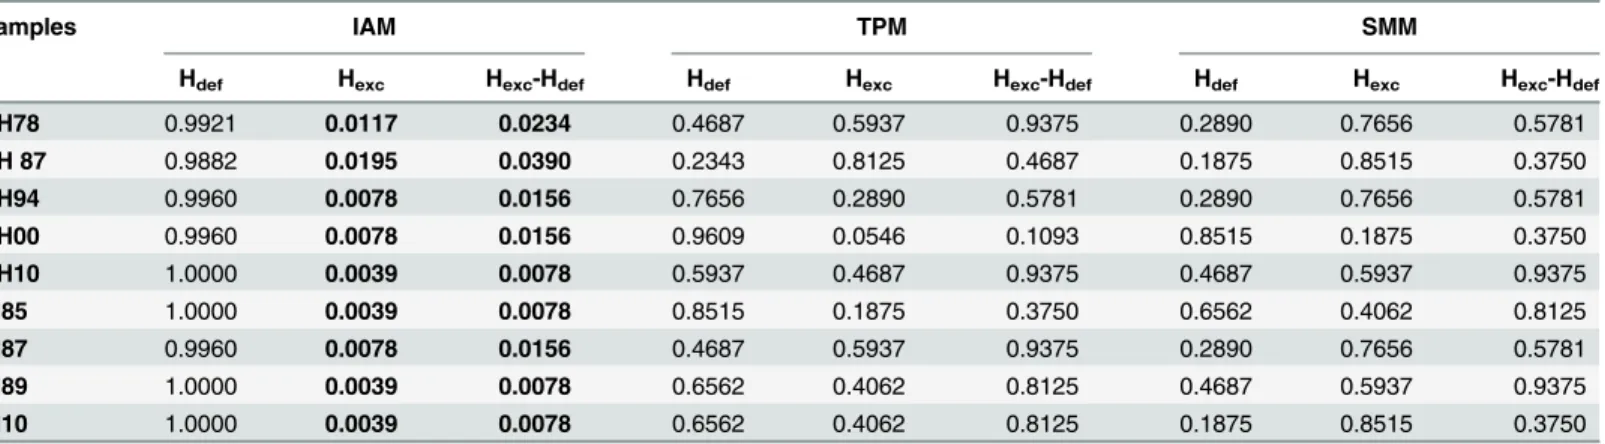
The results of the BOTTLENECK analysis using the IAM mutation model showed signifi-cant tests for heterozygosity excesses (Hexc) in every sample for both“one-tail”and“
two-tailed”Wilcoxon’s tests (Table 3). In contrast, tests using the SMM and TPM mutation models
Table 1. Temporal moment-based effective genetic size estimates.NG= number of generations between a pair of samples.Ne= effective genetic size
estimate. Lower and upper 95% CI represents a 95% Confidence Interval (CI) forNeestimated for each pair of samples.Ne/Ncratio = ratio between effective population size (estimated from temporal moment-based method) and census size (obtained from MEDIAS acoustic survey data;Fig 2). NA = not available data.
Timeframe NG Ne Lower 95% CI Upper 95% CI Ne/Ncratio
CH78-87 9 167.00 104.00 284.50 1.90*10−8CI
(1.18*10−8– 3.23*10−8)
CH87-94 7 103.50 56.00 197.30 8.26*10−8CI
(4.47*10−8– 1.57*10−7)
CH94-00 6 221.70 104.00 646.10 1.12*10−8CI
(5.20*10−9– 3.27*10−8)
CH00-10 10 416.90 171.10 3749.00 1.05*10−8CI
(4.31*10−9– 9.45*10−8)
CH78-10 32 597.70 342.40 1199.50 1.50*10−7CI
(8.59*10−8– 3.01*10−7)
VI85-87 2 68.00 23.60 588.30 NA
VI87-89 2 75.00 27.30 526.30 3.10*10−7CI
(1.13*10−7– 2.18*10−6)
VI89-10 21 891.20 444.20 2496.40 1.47*10-7CI
(7.35*10−8– 4.13*10−7)
VI85-10 25 666.70 247.50 2864.90 3.89*10-7CI
(1.44*10−7– 1.67*10−6)
were not significance (Table 3). The Shift-Mode tests revealed normal L-shaped allele fre-quency distributions in all the samples.
Simulated population bottlenecks indicated the likely occurrence of bottlenecks in both the Chioggia and Vieste time series, based on comparisons between simulated and observed expected heterozygosity (He) values. Similar values between simulated and observedHewere
found for CH78, CH94, and CH00 in the Chioggia time series (Fig 4a), whereasHevalues for
CH87 and CH10 were outside the confidence interval (Fig 4a). In the Vieste time series, simu-lations showed similar simulated and observedHevalues for VI85, VI87, and VI89, whereas
VI10 was placed outside the confidence interval (Fig 4b). Observed values ofNAwere
consis-tent with simulatedNAfor CH78 and CH87 in the Chioggia time series and for VI85 and VI87
in the Vieste time series.
Estimates ofθSTrevealed 9 significant tests among 36 total pairwise comparisons (Table 4).
These significant comparisons were largely between localities and years (i.e. significant tests were CH87-VI85, CH94-VI85, CH94-VI89, CH00-VI85, CH00-VI89, CH10-VI89) (Table 4). Genetic variation varied little with time within each time series. In fact, in the Chioggia time
Table 2. Temporal TM3 coalescent-based effective population size estimates.NG= number of generations between a pair of samples.Ne= effective
population size estimate. Lower and Upper 95% CI = represents a 95% Confidence Interval (CI) forNeestimated for a pair of samples. Ne MAX = maximum
prior effective population size defined in coalescent-based simulations. Values in bold represent the most likely coalescent estimates based on higher 95% CI limit per simulation.
Ne MAX = 1000 Ne MAX = 5000 Ne MAX = 10000
Timeframe NG Ne Lower 95% CI Upper 95% CI Ne Lower 95% CI Upper 95% CI Ne Lower 95% CI Upper 95% CI
CH78-87 9 282.79 148.51 464.09 258.31 163.58 523.98 270.47 145.12 460.43
CH87-94 7 161.15 96.14 260.52 149.69 92.47 272.03 145.78 90.48 226.06
CH94-00 6 817.52 314.40 1000.00 1000.77 257.99 5000.00 680.22 0.00 10000.00
CH00-10 10 984.40 387.64 1000.00 1162.30 323.83 5000.00 2373.85 118.03 10000.00
CH78-10 32 950.69 529.09 1000.00 1026.87 493.44 4370.12 1086.84 419.73 4805.98
VI85-87 2 182.23 66.81 777.09 149.76 0.00 577.55 153.22 0.00 560.15
VI87-89 2 134.17 67.96 383.19 119.02 33.26 456.84 250.03 0.00 1591.39
VI89-10 21 991.57 752.78 1000.00 4675.32 1202.63 5000.00 2883.85 977.89 10000.00
VI85-10 25 990.87 823.19 1000.00 1740.50 812.00 5000.00 1612.00 890.08 5760.81
doi:10.1371/journal.pone.0151507.t002
Table 3. BOTTLENECK 1.2 results.IAM = Infinite Allele Model; TPM = Two Phase Mutation Model; SMM = Stepwise Mutation Model.Hdef= One-tailed het-erozygosity deficiency test;Hexc= One-tailed heterozygosity excess test;Hexc–Hdef= Two-tailed heterozygosity deficiency or excess test. Values in bold are
significant P-values (P<0.05).
Samples IAM TPM SMM
Hdef Hexc Hexc-Hdef Hdef Hexc Hexc-Hdef Hdef Hexc Hexc-Hdef
CH78 0.9921 0.0117 0.0234 0.4687 0.5937 0.9375 0.2890 0.7656 0.5781
CH 87 0.9882 0.0195 0.0390 0.2343 0.8125 0.4687 0.1875 0.8515 0.3750
CH94 0.9960 0.0078 0.0156 0.7656 0.2890 0.5781 0.2890 0.7656 0.5781
CH00 0.9960 0.0078 0.0156 0.9609 0.0546 0.1093 0.8515 0.1875 0.3750
CH10 1.0000 0.0039 0.0078 0.5937 0.4687 0.9375 0.4687 0.5937 0.9375
VI85 1.0000 0.0039 0.0078 0.8515 0.1875 0.3750 0.6562 0.4062 0.8125
VI87 0.9960 0.0078 0.0156 0.4687 0.5937 0.9375 0.2890 0.7656 0.5781
VI89 1.0000 0.0039 0.0078 0.6562 0.4062 0.8125 0.4687 0.5937 0.9375
VI10 1.0000 0.0039 0.0078 0.6562 0.4062 0.8125 0.1875 0.8515 0.3750
Fig 4. BOTTLESIM simulation.(a) Trend (solid line) ofHeand (b)NAsimulated values for a population (represented by CH78) experiencing a bottleneck for over 32 generations (years). Red squares represent the observed (a)Heand (b)NAvalues in CH78, CH87, CH94, CH00, and CH10. (c) Trend (solid line) of Heand (d)NAsimulated values for a population (represented by VI85) that went through a bottleneck for over 25 generations (years). Red squares represent
the observed (c)Heand (d)NAvalues in VI85, VI87, VI89, and VI10. Light grey bars are standard errors for simulated values.
doi:10.1371/journal.pone.0151507.g004
Table 4. Pairwise multilocus estimates ofθST.Bold values are significant after a sequential Bonferroni correction [42] for 36 multiple tests (P<0.0014).
CH78 CH87 CH94 CH00 CH10 VI85 VI87 VI89
CH87 0.0169
CH94 0.0061 0.0198
CH00 0.0154 0.016 0.0048
CH10 0.0078 0.0069 0.0078 0.0074
VI85 0.018 0.0238 0.0107 0.0197 0.0079
VI87 0.0048 0.0217 0.0176 0.0233 0.0149 0.0186
VI89 0.0139 0.022 0.0078 0.0157 0.0189 0.0053 0.0209
VI10 0.0077 0.009 0.0049 0.0104 -0.0021 0.0111 0.0175 0.0052
series only the CH94-CH00 comparison was statistically significant, whereas two tests (VI85-VI89 and VI85-VI10) were significant in the Vieste time series (Table 4).
STRUCTURE analysis showed a lack of genetic structure between and within the Chioggia and Vieste time series. The greatest likelihood indicated a single population,K= 1 [LnP(K) = -10843.28] (S1 Fig).
Outcomes from the neutrality tests are available inS1 Fileand inS5andS6Tables.
Discussion
The extent of genetic variability estimated from both time series revealed the effectiveness of using archived DNA for population genetics studies. Otolith collections represent valuable sources of material for historical comparisons of genetic variation among locations or temporal variation within locations. Major challenges with the use of archived tissues are the reliability of results in light of potential DNA contamination and the level of polymorphism of the molec-ular marker. In the first case, we took considerable precautions to avoid DNA contamination. Genotypes were consistent between initial genotyping and re-genotyping some numerous indi-viduals, indicating genotype quality. The amount of missing data was similar with that in other studies in which archived DNA from otoliths was used [6,58–60]. In addition, the comparison between polymorphisms detected in the oldest and newest samples confirmed no age-related failure in genotyping. A new set of PCR primers for seven microsatellite loci yielding
products<200 bp produced a high degree of amplification success, with amplification success
was between 68.75% and 100%. The number of loci genotyped in this study is similar to the mean number of loci typed in other archived DNA studies [6,58–60].
Loss of genetic variability as a consequence of demographic collapse
Temporal trends in genetic variables are concordant with abundance trends in the Chioggia and Vieste time series. However, the Chioggia time series showed greater changes in genetic variables than the Vieste time series. In the Chioggia time series, a significant reduction inHeappeared after the population collapse in 1987 and lasted until 1994. This observation was additionally confirmed by a decrease inNAfrom 1978 to 1994 and supports the idea of
differ-ent responses ofHeandNAto demographic declines [61]. After 2000, bothHeandNA
increased in the Chioggia time series in association with a growing population biomass in northern Adriatic Sea [22]. Values ofHealso declined in the middle-southern Adriatic basin
(Vieste), but this drop was not statistically significant. However, values ofNAincreased
signifi-cantly after 1989. These results clearly show the influence of demographic fluctuations on genetic variability of Adriatic anchovies, which has also been observed in other marine popula-tions [6,62]. These results add to a growing number of studies showing a large contrast between the genetic effective population size and census in marine species [63].
Even though a significant reduction inHein northern Adriatic anchovies is consistent with
a bottleneck inNeand with a recent 10 to 20-fold drop in fishery biomass [19,20,22], the
results from the heterozygosity excess test did not support this scenario. This outcome may be due to two mechanisms. First, the loss of genetic diversity after demographic decline may not have been strong enough to produce genetic profiles leading to heterozygosity excess. This weak-effect hypothesis, however, is inconsistent with the temporal drop inHein response to
variation inNe[65], and this is consistent with our observations of a relatively small range of
Neamong samples from Chioggia from 1978 to 2000, as well as that among samples from
Vieste from 1985 to 1989.
The use of demographic simulations with BOTTLESIM showed that most of the observed
Hevalues between 1978 and 2000 in Chioggia and between 1985 and 1989 in Vieste, may be
consistent with the loss of genetic variability as a consequence of a bottleneck. ObservedNA
values between 1978 and 1987 in Chioggia and between 1985 and 1987 in Vieste were close to simulated values. These simulations also indicated a decrease in genetic diversity in the late 1980s that is consistent with bottlenecks in population size.
Reduced genetic variability as a consequence of a bottleneck, especially in the northern Adriatic Sea, is also indicated by significant deviations from Hardy-Weinberg expectations for Chioggia in 1978 and 1987, as a consequence of homozygote excess. These genetic signals sup-port the hypothesis that a reduction in genetic variability began earlier than the decline in effec-tive population size. Although unlikely in small pelagic fishes, other marine species
characterized by high fecundities and a high variance in reproductive success (sweepstakes recruitment) often show signs of inbreeding [7,66,67].
Evolutionary potential and effective population sizes in anchovies
The MCMC methods used to evaluate temporal variability inNein the Chioggia and the Vieste
time series were characterized by good converges for this parameter, which gives some confi-dence in the results. We observed low levels of effective population sizes (Ne) of only 100s of
fish in the pre-collapse and early post-collapse periods in both historical time series. These results indicate that the reductions in genetic diversity were largely driven by genetic drift [13] and that genetic diversity dropped before the population collapse in 1987. Estimates ofNefrom
pre-collapse years were as low as those for 1987. Our global estimates ofNefor Adriatic
anchovy indicate values ofNebetween one hundred and a few thousand fish, values that have
previously been reported in other small pelagics, such as European sardines [6,12,27], and in other marine organisms characterized by high fecundity, type III survivorship and sweepstakes recruitment [8,62,66]. These small effective population sizes challenge the idea that marine populations are invulnerable and inexhaustible resources by virtue of their huge census sizes [8,12].
Estimates ofNe/Ncin Adriatic anchovies was between 10−6and 10−8orders of magnitude
and are smaller than those typical of many marine species (Ne/Nc10−5) [13]. These small
ratios indicate that the large variance in reproductive success can lead to the demographic instability. Although the primary intent of this article was not to provide advice to manage-ment, it is nevertheless important to compare our temporal estimates ofNewith conservation
guidelines provided by the revised 50/500 rule [68]. The 50/500 rule recommends that popula-tions be maintained at sizes larger than 50 individuals over the short term and at least 500 indi-viduals over the long term to avoid inbreeding and the loss of genetic diversity, and at sizes larger than 500–1000 to indefinitely retain evolutionary potential [reviewed in 68]. In our results, anchovy pre- and immediately post-population collapse showed estimates ofNethat
come close to those recommended by 50/500 rules, suggesting that severe population declines place Adriatic anchovies at risk of losing evolutionary potential in the absence of stable connec-tivity among anchovy subpopulations in the Adriatic basin.
Temporal population genetic integrity
middle-southern samples and among temporal samples in these areas. We detected a lack of genetic differentiation and a single population comprising all the Chioggia and Vieste samples. The occurrence a single genetic stock is also confirmed by a microsatellite study of samples from throughout the Adriatic basin (Ruggeri et al. in preparation). The lack of temporal vari-ability confirms that this genetic composition has been maintained over at least the past four decades. Similar evidence was found in other temporal studies of small pelagics [6,69] and other commercially exploited demersal fishes [58,70]. The increasing trends inHe,NAandNe
over time indicates that both localities have recovered from a population bottleneck, but that the recovery appears to have started earlier in Vieste (from 1989) than in Chioggia (from 1994). The relative geographic genetic homogeneity of anchovy populations in the Adriatic (Ruggeri et al. in preparation) may indicate that migration between subpopulations is impor-tant for the recovery of genetic diversity in local populations. In this way, migration between the Chioggia and Vieste populations likely led to the recovery of most of the genetic diversity lost in the Chioggia population over about seven generations.
Conclusions
This study confirms the utility of archived DNA to address evolutionary and fishery-related problems. Our results indicate that, contrary to the common assumption that abundant spe-cies, such as anchovies, are not immune to the loss of genetic variability, because sweepstakes recruitment can lead to small effective population sizes. The effective population sizes of Adri-atic anchovies are several orders of magnitude smaller than census population sizes. This large discrepancy indicates that anchovy populations are more vulnerable to fishery pressures and environmental change than previously thought, and these small effective sizes must be taken into account in the management of fishery harvests. Our results also indicate that temporal genetic data provides an assessment of the impact of demographic disturbances on the persis-tence of local populations.
Supporting Information
S1 Fig. Graphical plot of mean Ln[P(K)] from STRUCTURE [56,57] simulation. (DOCX)
S1 File. Describe the outliers`detection methods in details and provide results for these tests.
(DOCX)
S1 Table. Historical collection, specimens and data collection. (DOCX)
S2 Table. Molecular markers information.Microsatellite loci primer sequences, reference genome and authors.
(DOCX)
S3 Table. Locus-by-locus Probability of Identity (PID) and Probability of Identity of Sib-lings (PID(sib)) estimations [36].
(DOCX)
S4 Table. Summary of genetic diversity observed at 7 microsatellite loci from the sampled archived materials.
S5 Table.FSTvalues and significances from thefdist[43] outlier detection test. (DOCX)
S6 Table. Results from the LnRH method [45] to detect outlier loci. (DOCX)
Acknowledgments
Special thanks are provided to Stewart Grant, Erik Sotka and two anonymous reviewers who greatly helped us to improve this manuscript and allowed us to tackle the major criticisms and a huge thank you to Tara Baris who helpfully edited an early draft of the manuscript to improve readability. This research was mainly supported by Università Politecnica delle Marche (Ancona, Italy).
Author Contributions
Conceived and designed the experiments: PR A. Splendiani VCB. Performed the experiments: PR CDM TF PNC. Analyzed the data: PR IB ADF PC. Contributed reagents/materials/analysis tools: VCB MG A. Santojanni IL EA. Wrote the paper: PR A. Splendiani MG VCB.
References
1. Schoener TW. The newest synthesis: understanding the interplay of evolutionary and ecological dynamics. Science. 2011; 331: 426–429. doi:10.1126/science.1193954PMID:21273479
2. Nielsen EE, Hansen MM. Waking the dead: the value of population genetic analyses of historical sam-ples. Fish Fisher. 2008; 9(4): 450–461. doi:10.1111/j.1467-2979.2008.00304.x
3. Speller CF, Hauser L, Lepofsky D, Moore J, Rodrigues AT, Moss ML, et al. High potential for using DNA from ancient herring bones to inform modern fisheries management and conservation. Plos One. 2012; 7(11): e51122. doi:10.1371/journal.pone.0051122PMID:23226474
4. Campana SE, Thorrold SR. Otoliths, increments and elements: keys to comprehensive understanding of fish populations? Can J Fisher Aquat Sci. 2001; 58: 30–38. doi:10.1139/f00-177
5. Habel JC, Husemann M, Finger A, Danley PD, Zachos FE. The relevance of time series in molecular ecology and conservation biology. Biol Rev Camb Philos Soc. 2014; 89: 484–492. doi:10.1111/brv. 12068PMID:24251767
6. Ruggeri P, Splendiani A, Bonanomi S, Arneri E, Cingolani N, Santojanni A, et al. Temporal genetic vari-ation as revealed by a microsatellite analysis of European sardine (Sardina pilchardus) archived sam-ples. Can J Fish Aquat Sci. 2012; 69(10): 1698–1709. doi:10.1139/f2012-092
7. O’Leary SJ, Hice LA, Feldheim KA, Frisk MG, McElroy AE, Fast MD, et al. Severe inbreeding and small effective number of breeders in a formerly abundant marine fish. Plos One. 2013; 8(6): e66126. doi:10. 1371/journal.pone.0066126PMID:23762473
8. Pinsky ML, Palumbi SR. Meta-analysis reveals lower genetic diversity in overfished populations. Mol Ecol. 2014; 23: 29–39. doi:10.1111/mec.12509PMID:24372754
9. Allendorf FW, Berry O, Ryman N. So long to genetic diversity, and thanks for all the fish. Mol Ecol. 2014; 23: 23–25. doi:10.1111/mec.12574PMID:24372752
10. Marty L, Dieckmann U, Ernande B. Fisheries-induced neutral and adaptive evolution in exploited fish populations and consequences for their adaptive potential. Evol Appli. 2015; 8(1): 47–63. doi:10.1111/ eva.12220
11. Bonanomi S, Pellissier L, Overgaard Therkildsen N, Berg Hedeholm R, Retzel A, Meldrup D, et al. Archived DNA reveals fisheries and climate induced collapse of a major fishery. Sci Rep. 2015; 5: 15395. doi:10.1038/srep15395PMID:26489934
12. Gaggiotti OE, Vetter RD. Effect of life history strategy, environmental variability, and overexploitation on the genetic diversity of pelagic fish populations. Can J Fish Aquat Sci. 1999; 56: 1376–1388.
14. Grant WS, Bowen BW. Shallow population histories in deep evolutionary lineages of marine fishes: insights from sardines and anchovies and lessons for conservation. J Hered. 1998; 89: 415–426. doi: 10.1093/jhered/89.5.415
15. Ganias K, Somarakis S, Nunes C. Reproductive potential in Biology and Ecology of Sardines and Anchovies. 2014; CRC Press, Taylor & Francis Eds., Boca Raton (Florida, USA).
16. Alheit J, Licandro P, Coombs S, Garcia A, Giráldez A, Garcia Santamaría MT, et al. Atlantic Multideca-dal Oscillation (AMO) modulates dynamics of small pelagic fishes and ecosystem regime shifts in the eastern North and Central Atlantic. J Mar Syst. 2014; 133: 88–102. doi:10.1016/j.jmarsys.2014.02.005 17. Van Beveren E, Bonhommeau S, Fromentin JM, Bigot JL, Bourdeix JH, Brosset P, et al. Rapid changes
in growth, condition, size and age of small pelagic fish in the Mediterranean. Mar Biol. 2014; 161(8): 1809–1822. doi:10.1007/s00227-014-2463-1
18. Colloca F, Cardinale M, Maynou F, Giannoulaki M, Scarcella G, Jenko K, et al. Rebuilding Mediterra-nean fisheries: a new paradigm for ecological sustainability. Fish Fisher. 2013; 14(1): 89–109. doi:10. 1111/j.1467-2979.2011.00453.x
19. Carpi P, Santojanni A, Donato F, Colella S,ČikešKečV, Zorica B, et al. A joint stock assessment for the anchovy stock of the northern and central Adriatic Sea: comparison of two catch-at-age models. Sci Mar. 2015; 79(1): 57–70. doi:10.3989/scimar.03903.29A
20. Santojanni A, Arneri E, Barry C, Belardinelli A, Cingolani N, Giannetti G, et al. Trends of anchovy (Engraulis encrasicolus, L.) biomass in the northern and central Adriatic Sea. Sci Mar. 2003; 67 (3): 327–340.
21. Santojanni A, Arneri E, Bernardini V, Cingolani N, Di Marco M, Russo A. Effects of environmental vari-ables on recruitment of anchovy in the Adriatic Sea. Clim Res. 2006; 31: 181–193.
22. Leonori I, De Felice A, Campanella F, Biagiotti I, Canduci G. Assessment of Small Pelagic Fish Bio-mass in the Western Adriatic Sea by Means of Acoustic Methodology. Marine research at CNR. Vol. DTA/06. 2019–2029. Fishery and Sea Resources 2011. Brugnoli E, Cavarretta G, Mazzola S, Trincardi F, Ravaioli M, Santoleri R (Editorial Board). Roma, ISSN 2239-5172,http://dta.cnr.it/
23. Leonori I, Tičina V, De Felice A, Vidjak O, GrubišićL, Pallaoro A. Comparisons of two research vessels’ properties in the acoustic surveys of small pelagic fish. Acta Adriat. 2012; 53(3): 389–398.
24. Morello EB, Arneri E. Anchovy and Sardine in the Adriatic Sea—An Ecological Review. Oceanogr Mar Biol Ann Rev. 2009; 47: 209–256.
25. Azzali M, De Felice A, Cosimi G, Luna M, Parmiggiani F. The state of the Adriatic Sea centered on the small pelagic fish populations. Mar Ecol—Evol Persp. 2002; 23(1): 78–91. doi:10.1111/j.1439-0485. 2002.tb00009.x
26. Santojanni A, Cingolani N, Arneri E, Belardinelli A, Giannetti G, Colella S, et al. Use of an exploitation rate threshold in the management of anchovy and sardine stocks in the Adriatic Sea. Biol Mar Medit. 2006; 13(3): 98–111.
27. Laurent V, Planes S. Effective population size estimation onSardina pilchardusin the Bay of Biscay using a temporal genetic approach. Biol J Linn Soc. 2007; 90: 591–602. doi:10.1111/j.1095-8312. 2007.00747.x
28. Hutchinson WF, Carvalho GR, Rogers SI. A nondestructive technique for the recovery of DNA from dried fish otoliths for subsequent molecular genetic analysis. Mol Ecol. 1999; 8: 893–894.
29. Cuveliers EL, Bolle LJ, Volckaert FAM, Maes GE. Influence of DNA isolation from historical otoliths on nuclear-mitochondrial marker amplification and age determination in an overexploited fish, the common sole (Solea soleaL.). Mol Ecol Res. 2009; 9(3): 725–732. doi:10.1111/j.1755-0998.2009.02516.x 30. Taggart JB, Hynes RA, Prodöuhl PA, Ferguson A. A simplified protocol for routine total DNA isolation
from salmonid fishes. J Fish Biol. 1992; 40(6): 963–965. doi:10.1111/j.1095-8649.1992.tb02641.x 31. Landi M, Garoia F, Piccinetti C, Tinti F. Isolation of polymorphic microsatellite loci from the European
anchovy,Engraulis encrasicolus. Mol Ecol Notes. 2005; 5: 266–268. doi:10.1111/j.1471-8286.2005. 00892.x
32. Pakaki V, Magoulas A, Kasapidis P. New polymorphic microsatellite loci for population studies in the European anchovy,Engraulis encrasicolus(L.). Mol Ecol Res. 2009; 9(5): 1406–1409. doi:10.1111/j. 1755-0998.2009.02681.x
33. Lin L, Zhu L, Liu SF, Su YQ, Zhuang ZM. Polymorphic microsatellite loci for the Japanese anchovy
Engraulis japonicus(Engraulidae). Genet Mol Res. 2011; 10(2): 764–768. doi: 10.4238/vol10-2gmr1085PMID:21563070
35. Benbouza H, Jacquemin JM, Baudoin JP, Mergeai G. Optimization of reliable, fast, cheap and sensitive silver staining method to detect SSR markers in polyacrylamide gels. Biotechnol Agron Soc Environ. 2006; 10(2): 77–81.
36. Peakall R, Smouse PE. GenAlEx 6.5: genetic analysis in Excel. Population genetic software for teach-ing and research—an update. Bioinformatics. 2012; 28(19): 2537–2539. doi:10.1093/bioinformatics/ bts460PMID:22820204
37. Waits LP, Luikart G, Taberlet P. Estimating the probability of identity among genotypes in natural popu-lations: cautions and guidelines. Mol Ecol. 2001; 10(1): 249–256. doi:10.1046/j.1365-294X.2001. 01185.xPMID:11251803
38. Van Oosterhout C, Hutchinson WF, Wills DPM, Shipley P. MICRO-CHECKER: software for identifying and correcting genotyping errors in microsatellite data. Mol Ecol Notes. 2004; 4: 535–538. doi:10. 1111/j.1471-8286.2004.00684.x
39. Brookfield JFY. A simple method for estimating null allele frequency from heterozygote deficiency. Mol Ecol. 1996; 5: 453–455. PMID:8688964
40. Goudet J. FSTAT, a program to estimate and test gene diversities and fixation indices (version 2.9.3). 2001; Available:http://www.unil.ch/izea/softwares/fstat.html
41. Rousset F. Genepop’007: a complete reimplementation of the Genepop software for windows and Linux. Mol Ecol Res. 2008; 8: 103–106. doi:10.1111/j.1471-8286.2007.01931.x
42. Rice WR. Analyzing tables of statistical tests. Evolution. 1989; 43: 223–225. doi:10.2307/2409177 43. Beaumont MA, Nichols RA. Evaluating loci for use in the genetic analysis of population structure. Proc
R Soc Lond Biol. 1996; 263: 1619–1626. doi:10.1098/rspb.1996.0237
44. Antao T, Lopes A, Lopes RJ, Beja-Pereira A, Luikart G. LOSITAN: a workbench to detect molecular adaptation based on a Fst-outlier method. BMC Bioinformatics. 2008; 9: 323–327. doi: 10.1186/1471-2105-9-323PMID:18662398
45. Kauer MO, Dieringer D, Schlötterer C. A microsatellite variability screen for positive selection associ-ated with the‘Out of Africa’habitat expansion ofDrosophila melanogaster. Genetics. 2003; 165: 1137– 1148. PMCID: PMC1462820 PMID:14668371
46. Hood G. PopTools v. 3.1.0 [online]. 2009; Available:http://www.cse.csiro.au/poptools.
47. Waples RS, Yokota M. Temporal estimates of effective population size in species with overlapping gen-erations. Genetics. 2007; 175(1): 219–233. doi:10.1534/genetics.106.065300PMID:17110487 48. Do C, Waples RS, Peel D, Macbeth GM, Tillett BJ, Ovenden JR. NEESTIMATOR v2:
re-implementa-tion of software for the estimare-implementa-tion of contemporary effective populare-implementa-tion size (Ne) from genetic data. Mol Ecol Res. 2014; 14: 209–214. doi:10.1111/1755-0998.12157
49. Pollak E. A new method for estimating the effective population size from allele frequency changes. Genetics. 1983; 104: 531–548. PMCID: PMC1202093 PMID:17246147
50. Berthier P, Beaumont MA, Cornuet JM, Luikart G. Likelihood-based estimation of the effective popula-tion size using temporal changes in allele frequencies: a genealogical approach. Genetics. 2002; 160 (2): 741–751. PMID:11861575.
51. Piry S, Luikart G, Cornuet JM. BOTTLENECK: a computer program for detecting recent reductions in the effective population size using allele frequency data. J Hered. 1999; 90(4): 502–503.
52. Cornuet JM, Luikart G. Description and power analysis of two tests for detecting recent population bot-tlenecks from allele frequency data. Genetics. 1996; 144(4): 2001–2014. PMID:8978083.
53. Luikart G, Cornuet JM. Empirical evaluation of a test for identifying recently bottlenecked populations from allele frequency data. Conserv Biol. 1998; 12(1): 228–237.
54. Kuo CH, Janzen FJ. Bottlesim: a bottleneck simulation program for long-lived species with overlapping generations. Mol Ecol Notes. 2003; 3: 669–673. doi:10.1046/j.1471-8286.2003.00532.x
55. Weir BS, Cockerham CC. Estimating F-statistics for the analysis of population structure. Evolution. 1984; 38(6): 1358–1370. doi:10.2307/2408641
56. Pritchard JK, Stephens M, Donnelly P. Inference of population structure using multilocus genotype data. Genetics. 2000; 155(2): 945–959. PMID:10835412
57. Falush D, Stephens M, Pritchard JK. Inference of population structure using multilocus genotype data: linked loci and correlated allele frequencies. Genetics. 2003; 164(4): 1567–1587. PMID:12930761. 58. Cuveliers EL, Volckaert FAM, Rijnsdorp AD, Larmuseau MHD, Maes GE. Temporal genetic stability and high effective population size despite fisheries-induced life-history trait evolution in the North Sea sole. Mol Ecol. 2011; 20(17): 3555–3568. doi:10.1111/j.1365-294X.2011.05196.xPMID:21790820 59. Schaerlaekens DG Dekker W, Wickström H, Volckaert FAM, Maes GE. Extracting a century of
60. Jasper JR, Habicht C, Moffitt S, Brenner R, Marsh J, Lewis B, et al. Source-sink estimates of genetic introgression show influence of hatchery strays on wild chum salmon populations in Prince William Sound, Alaska. PlosOne. 2013; 8(12): e81916. doi:10.1371/journal.pone.0081916
61. Nei M, Maruyama T, Chakraborty R. The bottleneck effect and genetic variability in populations. Evolu-tion. 1975; 29: 1–10. doi:10.2307/2407137
62. Hauser L, Adcock GJ, Smith PJ, Ramirez JHB, Carvalho GR. Loss of microsatellite diversity and low effective population size in an overexploited population of New Zealand snapper (Pagrus auratus). Proc Natl Acad Sci. 2002; 99: 11742–11747. doi:10.1073/pnas.172242899PMID:12185245
63. Hauser L, Carvalho GR. Paradigm shifts in marine fisheries genetics: ugly hypotheses slain by beautiful facts. Fish Fisher. 2008; 9: 333–362. doi:10.1111/j.1467-2979.2008.00299.x
64. Allendorf FW, Luikart GH, Aitken SN. Conservation and the Genetics of Populations. 2nd Ed. 2013; Wiley-Blackwell Publishers, The Atrium, Southern Gate, Chichester, West Sussex, PO19 8SQ, UK. 65. Peery MZ, Kirby R, Reid BN, Stoelting R, Doucet-Bëer E, Robinson S, et al. Reliability of genetic
bottle-neck tests for detecting recent population declines. Mol Ecol. 2012; 21: 3403–3418. doi:10.1111/j. 1365-294X.2012.05635.xPMID:22646281
66. Hoarau G, Boon E, Jongma DN, Ferber S, Palsson J, Van Der Veer HW, et al. Low effective population size and evidence for inbreeding in an overexploited flatfish, plaice (Pleuronectes platessaL.). Proc R Soc Lond Biol. 2005; 270: 2125–2132. doi:10.1098/rspb.2004.2963
67. Hedgecock D, Pudovkin AI. Sweepstakes Reproductive Success in Highly Fecund Marine Fish and Shellfish: A Review and Commentary. Bull Mar Sci. 2011; 87(4), 971–1002. doi:10.5343/bms.2010. 1051
68. Frankham R, Bradshaw CJA, Brook BW. Genetics in conservation management: Revised recommen-dations for the 50/500 rules, Red List criteria and population viability analyses. Biol Cons. 2014; 170: 56–63. doi:10.1016/j.biocon.2013.12.036
69. Larsson LC, Laikre L, André C, Dahlgren TG, Ryman N. Temporally stable genetic structure of heavily exploited Atlantic herring (Clupea harengus) in Swedish waters. Heredity. 2010; 104: 40–51. doi:10. 1038/hdy.2009.98PMID:19654606


![Table 4. Pairwise multilocus estimates of θ ST . Bold values are significant after a sequential Bonferroni correction [42] for 36 multiple tests (P < 0.0014).](https://thumb-eu.123doks.com/thumbv2/123dok_br/18260067.343291/11.918.54.865.859.1035/pairwise-multilocus-estimates-significant-sequential-bonferroni-correction-multiple.webp)
