Disentangling the Influence of Mutation
and Migration in Clonal Seagrasses
Using the Genetic Diversity Spectrum
for Microsatellites
S
ophieA
rnAud-h
Aond, Y
AnnM
oAlic, e
Milioh
ernández-G
ArcíA, V
ictorM. e
Guiluz,
F
ilipeA
lberto, e
SterA. S
errão,
Andc
ArloSM. d
uArteFrom the Ifremer, Deep-LEP, Centre de Brest, BP70, 29280 Plouzané, France (Arnaud-Haond and Moalic); the CCMAR, CIMAR-Laboratório Associado, Universidade do Algarve, Gambelas 8005-139, Faro, Portugal (Arnaud-Haond, Alberto and Serrão); the IFISC (CSIC-UIB), Instituto de Física Interdisciplinar y de Sistemas Complejos, Campus Universitat de les Illes Balears, Palma de Mallorca, Spain (Hernández-García and Eguiluz); the Department of Biological Sciences, University of Wisconsin-Milwaukee, Milwaukee, WI (Alberto); the Department of Global Change Research, IMEDEA (CSIC-UIB), Instituto Mediterráneo de Estudios Avanzados, Esporles, Mallorca, Spain (Duarte); and the UWA Oceans Institute and School of Plant Biology, University of Western Australia, Crawley, Western Australia, Australia (Duarte).
Address correspondence to Sophie Arnaud-Haond at the address above, or e-mail: [email protected]. Data deposited at Dryad: http://dx.doi.org/doi:10.5061/dryad.3b8k6
Abstract
The recurrent lack of isolation by distance reported at regional scale in seagrass species was recently suggested to stem from stochastic events of large-scale dispersal. We explored the usefulness of phylogenetic information contained in microsatel-lite loci to test this hypothesis by using the Genetic Diversity Spectrum (GDS) on databases containing, respectively, 7 and 9 microsatellites genotypes for 1541 sampling units of Posidonia oceanica and 1647 of Cymodocea nodosa. The simultaneous increase of microsatellite and geographic distances that emerges reveals a coherent pattern of isolation by distance in contrast to the chaotic pattern previously described using allele frequencies, in particular, for the long-lived P. oceanica. These results suggest that the lack of isolation by distance, rather than the resulting from rare events of large-scale dispersal, reflects at least for some species a stronger influence of mutation over migration at the scale of the distribution range. The global distribution of genetic polymorphism may, therefore, result predominantly from ancient events of step-by-step (re)colonization followed by local recruitment and clonal growth, rather than contemporary gene flow. The analysis of GDS appears useful to unravel the evolutionary forces influencing the dynamics and evolution at distinct temporal and spatial scales by accounting for phyloge-netic information borne by microsatellites, under an appropriate mutation model. This finding adds nuance to the generaliza-tion of the influence of large-scale dispersal on the dynamics of seagrasses.
Subject areas: Population structure and phylogeography; Conservation genetics and biodiversity
Key words: clonality, Genetic Diversity Spectrum, genetic divergence, microsatellites, seagrass, stepwise mutation
The limited dispersal of propagules and gametes across het-erogeneous environments is a key component of genetic dif-ferentiation in space and time and is considered to be a first step toward speciation, addressed in the early model of isola-tion by distance (IBD) (Wright 1943). The IBD model con-tinues to provide a framework to analyze and interpret the genetic structure of species across spatial scales (Epperson 1990; Slatkin 1992; Epperson and Li 1996; Rousset 1997;
Planes et al. 2002; Fenster et al. 2003; Vekemans and Hardy 2004). Indeed, understanding the scale dependence of genetic variability within a species range allows inferences on dispersal scales as well as on the influence and strength of the evolutionary processes generating spatial segregation of polymorphism.
Many species providing and shaping habitats on land and in the seas are clonal, including a variety of trees and grasses
Advance Access publication March 19, 2014
and all seagrass and coral species. Recently, this life-history trait has been associated with the observation of low diver-gence rates or even lack of polymorphism across long regions of nuclear or organellar DNA among congeneric species and lack of polymorphism within species even at the scale of the entire species range (Olsen et al. 2004; Aires et al. 2011). This is thought to result from the long life spans of clonal lineages and overlapping generations potentially resulting in slow evo-lutionary rates (Aires et al. 2011; Arnaud-Haond et al. 2012). These peculiarities imply that conventional phylogeographic approaches (Coyer et al. 2004; Olsen et al. 2004; Arnaud-Haond et al. 2007a; Alberto et al. 2008; Serra et al. 2010) based on gene diversification have limited power to retrace the large-scale biogeographical events shaping the distribu-tion of polymorphism in these species.
The Genetic Diversity Spectrum (GDS), an individual-based approach summarizing the scale-dependent structure of genetic diversity within a seagrass meadow, allows us to infer the role of several processes (clonality, somatic muta-tion, selfing, outcrossing, and immigration) in shaping the genetic composition within populations (Rozenfeld et al. 2007; Moalic et al. 2011). In practice, the GDS is represented as the frequency distribution of genetic distances among individuals based on microsatellite markers (Rozenfeld et al. 2007) and adapted from interpopulation distances previ-ously proposed (Goldstein et al. 1995a, 1995b; Slatkin 1995). The GDS illustrates the distribution of the size differences between microsatellite motifs (alleles) similar to the “mis-match distributions” commonly drawn on the basis of gene sequences (Harpending 1994). Thus, provided that the muta-tion model does not depart significantly from the underly-ing hypothesis of the Stepwise Mutation Model (SMM), the examination of the GDS across a broad geographic range shows the variable weight of these processes in shaping the genetic structure of individual populations. Analysis of the GDS across seagrass meadows revealed the prevalence of clonality, as well as immigration from distinct meadows, albeit at low frequency (Rozenfeld et al. 2007). Immigration was inferred by the detection of individuals exhibiting a distance to other members of the same deme that largely exceeded the average outcrossing distance, even simulated over a high number of outcrossing generations within the deme (Rozenfeld et al. 2007). Comparison of the within-pop-ulation GDS of 2 sister brown algal species with contrasting reproductive modes (dioecious vs. selfing hermaphroditic) revealed their clearly different mating systems (Moalic et al. 2011).
Although the GDS has been used to explore the balance of the evolutionary forces that yield the genetic composi-tion of populacomposi-tions and the mating system within seagrass meadows or algal beds, the concept of the GDS could be extended to explore the genetic structure of species across their entire biogeographic range, allowing examination of the scale-dependent weight of the different processes involved.
Here, we extend the individual GDS proposed at the within-population scale by Rozenfeld et al. (2007) to exam-ine processes occurring along the entire biogeographic range. We examine the distribution of genetic distances for 2 clonal
species of seagrass with contrasting mating systems, the long-lived monoecious Posidonia oceanica and the dioecious, short-lived, Cymodocea nodosa, across their entire biogeographic range. Previous analyses of both species showed high spatial genetic structure with geographical clustering of populations along their distribution range and differentiation of mead-ows at all spatial scales. Despite this, genetic and geographic distances were not correlated, particularly at regional (i.e., within basins) and local scales (within regions). Lack of IBD at local and regional scales may be explained by 2 contrast-ing scenarios. First, effective space colonization may lead to random drift by preventing subsequent effective migration even at reduced spatial scales (Becheler et al. 2010). Second, occasional large-scale dispersal events may explain the gen-eral lack of IBD reported in most studies, as suggested by a recent meta-analysis of seagrass population genetics studies (Kendrick et al. 2012). In the first case, it is expected that, provided the analyzed microsatellites predominantly evolve through SMM, the phylogeographic information contained by microsatellites may help retracing past events of coloniza-tion or gene flow (Hardy et al. 2003). In such scenario, the GDS based on phylogenetic distance would be expected to show a simultaneous increase of genetic and geographic dis-tance. Contrastingly, if long distance migration events are the main cause, the lack of IBD previously reported on the basis of allelic frequency would persist in a GDS analysis. Also, because the a priori delineation of populations, panmictic units, or biogeographic provinces is not an easy task in clonal organisms (Becheler et al. 2010, 2014), an interindividual approach—rather than an a priori grouping of individuals in sampling locations—may be a required and informative step toward providing objective spatial or ecological delineation. Here, first, we aimed to describe the evolution of interindi-vidual genetic distances with increasing geographic distances. We examine the accuracy of using phylogenetic information contained in microsatellite size to provide information on scales of differentiation (despite their still-debated mode of evolution and the drawbacks due to possible homoplasy dur-ing long-term divergence processes). Second, we aimed to assess the information that a GDS snapshot can yield about the balance among evolutionary forces acting at different spatial scales.
Materials and Methods
Model SpeciesPosidonia oceanica is a clonal marine angiosperm restricted to the Mediterranean Sea, where it is an essential structural spe-cies, developing extensive meadows ranging from 0 to 40 m in depth. It is a very slow-growing organism, with the clones extending horizontally through the growth of rhizomes at approximately 2 cm year−1, developing shoots (ramets, the
individual module repeated by clonal propagation) at intervals of approximately 5–10 cm. This monecious species (i.e., both male and female flowers on the same plant) is characterized by rarely observed episodes of sexual reproduction (Diaz-Almela et al. 2006), important clonality (Arnaud-Haond et al. 2007a),
and extremely long clonal life spans (Arnaud-Haond et al. 2012). Shoots are attached through tough rhizomatic connec-tions, and although some exceptional settlement of drifting shoots has been occasionally observed in very particular patch recruitment conditions, no such event was detected in estab-lished meadows despite extensive surveys (Diaz-Almela et al. 2008). These characteristics suggest rare migration among P. oceanica meadows, as confirmed by population genetics anal-ysis (Arnaud-Haond et al. 2007a), despite the positive buoy-ancy of seeds. Individual P. oceanica shoots (ramets) live for up to 50 years, and clones have been aged at several thousand years (Arnaud-Haond et al. 2012).
Cymodocea nodosa is also a clonal, but faster growing and short-lived, marine angiosperm distributed both in the Mediterranean and in the Eastern Atlantic, from Senegal to Central Portugal and to the Canaries and Madeira islands. It can be found from very shallow water to depths in excess of 30 m, forming rather dense and large meadows at depth. Cymodocea nodosa reproduces regularly in meadows contain-ing a mixture of males and females, but reproduction cannot be completed in monoclonal stands dominated by a single clone (either male or female), as is the case along European Atlantic meadows dominated by single males (Alberto et al. 2008). The seeds are formed at the base of the shoots of females and exhibit negative buoyancy, suggesting rather lim-ited dispersal (Marba and Duarte 1995), and confirmed by genetic spatial autocorrelation (Alberto et al. 2005). However, the occurrence of isolated meadows around oceanic islands shows the ability for occasional large-scale dispersal through the transport of either seeds or, more likely, drifting shoots possibly carrying seeds.
Sampling and Genotyping
The data sets analyzed here were originally developed to study the biogeography of both P. oceanica (Arnaud-Haond et al. 2007a) and C. nodosa (Alberto et al. 2008) across their bio-geographic range. Approximately 40 shoots were sampled in each of 37 localities for P. oceanica, ranging from west to east, from the Spanish Mediterranean Coast to Cyprus, encom-passing a distance range of 3500–4000 km. A similar sam-pling was conducted for each of 49 meadows of C. nodosa, including the Canaries and Madeira archipelagos and extend-ing along the species range in the Atlantic continental African and European coasts as well as encompassing the entire Mediterranean basin to the Eastern Mediterranean (Cyprus). In all meadows, shoots were collected at randomly drawn coordinates across an area of 20 m × 80 m and 60 m × 14 m for P. oceanica and C. nodosa, respectively (see Arnaud-Haond et al. 2007a and Alberto et al. 2008 for additional details). Both data sets are archived and available at http://ifisc.uib-csic.es/ EDEN/output.php#data.
Specimen collection consisted of a portion of the mer-istem of each shoot that was desiccated and preserved in silica crystals. Genomic DNA was isolated following a standard CTAB extraction procedure (Doyle and Doyle 1987). Two sets of 7 and 9 microsatellite markers were used for P. oceanica and C. nodosa, respectively (Alberto et al.
2003). Both sets of markers were previously determined to yield the most cost-effective determination of clonal mem-bership (Arnaud-Haond et al. 2005, 2007b). These included loci Po4-3, Po5, Po5-10, Po5-39, Po5-40, Po5-49, and Po15 for P. oceanica and 86, 38, 14, 16, Cn2-18, Cn4-29, Cn2-45, Cn2-24, and Cn4-19 for C. nodosa. All loci were perfect dinucleotides, except Cn18-2 that was a compound microsatellite composed of 3 dinucleotide motifs. Finally, each shoot or ramet is characterized by a series of pairs of microsatellite alleles at k loci with k = 7 for P. oceanica and k = 9 for C. nodosa. Ramets derived from the same original seed (i.e., belonging to the same genet or clone) will be represented by the same allele combina-tion except for possible somatic mutacombina-tions occurring during vegetative growth.
Genetic Diversity Spectrum
The GDS was constructed from the frequency distribution of all pairwise interindividual genetic distances for each spe-cies, using perl scripts available on request. We used the so-called Rozenfeld’s distance (Rozenfeld et al. 2007; Moalic et al. 2011), a distance metric designed to illustrate the effect of clonality and, in contrast with previously available met-rics, helps to resolve individuals’ origin at an earlier time. This measure of similarity among sampling units yields a distance of zero between identical genotypes (Rozenfeld et al. 2007).
The genotype of a particular sampling unit, called A, is represented as:
A= (a A1, 1) (a A2, 2) (... a Ak, k) ,
where ai and Ai are the allele lengths (in number of
nucleo-tides) of locus i in each of the 2 (diploid) chromosomes for k loci. Lower case represents the smaller allele in the pair.
Given a second sampling unit, B, with genotype B=( , )( ,b B b B1 1 2 2) ( ,…b Bk k),
we define a dissimilarity degree between A and B at locus i as: d A Bi( , )=min
(
|A Bi− i| |+ a bi − i|,|A bi − i| |+ a Bi − i| ,)
providing a parsimonious (i.e., minimal) representation of the genetic distance, understood as the difference in allele length, between sampling units A and B. The genetic distance among sampling units is then defined by summing the con-tributions from each locus (Rozenfeld et al. 2007):
D A B di i k ( , )= , =
∑
1providing the degree of global dissimilarity between A and B (Rozenfeld distance). According to this definition, sampling units from genetically identical individuals (genets or clones) will have a distance of zero.
The distribution of genetic distance D between sampling units is represented as a frequency distribution of all pair-wise values, which is referred to as the GDS (Rozenfeld et al. 2007). The GDS is analogous to the frequency distribution
of pairwise differences used on some clonal organism to analyze the effect of clonality and reveal possible somatic mutations or scoring errors (Douhovnikoff and Dodd 2003; Meirmans et al. 2003; Van Der Hulst et al. 2003; Arnaud-Haond et al. 2007b).
A second set of GDS was also built for comparative purpose by using the distance based on shared alleles (SAD, Chakraborty and Jin 1993) based on the proportion of the genome shared, independently of the length differences among microsatellite alleles.
GDS of Random Communities
We tested the shape of the GDS against 2 null hypotheses: 1) panmixia and 2) genetic structure without footprint of colonization and migration history on the spatial distribu-tion of microsatellites (no phylogenetic informadistribu-tion borne by microsatellites).
1. Panmixia, implemented via a randomly drawn distribution: Under the hypothesis of global panmixia, the shape and width of the GDS would depend only on the number and level of polymorphism of the markers used and on their random recombination. Panmixia, as a random association of alleles across genotypes by locus, was simulated for both species across their entire range by randomly picking the observed alleles (at observed frequencies) to reconstruct genotypes. In order to take into account the occurrence of clonality in our data set and compare real data with their random equivalent, some of the random panmictic geno-types were chosen within each simulated population to be replicated in the “random data set” the same number of times as the repeated multilocus genotypes (MLGs) were detected in the same population in the “natural data set.” 2. Lack of footprint of migration, implemented via a
Struc-tured Allele Shuffling method: As departure from panmix-ia is observed through several analysis including previous FST or Bayesian-based reports (Arnaud-Haond et al. 2007a;
Alberto et al. 2008), we more precisely aimed to test the departure of GDS from that expected under the hypoth-esis of a lack of phylogeographic footprint on the spa-tial distribution of allelic divergence at microsatellite loci. In order to do so, we randomly shuffled allele sizes for each locus and assigned each of the alleles to another one. A brief example: example for a locus with 3 possible alleles of lengths 154,156, and 160, a random reshuffling may lead to reallocate length 160 instead of 154, 154 instead 156, and 156 instead of 160. This was generated by a lan-guage dictionary that we used to “translate” all genotypes. This Structured Alleles Shuffling maintained the genotypic and genetic differentiation of population based on allelic identity (but not length) and allele frequencies as well as clonality. In this way, the phylogenetic information borne by microsatellite size is randomly distributed among sam-ples, allowing specific tests for the significance of its rela-tion to geographic distance in the original data set. As a result, in both cases, simulations were made at the ramet level constraining the number of replicated genotypes in
each location to that observed in the real data sets in order to compare real and random or shuffled distributions with the same amount of clonality.
This resulted in the construction of matrices of pair-wise distances and GDS for randomly distributed alleles across space. The significance of the deviations between observed and permuted (obtained by simulations under the 2 null hypotheses tested) GDS was tested by Kolmogorov– Smirnov tests in R.
The same test was performed, for comparative proposes, using the shared allele distance and assessing the departure of GDS from that obtained under the null hypothesis of panmixia.
Scale Dependence of the Genetic Diversity Spectra In order to examine the scale dependence of the GDS, it was dissected into multiple GDSs by sequentially selecting, from the overall matrix used to construct the GDS, all pairwise distances for individuals sampled across increasing ranges of Euclidean geographic distances. In particular, the classes used were 0 km (same locations), 100 km (0 km < distances ≤ 100 km), 500 km (100 km < distances ≤ 500 km), 1000 km (500 km < distances ≤ 1000 km), 2000 km (1000 km < distances ≤ 2000 km), 3000 km (2000 km < distances ≤ 3000 km), 4000 km (3000 km < distances ≤ 4000 km), and >4000 km. These distances were chosen arbitrarily because the number of genetic distance values inside each class is higher than 30 000.
For each species, a Mantel test was then performed for both species and compared assuming dispersal in 1 dimen-sion by plotting genetic versus geographic distance and in 2 dimensions by plotting genetic versus log (geographic distance).
Results
A total of 1541 and 1647 ramets derived from 39 and 60 dif-ferent meadows were used to build the Spectrum of Genetic Distances of P. oceanica and C. nodosa across their biogeo-graphic ranges, resulting in 2 373 140 and 2 710 962 pair-wise distances that ranged from 0 (for clone mates) to 51 for P. oceanica and 31 for C. nodosa using Rozenfeld distance. The observed GDSs significantly deviate from the random simu-lated distribution (Figure 1), showing a significant departure from random association of polymorphism among MLGs across the species distribution ranges for P. oceanica distribu-tion (K–S D = 0.40, P < 0.001) but not for C. nodosa (K–S D = 0.10, P = 0.99). Similarly, the departure of shuffled allele distribution (Figure 1) from the real one was significant for P. oceanica (K–S D = 0.31, P < 0.001) but not for C. nodosa (K–S D = 0.26, P = 0.15).
The GDS of both species starts at 0 (Figure 1), illustrating the prevalence of clonality. A low frequency of the smaller genetic distance classes was also observed, likely to represent the occurrence of scoring errors, somatic mutations, or both (Arnaud-Haond et al. 2007b; Rozenfeld et al. 2007). Apart from this, the GDSs were fundamentally different for both
species, with slow-growing and high-longevity P. oceanica showing a GDS skewed toward lower genetic distances and composed of several subpeaks, compared with the almost
perfect bell-shape distribution of the spectrum for C. nodosa (Figure 1). Contrastingly, the GDSs based on shared allele distance were both strictly unimodal (Supplementary Figure
Figure 1. GDS (bar plots) representing the frequency distribution of Rozenfeld interindividual distances at microsatellites
(based on microsatellite allele size differences) for Posidonia oceanica (A) and Cymodocea nodosa (B) across their geographic ranges:
from East to West Mediterranean and from East Mediterranean to East Atlantic, respectively. Solid lines represent the randomly drawn distributions, and dashed lines represent the distributions after random shuffling of allele sizes. In both permutation approaches, permuted data set were constrained in order to maintain the same level of clonality (i.e., the same amount of repeated MLG) in each population identical to that in the original data set. Kolmogorov–Smirnov tests were significant for both random
permutations and allelic shuffling for P. oceanica (D = 0.40, P < 0.001 and D = 0.31, P < 0.001, respectively) but for none of the
tests for C. nodosa (D = 0.10, P = 0.99 and D = 0.26, P = 0.15, respectively).
S1 online). The GDS was significantly departing from the random ones for C. nodosa (K–S D = 0.47, P = 0.046) but slightly below significance for P. oceanica despite similar departure of the curves (K–S D = 0.47, P = 0.076), therefore possibly due to limited statistical power.
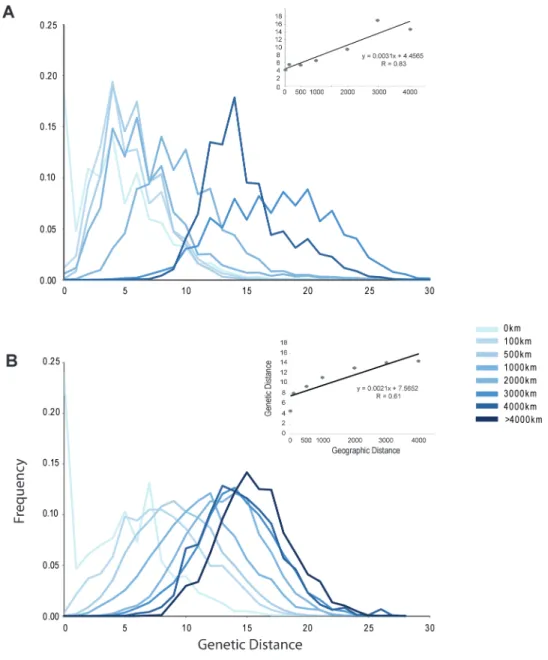
The scale dependence of the GDS based on Rozenfeld distance was examined by decomposing the GDS into par-tial GDSs derived from comparisons of pairwise distances of ramets within increasing distance ranges (Figure 2). This exercise further demonstrates important differences between the GDSs of P. oceanica and C. nodosa. Although most partial GDSs are overlapping, there is a clear linear increase in aver-age genetic distance with increasing geographic distance in
P. oceanica (Figure 2A). The larger pairwise genetic distance classes were dominated by pairs of ramets located at distant locations across the Mediterranean basin. The same tendency, but with a much narrower shift in genetic versus spatial dis-tance, was obtained for C. nodosa, where partial GDSs show a greater overlap (Figure 2B). Mantel tests based on bins of those sequential GDS were highly significant (Table 1) for both P. oceanica (R = 0.83 and 0.79, P < 0.001, in 1D and 2D spaces, respectively) and C. nodosa (R = 0.61 and 0.48, P < 0.01, in 1D and 2D spaces, respectively). Both analyses confirm the scale dependence of the genetic structure for both species in a pattern closer to a 1D dispersal model and its greater strength in P. oceanica.
Figure 2. Decomposition of the GDS across distinct sets of geographic distances, illustrating the change in mean Rozenfeld
genetic distances (based on microsatellite allele size differences) with geographic distances for Posidonia oceanica (A) and for
Cymodocea nodosa (B). The insets show the regression corresponding to the significant Mantel tests performed on bins of
geographic distances (Table 1).
The dissection of GDS based on SAD also showed an evo-lution of genetic distance with geographic ones (Supplementary Figure S2 online). However, this was true only up to a certain point as the peaks at large geographic distance are largely over-lapping. Mantel tests showed significant but less strong rela-tionships (Table 1), with the exception that for C. nodosa, no significant relationship was detected in a 2D scheme.
Discussion
Our GDS analysis opens new perspectives concerning the main evolutionary forces affecting the ecology and evolution of sea-grasses, emphasizing their mating system. The recurrent lack of overall IBD at the regional scale reported for several sea-grass species, including P. oceanica (Arnaud-Haond et al. 2007a) and C. nodosa (Alberto et al. 2008), was recently proposed to stem from occasional events of stochastic large-scale disper-sal (Kendrick et al. 2012). This led the authors to suggest the importance of large-scale dispersal for the ecology and evolu-tion of those species. Results presented here offer an alternative or complementary hypothesis by revealing the existence of an IBD pattern observed when taking into account the phyloge-netic information borne by microsatellites. The results indicate the dominant role of mutation–drift versus a negligible influ-ence of contemporary effective migration. Such a pattern may result from the strong influence of historical colonization pat-terns, followed by local recruitment and accumulation of diver-gent mutations through drift, and implies low dispersal and strong influence of clonality on the dynamics and evolution of some seagrass species. Differences in the patterns observed between both species also suggest the influence of life-history traits and/or history on the weight of these distinct scenarios.
The GDS of the 2 seagrass species examined here indeed departed significantly from randomness with Rozenfeld dis-tance only for P. oceanica, and with SAD only for C. nodosa, revealing distinct but significant patterns of genetic structure across their distributional ranges. This departure was particu-larly pronounced for P. oceanica, which exhibited successive peaks in the Rozenfeld-based GDS (Figure 1A), revealing a system of populations substructured into divergent clusters of individuals, despite the lack of IBD previously reported on the basis of FST (Arnaud-Haond et al. 2007a). In contrast,
the GDS for C. nodosa showed a profile typical of a normal distribution (except for the clonality appearing at 0) with a
single mode at high genetic distances. This reveals a lack of hierarchical divergence (Figure 1B), even though differentia-tion occurs, as revealed by the departure from randomness observed for the SAD-based GDS and Mantel tests using par-tial GDS either based on Rozenfeld or SAD distances. Indeed, for both species, decomposing the GDSs into partial GDSs at increasing spatial scales (Figure 2) revealed regular and posi-tive relationships between genetic and geographic distances, reflecting dispersal limitation at small spatial scales, and the history of divergence of clones across their distribution ranges at larger scales. This corresponds to an IBD model applicable even at the intrabasin scale (Figure 2, Supplementary Figure S2 online, Table 1). This pattern contrasts with the lack of evidence for intrabasin IBD (within marine regions bordered by the Siculo-Tunisian or the Gibraltar straits) reported for the same populations on the basis of FST differentiation
lev-els, for P. oceanica (Arnaud-Haond et al. 2007a) and C. nodosa (Alberto et al. 2008), where the only indices of a relationship between geographic and genetic distance emerging at global scale was due to biogeographic breaks.
The increasing genetic divergence with spatial distance revealed by the partial GDSs provides evidence of IBD and reveals very low effective dispersal in these species. The lack of correlation between high genetic differentiation and geo-graphic distances at regional scale observed in previous FST
-based studies was proposed to be the result of the strong influence of genetic drift and stochastic migration of sexu-ally produced propagules, with little influence of geographic distance on the success of dispersal events (as suggested in Kendrick et al. 2012). However, FST estimates based on the
frequency of alleles in a strongly structured system, as in the present case, may soon saturate the maximum level of divergence that can be revealed, resulting in an asymptotic value of the curve describing the increase of FST with the
divergence time (Hutchison and Templeton 1999). In such a saturated profile, only very slight differences, possibly lower than the standard error of the estimates, are expected among the mean FST located beyond the asymptote threshold. This
is accompanied by a variability in the point of equilibrium mutation–migration–drift depending on the markers and models used. Such saturation of frequency-based distances using hypervariable markers impedes the accurate discrimi-nation of distinct levels of differentiation beyond a certain threshold, which may have been overcome in the case of highly differentiated meadows. This threshold is highly dependent on the variability of the markers used (Beaumont and Pether 1996; Hedrick 1999; Jost 2007, 2008), with more variable markers usually leading to earlier saturation. This phenomenon may be responsible for the apparent incon-sistency between GDS and FST analyses, with regard to the
relationship between genetic and geographic distances at the regional scale. Indeed, it becomes a challenge to distinguish high levels of differentiation from even higher ones on the basis of FST estimates prone to a nonnegligible variance
beyond a certain threshold, contrary to the observed increase reported here for partial GDSs (Figure 2). Some corrections have been proposed using distance metrics based on allele frequency to obtain estimates that would not depend on Table 1 Results of the Mantel tests for both species with
Rozenfeld and allele shared distances plotted against geographic distances or their log values to fit a 1D or 2D model
Posidonia oceanica Cymodocea nodosa 1D 2D 1D 2D Rozenfeld distance 0.83** 0.79** 0.61* 0.48* Allele shared distance 0.75** 0.62*** 0.46* 0.32
Significance of Mantel tests is indicated with *P < 10−2, **P < 10−3, and
***P < 10−4.
the level of variability within demes, such as the recently proposed D or G′st (Hedrick 1999, 2005; Jost 2007, 2008). The main condition for the reliable performance of these modified metrics seems to be a relatively higher influence of mutation versus migration on the mutation–migration–drift equilibrium specific to study the systems in question. Results obtained here (Figure 2) suggest that these conditions are fulfilled in the 2 seagrass species studied but additionally support the existence of relevant phylogeographic informa-tion in microsatellites at least for the long-lived P. oceanica.
The geographic coherence of the divergence observed here from the information contained in microsatellites across species distributional ranges indeed confirms that, under a relatively higher influence of mutation versus migration on the mutation–migration–drift equilibrium, an additional ben-efit may be obtained by using not only the allelic frequencies but also the potential phylogenetic information contained in the difference in number of motifs borne by distinct alleles (Goldstein et al. 1995a, 1995b; Slatkin 1995; Takezaki and Nei 1996; Goldstein and Pollock 1997). Estimates based on allelic frequencies alone assume an Infinite Allele Model, with mutation giving rise to a new allelic state uncorrelated with the mutated allele, although there is evidence that this model is not accurate for most microsatellite loci (Schlotterer 2000). The use of differences in microsatellite length can, therefore, reveal phylogeographic patterns given an underlying muta-tion model (SMM) possibly closer to that actually operating on these markers (Rousset 1996; Goodman 1997; Balloux and Goudet 2002; Hardy et al. 2003). Compared with the estimators D or G′st, the GDS approach used here accounts for the high level of diversity, while simultaneously taking advantage of meaningful information conveyed by microsat-ellite alleles that depends on the relative influence of muta-tion in the mutamuta-tion–migramuta-tion–drift equilibrium, and also on the accuracy of the mutation model assumed, here the SMM.
The analysis of partial GDSs presented here not only con-firms the very strong structure revealed by FST for both
spe-cies but also reveals coherence between spatial and genetic distances that remained hidden in previous analyses that ignored the phylogenetic information contained in micros-atellite length variation. The species studied here have con-trasting reproductive modes and dispersal biology; fruits of P. oceanica remain buoyant over several weeks and have a rather high dispersal potential (Balestri and Lardicci 2008), whereas seeds of C. nodosa are negatively buoyant and remain attached to the mother plants until germination. On the other hand, ramets of C. nodosa are more likely to fragment and provide a midrange dispersal mean than the much thicker rhizomes of P. oceanica. Yet despite their biological differences, reflected in different GDS patterns, both species show a comparable high spatial genetic structure, demonstrating that the dispersal potential is not fully realized for either of them. This limi-tation seems particularly important in P. oceanica where not only the Mantel tests but also the GDS itself shows depar-ture from random expectations, suggesting an even stronger influence of mutation and a greater limitation to gene flow in this long-lived species than in C. nodosa. The correlation between genetic divergence and geographic distance reported
here may result from the high influence of mutation, rather than contemporary migration, on the pattern of spatial distri-bution of polymorphism among populations. This holds even at the regional scale as this shift in the distribution of genetic distances is already evident at scales of several hundreds of kilometers (Figure 2). Extant meadows may, therefore, be the result of ancient stepwise colonization events, followed by a rather allopatric evolution with very few migration events and a dominant clonal space occupation. The initial pattern induced by the colonization process is thus preserved and mostly determined by distance to the source. Such a scenario is supported by the sparse flowering (Diaz-Almela et al. 2006, 2009) and very low sexual output observed for P. oceanica (Balestri et al. 1998; Balestri and Cinelli 2003; Diaz-Almela et al. 2006, 2009) across the Mediterranean, in line with the limited (Arnaud-Haond et al. 2005, 2007a) though still likely overestimated (Arnaud-Haond et al. 2007b) clonal diversity in P. oceanica meadows. It is also in line with extremely low expected dispersal linked to the negative buoyancy of seeds in C. nodosa and strikingly contrasted patterns of genotypic diversity in neighboring meadows for both species (Alberto et al. 2006, 2008; Arnaud-Haond et al. 2007a). This initial col-onization strategy followed by predominantly local and clonal recruitment was proposed by Eriksson (1993) to be one of the extreme possible life-history strategies for clonal plants, referred to as Initial Seedling Recruitment (ISR) as opposed to Repeated Seedling Recruitment involving the occurrence of periodical events of seed recruitment. Such an ISR pat-tern was diagnosed for several seagrass species on the basis of spatial autocorrelation analysis (Alberto et al. 2005; Becheler et al. 2010) and is equivalent to the persistent imprint of initial founder effects described in nonclonal populations followed by self-recruitment over millennia (e.g., Neiva et al. 2012). The ISR seems to imprint genetic composition over large time scales as the divergence observed in line with geographic dis-tances suggest that the population system would be “crystal-lized” since the last (re)colonization of present day meadows, resulting in a genetic structure mostly driven by clonal growth, competition, and drift after a “stepping-stone” colonization process. This would also be in agreement with recent find-ings of extreme life span for some P. oceanica clones ( Arnaud-Haond et al. 2012), the domination of vast areas by single clones of C. nodosa (Alberto et al. 2001, 2008), and reports of extreme generation time for clonal organisms (Oinonen 1969; Vasek 1980; Laberge et al. 2000; van der Merwe, Spain and Rossetto 2010). There is a peak inversion between the 2 last distance bins in P. oceanica (Figure 2 and to a lower extent in Supplementary Figure S2 online), which seems to contra-dict the general interpretations given before and based on geographic distance alone. This change in ordering is mostly due to an inversion of distance among meadows sampled in Greece and Cyprus compared with those present in central or western part of the Mediterranean. This may either be attributed to historical pathways of migration or (re) coloni-zation among Mediterranean basins or to differential effects of mutation and drift in the populations in those 2 regions.
Finally, such an ISR strategy has been shown to result in genetic differentiation at all geographic scales the seagrass
meadows studied, including among neighboring quadrates within meadows, rendering the genetic concept of population cumbersome (Becheler et al. 2010). This challenges the a priori delineation of sets of samples to be pooled or not, to perform summary statistics, whereas the use of the GDS to identify scales of differentiation does not require such a priori deline-ation and can help in recognizing the breaks corresponding to the distance below which genetic structure is mostly due to ISR and consequent genetic patchiness and above which diver-gence occurs as a result of mutation accumulation through longer term isolation. This threshold appears to occur beyond a few hundred kilometers for both species (Figure 2).
This work shows that, when microsatellites exhibit a muta-tion model close enough to stepwise, the GDS analysis is a useful complementary tool to analyze the scale dependence of evolutionary processes and unravel the biogeography of some species across a large part of their biogeographic range. This is particularly useful for clonal species for which many other approaches fail due to the exceedingly low evolution of genes classically used for phylogeographic reconstruction. While showing that useful phylogenetic information may also be borne by microsatellites, as previously emphasized (Goldstein et al. 1995a, 1995b; Slatkin 1995; Rousset 1996), the evidence presented here also support the prerequisite of a predominant importance of mutation to use allele length at microsatellites in a phylogenetic framework.
Supplementary Material
Supplementary material can be found at http://www.jhered. oxfordjournals.org/.
Funding
European Commission (FP6-EDEN project); ANR pro-ject Clonix (ANR-11-BSV7-007); European Regional Development Fund (FEDER) and Ministry of Economy and Competitiveness (MINECO, Spain) through project INTENSE@COSYP (FIS2012-30634).
Acknowledgments
We thank R. Martínez, R. Santiago, and E. Alvarez for assistance with field work; S. Teixeira and M. S. van de Vliet for assistance with laboratory work; and G. Pearson for English corrections. We wish to acknowledge N. Bierne, F. Bonhomme, and 1 anonymous referee for comments on previous ver-sions of this manuscript, as well as A. Rozenfeld for useful discusver-sions at the beginning of this work.
References
Aires T, Marba N, Cunha RL, Kendrick GA, Walker DI, Serrao EA, Duarte CM, Arnaud-Haond S. 2011. Evolutionary history of the seagrass genus
Posidonia. Mar Ecol Prog Ser. 421:117–130.
Alberto F, Arnaud-Haond S, Duarte CM, Serrão EA. 2006. Genetic diversity
of a clonal angiosperm near its range limit: the case of Cymodocea nodosa in
the Canary islands. Mar Ecol Prog Ser. 306:117–129.
Alberto F, Correia L, Billot C, Duarte CM, Serrao EA. 2003. Isolation and
characterization of microsatellite markers for the seagrass Cymodocea nodosa.
Mol Ecol Notes. 3:397–399.
Alberto F, Gouveia L, Arnaud-Haond S, Perez-Llorens JL, Duarte CM, Serrao EA. 2005. Within-population spatial genetic structure,
neighbour-hood size and clonal subrange in the seagrass Cymodocea nodosa. Mol Ecol.
14:2669–2681.
Alberto F, Massa S, Diaz-Almela E, Arnaud-Haond S, Duarte CM, Serrão
EA. 2008. Genetic differentiation in the seagrass Cymodocea nodosa across the
Mediterranean-Atlantic transition region. J Biogeogr. 35:1279–1294. Alberto F, Mata L, Santos R. 2001. Genetic homogeneity in the seagrass
Cymodocea nodosa at its northern Atlantic limit revealed through RAPD.
Mar Ecol Prog Ser. 221:299–301.
Arnaud-Haond S, Alberto F, Teixeira S, Procaccini G, Serrao EA, Duarte CM. 2005. Assessing genetic diversity in clonal organisms: low diversity or low resolution? Combining power and cost efficiency in selecting markers. J Hered. 96:434–440.
Arnaud-Haond S, Duarte CM, Alberto F, Serrão EA. 2007b. Standardizing methods to address clonality in population studies. Mol Ecol. 16:5115–5139.
Arnaud-Haond S, Duarte CM, Diaz-Almela E, Marbà N, Sintes T, Serrão EA. 2012. Implications of extreme life span in clonal organisms: millenary
clones in meadows of the threatened seagrass Posidonia oceanica. PLoS One.
7:e30454.
Arnaud-Haond S, Migliaccio M, Diaz-Almela E, Teixeira S, Van de Vliet MS, Alberto F, Procaccini G, Duarte CM, Serrao EA. 2007a. Vicariance pat-terns in the Mediterranean sea: east-west cleavage and low dispersal in the
endemic seagrass Posidonia oceanica. J Biogeogr. 34:963–976.
Balestri E, Cinelli F. 2003. Sexual reproductive success in Posidonia oceanica.
Aquat Bot. 75:21–32.
Balestri E, Lardicci C. 2008. First evidence of a massive recruitment event in Posidonia oceanica: spatial variation in first-year seedling abundance on a
heterogeneous substrate. Estuar Coast Shelf Sci. 76:634–641.
Balestri E, Piazzi L, Cinelli F. 1998. Survival and growth of transplanted and
natural seedlings of Posidonia oceanica (L.) Delile in a damaged coastal area.
J Exp Mar Biol Ecol. 228:209–225.
Balloux F, Goudet J. 2002. Statistical properties of population differentia-tion estimators under stepwise mutadifferentia-tion in a finite island model. Mol Ecol. 11:771–783.
Beaumont AR, Pether SMJ. 1996. Allozyme variation and gene flow between
cockle Cerastoderma edule populations in southern United Kingdom. Fish Res.
28:263–275.
Becheler R, Benkara E, Moalic Y, Hily C, Arnaud-Haond S. 2014. Scaling of processes shaping the clonal dynamics and genetic mosaic of seagrasses through temporal genetic monitoring. Heredity. 112:114–121.
Becheler R, Diekmann O, Hily C, Moalic Y, Arnaud-Haond S. 2010. The concept of population in clonal organisms: mosaics of temporally colonized
patches are forming highly diverse meadows of Zostera marina in Brittany.
Mol Ecol. 19:2394–2407.
Chakraborty R, Jin L. 1993. A unified approach to study hypervariable poly-morphisms: statistical considerations of determining relatedness and popu-lation distances. In: Pena SDJ, Chakraborty R, Epplen J, Jeffreys AJ, editors. DNA fingerprinting: state of the science. Vol. 67. Basel (Switzerland): Birkhäuser Verlag. p. 153–175.
Coyer JA, Diekmann OE, Serrao EA, Procaccini G, Milchakova N, Pearson
GA, Stam WT, Olsen JL. 2004. Population genetics of dwarf eelgrass Zostera
nolti throughout its biogeographic range. Mar Ecol Prog Ser. 281:51–62.
Diaz-Almela E, Marba N, Alvarez E, Balestri E, Ruiz-Fernandez JM, Duarte
CM. 2006. Patterns of seagrass (Posidonia oceanica) flowering in the Western
Mediterranean. Mar Biol. 148:723–742.
Diaz-Almela E, Marba N, Alvarez E, Santiago R, Martineza R, Duarte CM.
2008. Patch dynamics of the Mediterranean seagrass Posidonia oceanica:
impli-cations for recolonisation process. Aquat Bot. 89:397–403.
Diaz-Almela E, Marba N, Martinez R, Santiago R, Duarte CM. 2009.
Seasonal dynamics of Posidonia oceanica in Magalluf Bay (Mallorca, Spain):
temperature effects on seagrass mortality. Limnol Oceanogr. 54:2170–2182. Douhovnikoff V, Dodd RS. 2003. Intra-clonal variation and a similarity
threshold for identification of clones: application to Salix exigua using AFLP
molecular markers. Theor Appl Genet. 106:1307–1315.
Doyle JJ, Doyle JLI. 1987. A rapid DNA isolation procedure for small quan-tities of fresh leaf tissue. Phytochem Bull. 11:11–15.
Epperson BK. 1990. Spatial autocorrelation of genotypes under directional selection. Genetics. 124:757–771.
Epperson BK, Li TQ. 1996. Measurement of genetic structure within popu-lations using Moran’s spatial autocorrelation statistics. Proc Natl Acad Sci USA. 93:10528–10532.
Eriksson O. 1993 Dynamics of genets in clonal plants. Trends Ecol Evol. 8:313–316.
Fenster CB, Vekemans X, Hardy OJ. 2003. Quantifying gene flow from
spatial genetic structure data in a metapopulation of Chamaecrista fasciculata
(Leguminosae). Evolution. 57:995–1007.
Goldstein DB, Linares AR, Cavallisforza LL, Feldman MW. 1995a. An evalua-tion of genetic distances for use with microsatellite loci. Genetics. 139:463–471. Goldstein DB, Linares AR, Cavallisforza LL, Feldman MW. 1995b. Genetic absolute dating based on microsatellites and the origin of modern humans. Proc Natl Acad Sci USA. 92:6723–6727.
Goldstein DB, Pollock DD. 1997. Launching microsatellites: a review of mutation processes and methods of phylogenetic inference. J Hered. 88:335–342.
Goodman SJ. 1997. R-ST Calc: a collection of computer programs for cal-culating estimates of genetic differentiation from microsatellite data and determining their significance. Mol Ecol. 6:881–885.
Hardy OJ, Charbonnel N, Freville H, Heuertz M. 2003. Microsatellite allele sizes: a simple test to assess their significance on genetic differentiation. Genetics. 163:1467–1482.
Harpending HC. 1994. Signature of ancient population-growth in a low-resolution mitochondrial-DNA mismatch distribution. Hum Biol. 66:591–600.
Hedrick PW. 1999. Perspective: highly variable loci and their interpretation in evolution and conservation. Evolution. 53:313–318.
Hedrick PW. 2005. A standardized genetic differentiation measure. Evolution. 59:1633–1638.
Hutchison DW, Templeton AR. 1999. Correlation of pairwise genetic and geographic distance measures: inferring the relative influences of gene flow and drift on the distribution of genetic variability. Evolution. 53:1898–1914.
Jost L. 2007. Partitioning diversity into independent alpha and beta compo-nents. Ecology. 88:2427–2439.
Jost L. 2008. G(ST) and its relatives do not measure differentiation. Mol Ecol. 17:4015–4026.
Kendrick GA, Waycott M, Carruthers TJB, Cambridge ML, Hovey R, Krauss SL, Lavery PS, Les DH, Lowe RJ, Vidal OMI, et al. 2012. The central role of dispersal in the maintenance and persistence of seagrass populations. Bioscience. 62:56–65.
Laberge MJ, Payette S, Bousquet J. 2000. Life span and biomass allocation of stunted black spruce clones in the subarctic environment. J Ecol. 88:584–593.
Marba N, Duarte CM. 1995. Coupling of seagrass (Cymodocea nodosa) patch
dynamics to subaqueous dune migration. J Ecol. 83:381–389.
Meirmans PG, Vlot EC, Den Nijs JCM, Menken SBJ. 2003. Spatial ecologi-cal and genetic structure of a mixed population of sexual diploid and apom-ictic triploid dandelions. J Evol Biol. 16:343–352.
Moalic Y, Arnaud-Haond S, Perrin C, Pearson GA, Serrao EA. 2011. Travelling in time with networks: revealing present day hybridization versus
ancestral polymorphism between two species of brown algae, Fucus
vesiculo-sus and F. spiralis. BMC Evol Biol. 11.
Neiva J, Pearson GA, Valero M, Serrao EA. 2010. Surfing the wave on a borrowed board: range expansion and spread of introgressed organellar
genomes in the seaweed Fucus ceranoides L. Mol Ecol. 19:4812–4822.
Oinonen E. 1969. The time table of vegetative spreading in the
Lily-of-the-Valley (Covallaria majalis L.) and the Wood Small-Reed (Calamagrostis epigeios
(L.) Roth.) in southern Finland. Acta For Fenn. 97:1–35.
Olsen JL, Stam WT, Coyer JA, Reusch TBH, Billingham M, Bostrom C, Calvert E, Christie H, Granger S, La Lumiere R, et al. 2004. North Atlantic phylogeography and large-scale population differentiation of the seagrass
Zostera marina L. Mol Ecol. 13:1923–1941.
Planes S, Lecaillon G, Lenfant P, Meekan M. 2002. Genetic and demographic
variation in new recruits of Naso unicornis. J Fish Biol. 61:1033–1049.
Rousset F. 1996. Equilibrium values of measures of population subdivision for stepwise mutation processes. Genetics. 142:1357–1362.
Rousset F. 1997. Genetic differentiation and estimation of gene flow from F-statistics under isolation by distance. Genetics. 145:1219–1228.
Rozenfeld AF, Arnaud-Haond S, Hernández-García E, Eguíluz VM, Matías MA, Serrão EA, Duarte CM. 2007. Spectrum of genetic diversity and net-works of clonal populations. J R Soc Interface. 4:1093–1102.
Schlotterer C. 2000. Evolutionary dynamics of microsatellite DNA. Chromosoma. 109:365–371.
Serra IA, Innocenti AM, Di Maida G, Calvo S, Migliaccio M, Zambianchi E, Pizzigalli C, Arnaud-Haond S, Duarte CM, Serrao EA, et al. 2010. Genetic
struc-ture in the Mediterranean seagrass Posidonia oceanica: disentangling past vicariance
events from contemporary patterns of gene flow. Mol Ecol. 19:557–568. Slatkin M. 1992. Isolation by distance in equilibrium and non-equilibrium populations. Evolution. 47:264–279.
Slatkin M. 1995. A measure of population subdivision based on microsatel-lite allele frequencies. Genetics. 139:457–462.
Takezaki N, Nei M. 1996. Genetic distances and reconstruction of phyloge-netic trees from microsatellite DNA. Gephyloge-netics. 144:389–399.
Van Der Hulst RGM, Mes THM, Falque M, Stam P, Den Nijs JCM, Bachmann K. 2003. Genetic structure of a population sample of apomictic dandelions. Heredity. 90:326–335.
van der Merwe M, Spain CS, Rossetto M. 2010. Enhancing the survival and expansion potential of a founder population through clonality. New Phytol. 188:868–878.
Vasek FC. 1980. Creosote Bush—long-lived clones in the Mojave Desert. Am J Bot. 67:246–255.
Vekemans X, Hardy OJ. 2004. New insights from fine-scale spatial genetic structure analyses in plant populations. Mol Ecol. 13:921–935.
Wright S. 1943. Isolation by distance. Genetics. 28:114–138.
Received November 6, 2013; First decision January 2, 2014; Accepted January 23, 2014
Corresponding Editor: Kenneth Olsen