Copyright © 2020 The Author(s). Published by VGTU Press
This is an Open Access article distributed under the terms of the Creative Commons Attribution License (https://creativecommons.org/licenses/by/4.0/), which permits unre-stricted use, distribution, and reproduction in any medium, provided the original author and source are credited.
FACTORS INFLUENCING URBAN INVESTMENT ATTRACTIVENESS:
AN FCM-SD APPROACH
Joana S. R. CORREIA1, Fernando A. F. FERREIRA1,2,*, Ieva MEIDUTĖ-KAVALIAUSKIENĖ 1,3,
Leandro F. PEREIRA1, Constantin ZOPOUNIDIS 4,5, Ricardo J. C. CORREIA6 1 ISCTE Business School, BRU-IUL, University Institute of Lisbon, Lisbon, Portugal 2 Fogelman College of Business and Economics, University of Memphis, Memphis, USA 3 Faculty of Business Management, Vilnius Gediminas Technical University, Vilnius, Lithuania 4 School of Production Engineering and Management, Technical University of Crete, Chania, Greece
5 Audencia Business School, Institute of Finance, Nantes, France 6 Faculty of Social Sciences, University of Madeira, Funchal, Portugal
Received 14 November 2019; accepted 09 January 2020
Abstract. The increasing concentration of populations in urban areas in recent decades has strengthened the interest in –
and the importance given to – these zones. Cities have become quite attractive from investors’ point of view because of the wide array of opportunities and growing need for investment in urban areas. Thus, city strategic planning quite often requi-res an understanding of the determinants that attract investment to urban zones. This study sought to identify the factors that strengthen urban investment based on the knowledge of a panel of experts. Fuzzy cognitive mapping techniques were applied to understand the concepts and decision criteria included in the decision-support model and their cause-and-ef-fect relationships. The results provide insights into which determinants most strongly influence urban investment, namely, infrastructure, supporting services, and political-administrative factors. Diverse scenarios at the intra- and inter-cluster levels were created to clarify the impacts of variable changes on the model developed. The findings were validated by both the expert panel members and the vice-president of the Portuguese Association of Real Estate Developers and Investors. Advantages and limitations of the proposed framework are presented, as well as recommendations for future research.
Keywords: decision aid, (fuzzy) cognitive mapping, strategic planning, system dynamics, urban investment attractiveness,
urban planning.
Introduction
Awareness of urban investment importance has been grow-ing due to its well-known social and economic impacts at different societal levels. These effects have macro-level re-percussions as investment not only affects the urban areas in which the venture capital is invested but also the sur-rounding region and country (Snieška & Zykienė, 2015). In addition to monitoring urban investment macro effects, urban management involves dealing with complex systems (Castanho et al., 2019; Ding & Lai, 2012; Miguel et al., 2019; Reis et al., 2019), making managing determinants of investment fundamental to each city’s strategic planning (Ferreira et al., 2018; Oliveira et al., 2018). That is, urban planners must understand the factors that most affect ur-ban investment to decide which are the best measures to be taken. This knowledge allows cities to obtain more
eas-ily the competitive advantages that – through consistently stronger performance than that of competitors (Barney, 2002) – generate increased urban investment.
Despite the greater overall awareness of the impor-tance of this issue, the literature on the topic is still scarce (Pires et al., 2018; Ribeiro et al., 2017). The existing studies have focused mainly on the attractiveness and competi-tiveness of urban areas, which are intrinsically linked to the determinants of urban investment. Thus, the deter-minants that attract urban investment not only still need to be identified but also analyzed in terms of their inter-relationships and the impacts that changes in a given vari-able – or a set of variables – have on investment over of a specific period. The resulting information could help city managers understand the best measures to implement at the strategic planning level (Estêvão et al., 2019).
2020 Volume 24 Issue 4: 237–250
https://doi.org/10.3846/ijspm.2020.12384
More importance is increasingly being placed on ur-ban areas because of their growth as people aur-bandon rural areas in search of better living conditions. To address the scarcity of research that has concentrated exclusively on this subject, the present study sought to create a model by combining fuzzy cognitive mapping techniques and the system dynamics (SD) approach. The main objectives were to identify determinants that attract urban invest-ment and analyze their cause-and-effect relationships, as well as these variables’ behavior over time when any change occurs.
In this type of research, statistical models have been by far the most popular approach. However, these models impose rigorous distribution assumptions, require data with particular scaling properties, and have limited flex-ibility (cf. Belton & Stewart, 2002). In addition, the cor-relations found do not necessarily imply causation, so, to model and analyze complex systems’ behavior more fully, causal links need to be examined in depth. These issues strengthened the current study’s motivation to apply the proposed dual methodology.
To achieve the main objectives, various secondary ob-jectives also needed to be fulfilled. The first was to recruit a panel of experts with experience in urban investment. The second objective was to conduct an initial session with this group in which the factors attracting urban in-vestment were identified, as well as their cause-and-effect relationships and internal hierarchy, thereby constructing a basic cognitive structure of the decision problem. The third objective was to generate a cognitive map with the information obtained in the first session. The fourth was to organize a second session with the expert panel to vali-date the group cognitive map and assign intensities to the previously defined cause-and-effect relationships. The fifth objective was to develop a fuzzy cognitive map (FCM) and a stock-and-flow diagram (SFD), while the last was to cre-ate scenarios and simulations to understand the impact that changes in determinants have on urban investment.
The paper is organized as follows. The next section presents important concepts related to the topic under study and studies of urban investment causes, including contributions and limitations. The adopted methodology is discussed next, namely, fuzzy cognitive mapping and the SD approach. The ensuing section then describes the procedures followed to develop a structured understand-ing of the decision problem at hand (i.e., urban investment attractiveness), as well as discussing the resulting dynamic system and its limitations. The last section details the con-tributions and limitations of our methodological frame-work, and suggests avenues for future research.
1. Related literature and research gap
Given that strategic planning in urban contexts is essen-tial to attract investment, the concept of strategic planning needs to be examined. Amrollahi and Rowlands (2018, p. 668) offer a broad conceptualization of this term as “a tool
to help managers better lead their firms by setting goals”.
Grant (2014) also defines strategic planning as a way to create and maintain consistency in the way companies use resources to achieve their goals. Strategic planning will thus determine long-term objectives, generate and evaluate alternative strategies, and help create a system to monitor results (Armstrong, 1982).
To identify more clearly the factors that attract urban investment, the concept of urban investment also needs to be understood. This investment focuses on areas char-acterized by “a system of interacting industries, housing,
and people” (Forrester, 1969, p. 1). Urban investment is,
therefore, of great importance to the surrounding regions and countries. Its significance has both economic and social dimensions because it aims to ensure optimal con-ditions for job creation, increase employment rates and income levels, and boost regional economies and eco-nomic growth (Brito et al., 2019; Dobrovolskienė et al., 2019; Faria et al., 2018; Fernandes et al., 2018; Marques et al., 2018; Snieška & Zykienė, 2015).
Despite the importance attributed to cities and analy-ses of factors that determine their attractiveness, urban investment has seldom been explored by researchers, and awareness of its significance is relatively recent (Caray-annis et al., 2019; Pires et al., 2018; Ribeiro et al., 2017). Although various studies have concentrated on urban competitiveness and attractiveness, almost none of them have focused exclusively on the factors that affect urban investment. However, the extant research related to city competitiveness and attractiveness is directly related to the present study, and a review of these fields of research makes sense because “the most attractive cities are
char-acterized by high investment attraction” (Bruneckiene
et al., 2016, p. 56). Table 1 lists some of the most impor-tant studies and summarizes their key points.
Regardless the contributions of the studies presented in Table 1, the approaches adopted have limitations, as with any methodology. One limitation identified as be-ing present in most of these investigations is a paucity of information on urban areas. Bruneckiene et al. (2012, p. 257) mention this problem, noting that: “the […]
lit-erature provides frequent introduction[s] and samples […
of the] practical application[s] of various methods, as well
as ways of measuring [the] competitiveness of a company, region or country from both international and national per-spectives. However, there is a lack of major academic […] analysis [… regarding] possibilities related to application[s] of such methods at the urban level”. Ezmale and Litavniece
(2011) also emphasize that this topic has been rarely ex-plored.
In addition to the lack of information on urban con-texts, Sáez et al. (2017) warn that information obtained from secondary sources may be biased. Another quite common feature of the literature in this field is that mod-els are applied to particular locations, making the re-sults difficult to replicate and put into practice anywhere else. Another quite widespread limitation of these stud-ies is that their sample is not adequate because either its size is reduced or the selected respondents were unable
Table 1. Methods of evaluating factors influencing urban investment attractiveness
Author Method Contribution Limitation
Serrano
(2003) Empirical analysis and econometric models – Provided a fuller understanding of the attractiveness and competitive-ness factors that lead to economic development
– The strong correlations between the variables in one of the econometric models led to the inclusion of fewer variables, which could obscure the real impacts of a given decision
Ezmale and Litavniece (2011)
Analysis of the existing empirical literature, comparative analysis, questionnaire, and factor and correlation analyses
– Determined which factors attract businesses to specific urban areas based on the case of the city of Latgale
– Insufficient information was available about the urban areas in question
Bruneckiene
et al. (2012) Quantitative method using the Lithuanian urban competitiveness index (UCI) and empirical methods such as strengths, weaknesses, opportunities, and threats (SWOT) analysis and identification of competitive advantages and scenarios
– Assessed the competitiveness of cities at a national and interna-tional level using the specific case of the city of Kaunas
– The measurement of competitiveness at the internation-al level showed a lack of information regarding cities and problems, making comparisons with cities in other countries challenging
Ezmale
(2012) Questionnaire and factor and correlation analyses – Analyzed attractiveness and identi-fied the most important attractive-ness factors from residents’ point of view in the Latgale region
– The results are highly subjective, and the sample is in-adequate because it does not include all stakeholders’ opinions
Litavniece
(2012) Analytical and synthetic methods – Identified the attractiveness factors of the city of Balvi – The sample size is small Jiang and
Shen (2013) Principal component analysis (PCA) and equal weighting (EW) method
– Measured urban competitiveness using two distinct methods and comparing differences in results for various Chinese cities
– PCA decreases the validity of the ranking results due to: (1) the negative weights this method attributes to some indicators, evaluating competitiveness inaccurately when these indicators present extreme values; and (2) the weights assigned to each dimension, which strongly decrease the contribution of minority indicators – The EW method includes redundant indicators Singhal et al.
(2013) Delphi technique and multi-criteria decision analysis – Created a model that evaluates city competitiveness, which was ap-plied to the specific case of United Kingdom cities
– The Delphi technique requires strongly motivated par-ticipants since no direct contact occurs between panel members
– This method also requires a long period to complete the various rounds of research
– The technique is unable to compare respondents’ quan-titative estimates or draw correct inferences from the respondents’ testimony, with regard to their response influence
De Noni et al.
(2014) Structural equation modeling – Developed a model that evaluates the factors that attract talent (i.e., investors, companies, residents, tourists, and labor) to a city, based on the specific case of Milan
– The attributes included in the standardized question-naire may not be the most appropriate, and important dimensions may have been left out
– The interviewees may have possibly misunderstood the definition of some aspects
Sáez and Periáñez (2015)
Creation of a measurement scale based on a synthetic index termed UCI
– Assessed European cities’ competi-tiveness and their ability to attract investment
– The authors did not ascertain whether the three sub-in-dicators adequately reflect the three phases of economic development (i.e., medium, intermediate, and high) Bruneckienė
et al. (2016) Questionnaires – Determined the attractiveness fac-tors of cities in terms of: (1) busi-nesses and investment; and (2) young people, as a place to work and live, based on the specific case of the cities of Alytus and Ełk
– The sample size for one of the questionnaires is ques-tionable
Sáez et al.
(2017) Use of a composite indicator – Identified the key dimensions that determine cities’ ability to attract businesses and investment
– Bias may exist in the data collected from some second-ary sources
Romão et al.
(2018) Conceptual model based on the Global Power City Index of the Mori Memorial Foundation, which seeks to evaluate the largest cities worldwide in terms of their global competitiveness and conduct structural analysis of urban attractiveness determinants
– Provided a deeper understanding of the factors that attract different stakeholders, as well as the impact of urban functions on attractive-ness
to represent the beliefs of all the targeted stakeholders. As previously mentioned, statistical models are the most popular approach in this research context, but they impose rigorous distribution assumptions, need data with specific scaling properties, and are limited in flexibility (cf. Belton & Stewart, 2002). Furthermore, the correlations identified do not necessarily involve causation, which means that modeling and analyzing complex systems requires exam-ining cause-and-effect relationships carefully. In broad terms, the limitations presented in Table 1 can be grouped into two basic categories. The first is the unclear definition of the criteria used to evaluate urban investment attrac-tiveness. The second category is the absence of dynamic analyses of criteria considered in the research. Acknowl-edging the existing general limitations is a fundamental step toward adopting new complementary approaches to overcome these problems. To fill some the gaps detected in the existing literature, the present study applied fuzzy cognitive mapping and the SD approach. These approach-es can be used to create collective cognitive maps based on specialists’ knowledge of urban investment, facilitat-ing a better understandfacilitat-ing of key decision criteria and their cause-and-effect relationships. In addition, this dual methodology allows for the performance of simulations to understand the consequences of a given decision for the entire system.
2. Methodological background
Problem structuring methods (PSMs) allow complex decision problems to be structured and thus more fully understood. According to Mingers and Rosenhead (2004, p. 531), “[Each PSM offers] a way of representing the
situ-ation (i.e., a model or models) that will enable participants to clarify their predicament, converge on a potentially ac-tionable mutual problem or issue within it, and agree [on] commitments that will at least partially resolve it”. Some
examples of PSMs are soft systems methodology, stra-tegic choice approach, viable systems model, decision conferencing, strategic options development and analysis (SODA), and SD (cf. Belton & Stewart, 2002).
The SODA approach is perhaps the best-known PSM, which was “designed to provide consultants with a set of
skills, a framework for designing [problem-]solving inter-ventions and a set of techniques and tools to help their clients work with messy problems” (Eden & Ackermann,
2001, p. 21). Martin et al. (2010, pp. 1–2) assert that
“[SODA] is essentially a way for people to outsource their different understandings of a situation. [… I]n other words, SODA develops a negotiated, action-oriented understand-ing that is usually rich enough so that [it] is obvious what has to be done and no further problem solving is needed”.
As a constructivist approach to decision making, SODA is based on Kelly’s personal construct theory, and this method uses cognitive mapping as a modeling technique (Georgiou, 2012).
2.1. Cognitive mapping and fuzzy cognitive maps
Kang et al. (2004) report that cognitive mapping was in-troduced by Axelrod in 1976. This method is a graphical representation “of causal relationships among the elements
of a given environment. It describes experts’ perceptions about the subjective world rather than objective reality”
(Kang et al., 2004, p. 546). Carvalho (2013, p. 6) further suggests that cognitive mapping is a form of “express[ing]
real world qualitative dynamic social systems from the view-point of […] decision makers”. In more practical terms,
cognitive mapping comprises the development of “ordered
graphs representing concepts (i.e., the entities that are rel-evant for the system in question) and the relations[hips] between those concepts” (Carvalho, 2013, p. 6). This
meth-od also aims to extract useful information by identifying cause-and-effect relationships (i.e., positive or negative) between different factors.
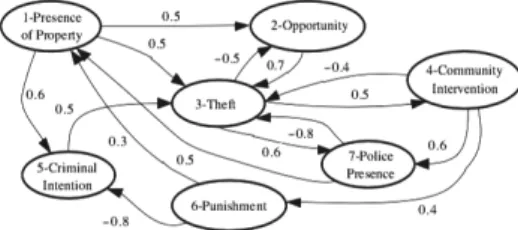
Although cognitive maps seek to represent reality through cause-and-effect connections, Ferreira (2016) and Salmeron (2012) argue that these maps cannot incor-porate the dynamics of real-life decision problems as the maps cannot quantify the intensity of the relationships. As a way to overcome this limitation, FCMs have become a well-established alternative tool to represent and ana-lyze system behaviors. These fuzzified maps (see the ex-ample in Figure 1) are “a combination of neural networks
and fuzzy logic that allows us [researchers] to predict […] change[s] [… in] the concepts represented in causal maps”
(Carvalho, 2013, p. 8).
Hanafizadeh and Aliehyaei (2011) and Stach et al. (2005) state that FCMs are an extension of cognitive maps, improving the way they reflect cause-and-effect relation-ships. FCMs use a plus (+) or minus (–) sign to identify the type of causal link between two concepts, and a nu-merical value – termed “weight” or “degree of intensity” – is also assigned to the causal connections displayed on the maps. Thus, FCMs have two specific characteristics. First, cause-and-effect relationships between concepts are simultaneously represented by a plus (+) or minus (–) sign and by a number from –1 to 1 that represents the inten-sity of the relationships. Second, the system is represented as dynamic, allowing time-related aspects to be consid-ered. According to Carvalho (2013, p. 8), “[FCMs are]
a signed directed graph with feedback, consisting of nodes
Figure 1. Example of an FCM about crime (source: Carvalho, 2013, p. 8)
and weighted interconnections. [… T]he nodes of the graph stand for the concepts that are used to describe the behavior of the system. The signed and weighted arcs represent the causal relationships among concepts”.
These graphic representations allow researchers to clear-ly indicate and interpret causal links and, more
“particular-ly[,] backward or forward chaining by which the analyst can determine the strength of a concept’s influence on the goals of the system” (Hanafizadeh & Aliehyaei, 2011, p. 327). In
other words, FCMs are a set of nodes that depict concepts used to describe the behavior of a specific system and that can represent “an entity, a state, a variable, or a characteristic
of the system” (Yaman & Polat, 2009, p. 386).
2.2. System dynamics
The SD approach first emerged with the publication of Forrester’s book “Industrial Dynamics” in 1961 (cf. For-rester, 1969). The cited author defines SD as the study of information characteristics with feedback that shows how organizational structure, policy amplification, and delays in decision making and actions interact and affect com-pany success (Chen & Jeng, 2002). The SD method was designed to model and analyze large-scale interconnected socioeconomic systems over time (Saysel et al., 2002; Se-darati et al., 2019). Sterman (2000) adds that SD is both a theoretical perspective and a set of conceptual tools that facilitate the understanding of complex systems’ structure and dynamics.
In addition, SD is a modeling method that enables for the development of computer simulations of complex systems and a more effective application of models to de-sign policies and organizations. Ogata (2004, p. 1) thus notes that SD “deals with the mathematical modeling of
dynamic systems and responses of such systems with a view towards understanding the dynamic nature of each system and improving the system’s performance”. According to
Se-darati et al. (2019, p. 1), this methodology “has the ability
to capture the dynamic behavior of a complex system over time”. Saysel et al. (2002, p. 249) add that the SD approach
focuses on “understanding how […] physical processes,
in-formation flows and managerial policies interact so as to create the dynamics of the variables of interest”.
All the relationships between the systems’ different components constitute the systems’ structure. When this structure operates over time, it generates dynamic
behav-iors (e.g., growth, decline, and oscillations) (Saysel et al., 2002). SD is thus essentially a computer-based approach that divides systems into various parts by examining each element to study the dynamic relationships between these components and to clarify the impacts and outcomes of the same elements more comprehensively (Sedarati et al., 2019). The SD approach effectively links qualitative and quantitative models (Shepherd, 2014). Qualitative models are best constructed based on relevant stakeholder inputs and are represented most often as causal-loop diagrams (CLDs) (Shepherd, 2014). In contrast, quantitative models (i.e., SFDs, also known as stock-and-flow maps or flow diagrams) are useful when decision makers want to see quantitative results – rather than mere descriptions of systems’ structure – and dynamic hypotheses (Shepherd, 2014). CLDs and SFDs are diagramming tools used in the SD approach to represent systems’ feedback structure (Sterman, 2000).
CLD models (see the example in Figure 2) are sim-pler, and, as they focus on representing systems’ variables and loop structures (Chen & Jeng, 2002), these diagrams provide three benefits including “quickly capturing [...]
hypotheses about the causes of dynamics” (Sterman, 2000,
p. 137). In addition, CLDs offer various benefits, including
“eliciting and capturing the mental models of individuals or teams” (Sterman, 2000, p. 137), and “communicating the important feedback [… experts] believe to be responsible for a problem” (Sterman, 2000, p. 137).
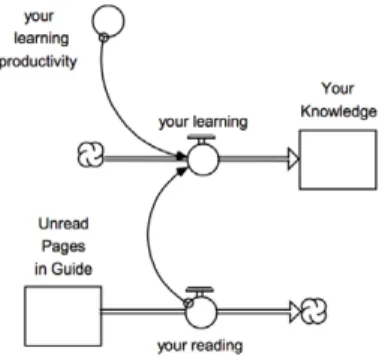
SFDs are more detailed (see the example in Figure 3), and they discriminate between more variables (Chen & Jeng, 2002). Saysel et al. (2002) report that these diagrams have four types of variables. The first is stock variables represented by rectangles, which are “state variables [… that] represent the major accumulations in the system” (Saysel et al., 2002, p. 250). The second is flow variables, which refer to the “rate of change in stock variables [… that] represent the activities which fill in or drain the stocks” (Saysel et al., 2002, p. 250). The third type of variable is converters represented by circles, which are “intermediate
variables used for miscellaneous calculations” (Saysel et al.,
2002, p. 250). The last variables are connectors represented by arrows, which symbolize “the cause and effects within
the model structure” (Saysel et al., 2002, p. 250). SFDs thus
Figure 2. Example of a causal-loop diagram
include much more information about models than CLDs do, as the former graphically depict “the relationships
be-tween stocks and flows, and [highlight…] the important difference[s] between conservative flows and information links” (Chen & Jeng, 2002, p. 4). SFDs provide a more
solid basis for empirically rigorous deductions about dy-namic behaviors (Chen & Jeng, 2002).
The SD approach, therefore, provides decision makers with useful information to help them make decisions, ena-bling these individuals to perceive the impacts that various factors have on the defined objectives (Tan et al., 2018). This information facilitates in turn strategic decision-mak-ing processes through policy analysis and scenario simula-tion (Wiranatha & Smith, 2000). Papachristos (2019, p. 2) observes that “SD practitioners use concepts and tools to
hypothesize, test, and refine endogenous explanations of system change, and use this outcome to inform policy and decision making”. The great advantage of this approach is
that it allows decision makers to deal with complex de-cision problems in a simple way through the cognitive, structural framework provided by this technique, which conventional techniques based on causal-linear thinking cannot provide (Zomorodian et al., 2018).
Despite all the advantages mentioned in the literature, the SD approach also has limitations. The first is that it in-volves various entities, which contributes to the decision-support models’ solidity but which can become a limita-tion because their involvement implies these entities’ will-ingness to contribute to producing and sustaining appro-priate changes (Papachristos, 2019). Thaller et al. (2017) point out another limitation, namely, that the SD approach does not allow for investigations at an infrastructural level. However, the integration of decision-support techniques such as FCM and SD can be a key factor in a more ac-curate structuring of complex decision problems, thereby supporting decision makers involved in urban investment. In addition, developing diagrams and representing cause-and-effect relationships between decision criteria allows more informed and grounded decisions to be made based on a better understanding of the dynamics of decision problems. The next section presents the implementation of the proposed methodological approach.
3. Implementation
The SD approach is especially suitable for studying co-evolutionary, dynamic processes since it focuses on the complex set of feedback mechanisms or causal loops that describe the interactions between system variables (Cas-tellacci, 2018). This focus is especially appropriate for the present study as, “since the last decade of the 20th century,
cities have become among the most complex and dynamic economic, social and ecologic systems” (Bruneckiene et al.,
2012, p. 256).
Decision-support models based on the SD approach allow users to understand which factors most affect a par-ticular system or subsystem and thus which determinants are the most important in terms of urban investment
at-tractiveness. These models even enable decision makers to identify if any subsystems stand out as having a greater or lesser influence (Zomorodian et al., 2018). The SD ap-proach is also advantageous from stakeholders’ point of view because the model is intuitive and easy to use and apply. SD is, therefore, useful in decision making, helping city planners to select the most appropriate policies for a given urban area and to justify the measures adopted based on empirical evidence (Jiang & Shen, 2013).
3.1. Development of group cognitive structure
To address the present study’s research objectives, two face-to-face sessions were organized with experts in urban investment. According to Yaman and Polat (2009, p. 387),
“using a group of experts has the benefit of improving the reliability of the final model”. These sessions required the
recruitment of decision makers with relevant experience in the topic under study in order to construct first a col-lective cognitive map and then an FCM. To ensure a solid basis for the construction of the decision-problem model, the main objective was to form a heterogeneous panel in terms of gender, age, and experience. In this way, the panel members could contribute more varied inputs by sharing their diverse knowledge, thereby enhancing the quality of the model. As a result, 3 female and 5 male decision makers, all over 30 years old, were selected because they worked in different areas (e.g., real estate, urban planning, urban rehabilitation, and construction). The experts also represented different levels of decision making (i.e., stra-tegic, tactical, and operational).
Although care was taken to ensure that the panel was quite heterogeneous, the goal of the group meetings was not to achieve representativeness or the ability to make generalizations but rather to maintain a strong focus on process. This approach facilitated an enriched discussion of determinants of urban investment. Bell and Morse (2013, p. 962) observe that this type of research requires
“less emphasis on outputs per se and more focus on process”.
Besides the panel members, two facilitators (i.e., research-ers) also participated in the meetings to streamline the entire process, record the results, answer any questions, and organize the sessions.
Based on cognitive mapping techniques, this process was built on 2 face-to-face sessions with the decision mak-ers, each about 4 hours long. At the beginning of the first meeting, each panel member was briefly presented, and then an explanation was provided of the study focus, the methodology used, and the procedures to be followed in the two sessions. This session comprised three steps, namely: (1) deciding which determinants attract urban investment; (2) creating clusters of determinants; and (3) hierarchizing the determinants by order of importance within each cluster.
The group session then started with a trigger ques-tion: “Based on your values and professional know-how,
what factors and circumstances influence city attractiveness to urban investment?”. In the subsequent discussion, the
“post-its technique” (Ackermann & Eden, 2001) was ap-plied to gather the necessary input to construct a graphic representation of urban investment determinants (i.e., the basic group cognitive map). The decision makers wrote one criterion on each post-it note and, when the deternant influences urban investment negatively, added a mi-nus sign (–) to the upper right corner of the note (Ferreira et al., 2014; Fonseca et al., 2018). As the decision makers provided a new decision criterion, it was read aloud by a facilitator to avoid repeated criteria, stimulate further discussion, and generate other decision criteria. The deci-sion criteria were placed on a white board in front of the decision makers.
The next step was to create clusters by allocating the criteria to the most appropriate cluster. According to Fer-reira et al. (2014, p. 713), “the stickers are organized by
areas of concern (i.e., clusters), and additional discussion regarding their significance should take place”. The
deci-sion criteria could be allocated to more than one cluster, but the assignment of a decision criterion to one or more
clusters always depended on the panel members’ collec-tive decision. This step also facilitated the elimination of decision criteria that were repeated by mistake. The pro-cess resulted in five clusters: (1) Characteristics of Urban
Areas; (2) Sociocultural Factors; (3) Market Characteristics;
(4) Infrastructure and Supporting Services; and (5)
Politi-cal-Administrative Factors.
In the last step of the first session, the decision mak-ers were asked to hierarchize the decision criteria within clusters, putting the most important criteria at the top and the least important ones at the bottom. The expert panel’s involvement in all stages of the process guided how this group session unfolded. Because of the deci-sion makers’ commitment and willingness to share their knowledge and experience, a group cognitive map could be constructed. After the first session ended, this cogni-tive map was generated using the Decision Explorer
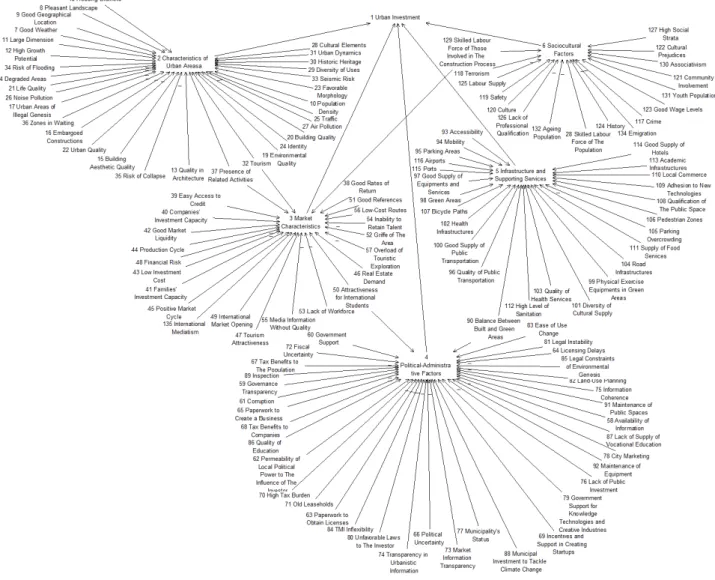
soft-ware (www.banxia.com). Figure 4 shows the validated
version of the group cognitive map, which was analyzed and discussed by the panel members collectively.
The group cognitive map presented in Figure 4 con-tains 134 criteria divided into the 5 previously mentioned clusters: (1) Sociocultural Factors; (2) Characteristics of
Urban Areas; (3) Market Characteristics; (4) Infrastructure and Supporting Services; and (5) Political-Administrative Factors. This cognitive structure represents the knowledge
shared by the group and “focuses on [...] concepts and the
relationships between those concepts” (Carley & Palmquist,
1992, p. 605). Cognitive maps “facilitate the
representa-tion and communicarepresenta-tion [and] support the identificarepresenta-tion and […] interpretation of information, facilitate consulta-tion and codificaconsulta-tion, and stimulate mental associaconsulta-tions”
(Gavrilova et al., 2013, p. 1758).
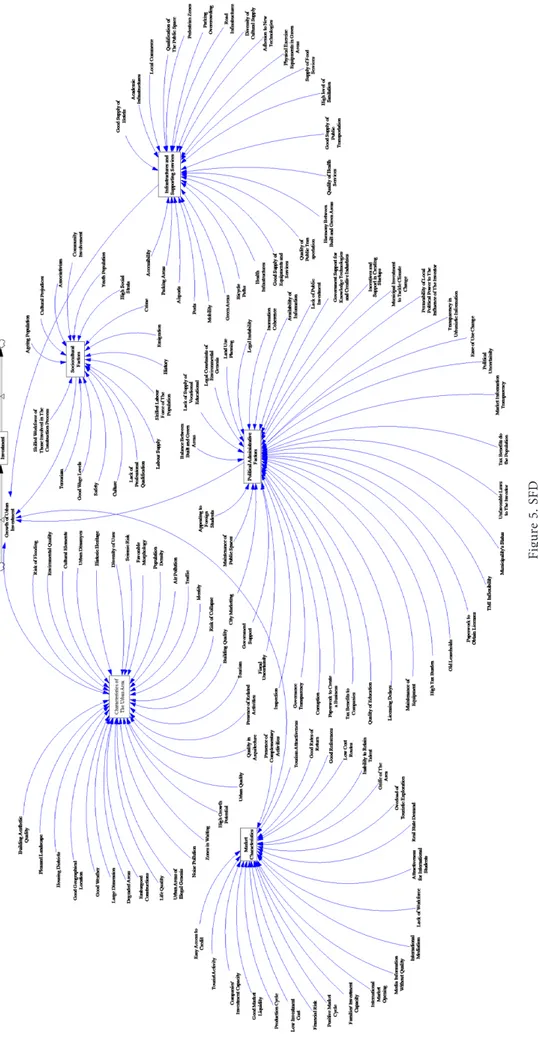
In the second session, the present cognitive map al-lowed the decision makers to assign values to the cause-and-effect relationships identified in the first session and to quantify their intensity. This step consisted of assign-ing a degree of influence to each causal link included in the initial cognitive structure, which is an essential step in constructing an FCM. The values assigned to the rela-tionships were subsequently used to generate an SFD. Fig-ure 5 shows the SFD that resulted from the FCM obtained during the second group session. Vensim software (www. vensim.com) was used to convert the FCM into an SFD.
The SFD enabled for the subsequent development of different scenarios and simulations. In total, 18 sce-narios were created in this study in order to analyze the repercussions of possible changes in the model variables. More specifically, three types of analysis were conducted: (1) inter-cluster; (2) intra-cluster; and (3) trans-cluster.
3.2. Sociotechnical analyses of urban investment attractiveness
From the outset, three clusters stood out in the model even before any scenarios were developed, namely: (1) Market
Characteristics; (2) Infrastructure and Supporting Services;
and (3) Political-Administrative Factors. The expert panel assigned values of intensity to these clusters of 0.80, 1.00, and 1.00, respectively. The last two clusters were thus given the highest possible value. The remaining two clusters (i.e.,
Characteristics of Urban Areas, and Sociocultural Factors)
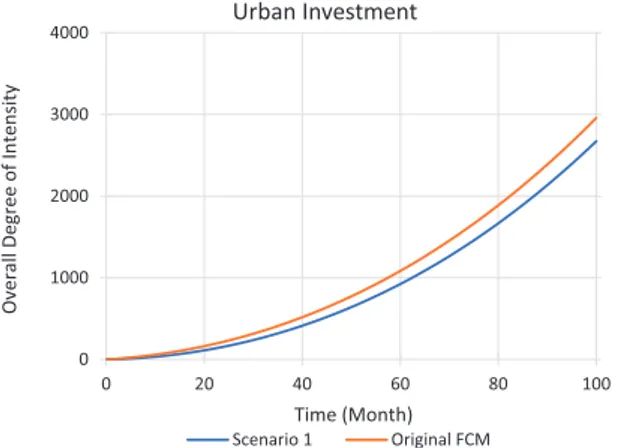
were assigned lower values of 0.60 and 0.40, respectively. The development of scenarios started with inter-cluster analysis. The objective was to understand the repercussion for urban investment if each cluster’s individual weight changed. The first scenario involved a decrease of 0.50 in each cluster. Thus, the Sociocultural Factors cluster went from 0.40 to -0.10, going from having a positive influ-ence on urban investment to having a negative impact. The Characteristics of Urban Areas cluster went from 0.60 to 0.10. The Market Characteristics cluster changed from 0.80 to 0.30, while the Infrastructure and Supporting
Ser-vices cluster shifted from 1.00 to 0.50. Finally, the Political-Administrative Factors cluster also went from 1.00 to 0.50.
The results of these changes can be seen in Figure 6, in which the orange line shows the original model’s behavior and the blue line reveals Scenario 1’s behavior based on a
reduction of 0.50 in each cluster. These results support the conclusion that a decrease of 0.50 in each cluster’s weight causes a noticeable drop in urban investment.
After the inter-cluster analysis revealed the impact of cluster variations on urban investment, the next step was to conduct intra-cluster analysis. Some determinants from each cluster were analyzed to evaluate the impact of these criteria on urban investment. For each cluster, 3 scenar-ios were created with variations of 0.50, 0.65, and 0.75, respectively. The specific characteristics of the analyzed determinants and scenarios meant that the criteria’s vari-ations could be positive or negative. The first 2 scenarios (i.e., variations of 0.50 and 0.65) were considered simula-tions of realistic situasimula-tions. The last scenario (i.e., a vari-ation of 0.75) was used to vary the five determinants in each cluster by the highest degree of intensity possible in order to determine if the impacts would be different from those of the previous scenarios. The inter-cluster analy-sis started with the Characteristics of Urban Areas cluster, which was assigned an intensity degree of 0.60 and a total of 31 determinants. Of these variables, 11 are negative, and their mean value is approximately –0.76. The mean of the 20 positive variables considered is 0.75.
Scenario 2 (see Figure 7) involved increasing the fol-lowing determinants by 0.50: housing districts, degraded areas, and illegal urban areas. To rationalize this increase, the simulation posited measures taken by the govern-ment to improve residents’ housing areas in general. The government has decided to replace social housing, which will cease to exist as separate “neighborhoods”, integrat-ing public buildintegrat-ings into pre-existintegrat-ing communities. This measure will reduce the negative impact of public hous-ing and illegal urban areas since residents will no longer need to build illegally due to social housing availability. In addition, degraded areas will be regenerated to eliminate negative impacts on specific urban neighborhoods. Thus, the intensities of the selected determinants, which were attributed an initial value of –0.80 by the decision makers, were changed to –0.30. Figure 7 shows that urban invest-ment increases under these conditions.
In Scenario 3, a decrease of 0.65 was simulated in the determinants of buildings’ aesthetic quality, architectural quality, and construction quality. Hypothetically, this sce-nario could be due to higher demand in the real estate market, forcing real estate agents to decrease their service quality in order to increase their profit margin. The values of these variables were changed from 0.80 to 0.15 (i.e., buildings’ aesthetic quality and architectural quality) and from 0.85 to 0.20 (i.e., construction quality). In this sce-nario, lower service quality in the real estate sector caused urban investment to decrease (see Figure 7), contrary to Scenario 2, in which the proposed changes triggered an increase in investment. If Scenarios 2 and 3’s changes were combined, they would cause a slight fall in urban invest-ment since the negative impacts of Scenario 3 would be greater than the positive effects of Scenario 2.
Figur
e 5. S
The last scenario was developed for the same clus-ter as in Scenario 3. The five variables with the heaviest weight were selected, and their values were decreased by 0.75. The selected determinants were tourism, urban quality, high growth potential, and good geographical location, which each went from 1 to 0.25, and envi-ronmental quality, which decreased from 0.95 to 0.20. Figure 7 shows the repercussions of these changes for urban investment. Scenario 4’s variations made urban investment shrink more than in the previous scenario since the reduction in the variables’ weight was greater. To complete the intra-cluster analysis, similar scenarios (i.e., Scenarios 5 to 16) were performed for the other 4 clusters, using the corresponding variables. A file con-taining all simulations and scenarios created for the pre-sent study is available upon request.
The next step was trans-cluster analysis, in which two scenarios were developed. This analysis consisted of modifying the values of variables that belong to more than one cluster. The first scenario (i.e., Scenario 17) involved changing all these variables, decreasing them by 0.60. The altered variables were tourism and tourism attractiveness,
which went from 1.00 to 0.40, and the presence of re-lated activities and existence of complementary activities, which went from 0.80 to 0.20 and 0.90 to 0.10, respec-tively. Attractiveness to international students and appeal to foreign students dropped from 0.50 to –0.10 and 0.40 to –0.20, respectively, thus having a negative influence on urban investment. Finally, balance between built green areas and harmony between built green areas went from 0.45 to –0.15 and 0.70 to 0.10, respectively. This scenario caused an extremely sharp decrease in urban investment, as shown in Figure 8.
Given these results, the integrated use of FCMs and SD was confirmed as a methodology that provides deci-sion makers with a holistic perspective on what impacts the proposed model’s decision criteria would have on ur-ban investment. Notably, this approach does not seek to find optimum solutions. Instead, it can serve as a learn-ing mechanism that enhances decision makers’ knowledge about urban investment as a complex decision problem.
3.3. Consolidation, discussion, and recommendations
The consolidation stage consisted of meeting with a com-petent, external expert on urban investment, who was willing to analyze the framework and provide feedback on the results. The selected interviewee is currently the vice-president of the Portuguese Association of Real Estate Developers and Investors.
The consolidation session had four objectives. The first was to present the topic and methodology adopted, with special attention paid to explaining the methodology since most people are unaware of FCMs and SD. The second objective was to ask the expert to give his opinion of the chosen method and results obtained. The third objective was to elicit feedback on the advantages and limitations of the proposed model. The last objective was to understand what would be required to put the model into practice.
Regarding the methodology adopted, the expert was initially surprised as he was unaware of any methods
0 1 000 2 000 3 000 4 000 0 20 40 60 80 100 Overall Degree of Intensit y Time (Month) Urban Investment Scenario 1 Original FCM
Figure 6. Impact of –0.50 change in each cluster on urban investment 0 1 000 2 000 3 000 4 000 0 20 40 60 80 100
Overall Degree of Intensit
y
Time (Month) Urban Investment
Scenario 2 Scenario 3 Scenario 4 Original FCM
Figure 7. Impact of scenarios 2, 3, and 4 – urban area characteristics’ effect on urban investment
0 1 000 2 000 3 000 4 000 0 20 40 60 80 100 Overall Degree of Intensit y Time (Month) Urban Investment Scenario 17 Original FCM
that could simplify – especially visually – such a complex problem or facilitate the simulation of various scenarios reflecting given realities. These could be perceived as ex-ternal and inex-ternal by users. Given the innovative nature of the methodology, especially in terms of its application to urban investment, the interviewee commented that the model “could be very useful in the future from the point
of view of not only city councils in urban areas, whose ob-jectives include attracting investment, but also real estate developers and investors” (in his words).
With regard to the model and its variables, this vice-president agreed overall with the decision criteria and cause-and-effect relationships identified. However, he thought that the weight of some clusters could perhaps be adjusted. The decreasing order of cluster influences on urban investment, as attributed by the expert panel, was
Sociocultural Factors, with an intensity of 0.40; Character-istics of Urban Areas, with a value of 0.60; Market Char-acteristics, with 0.80; and Infrastructure and Supporting Services and Political-Administrative Factors, both with
intensity degrees of 1.00. The interviewee suggested – al-though without mentioning specific values – that the
Po-litical-Administrative Factors cluster is the most important,
followed by Market Characteristics, Sociocultural Factors,
Infrastructure and Supporting Services, and Characteristics of Urban Areas. Apart from this input, he clearly accepted
and corroborated everything else. The expert perceived the model as being “quite interesting and unusual” (also in his words). He also concluded, after the scenarios were explained, that the ability to reflect the dynamics of dif-ferent variable behaviors over a given period could be the model’s main advantage.
This interviewee further pointed out that relying on a panel of experts makes perfect sense for the topic under study as they know the most about the subject, while in-cluding the general population would make no sense even though some studies reviewed in the literature have done this. Finally, he mentioned “that the model can be adapted
to specific contexts is an asset that ensures it has practical applications and arouses a larger number of entities’ atten-tion” (again, in his words).
Regarding the model’s applicability, the vice-president identified a limitation, namely, that the model needs to be more intuitive and user-friendly and less complex than the version generated by the Vensim software. Creating the model based on a similar but simplified, user-friendly platform would be a substantial improvement.
Overall, the interviewee was extremely interested in the proposed model, fully supporting its transposition into the relevant market as it could provide added value to the various entities that could gain advantages from its applications. To integrate the model further into cur-rent practices, he even suggested that it could be a future PropTech, that is, a startup that focuses on offering real estate products with a strongly innovative technological component.
Conclusions
Cities comprise complex systems at various levels (e.g., economic, social, and ecological) (Bruneckiene et al., 2012), and urban investment has major impacts not only regionally but also nationwide. Thus, urban planners must have an evaluation model that is, in particular, useful at the strategic planning level because this tool will facilitate greater awareness of the factors relevant to decision mak-ing. Decision makers can also have a better idea of the impact of their decisions on urban investment. Given the complexity of the system under study, not just any kind of methodology could be used to analyze the system con-sistently. Therefore, a combination of methodologies (i.e., fuzzy cognitive mapping and SD) was chosen to address some limitations of previous studies identified in the lit-erature review.
Despite a growing awareness that urban investment is extremely important and that it has significant impacts, few authors have analyzed the factors attracting investors to cities. The existing studies analyzed are limited in scope because their focus is not so much on determining the factors contributing to cities’ ability to attract urban in-vestment but rather on analyzing urban competitiveness, which is different from the current study’s focus. Another limitation of the extant research is that it has mostly been conducted in specific locations, making the data gathered difficult or impossible to extrapolate to other realities as this would imply conducting new studies in each urban area. In addition, some research has depended on a small sample, without using experts with knowledge in relevant fields, which also limits the existing studies’ results.
Given the shortcomings of the studies analyzed, our framework focused on filling some of these gaps. This was done, first, by recruiting a heterogeneous panel of experts to develop a comprehensive cognitive map of the deci-sion problem. This procedure improved the quality of the resulting information compared to most samples used by prior studies, which were mostly made up of local resi-dents. The second improvement was to apply the fuzzy cognitive mapping and SD methodologies to facilitate the replication of this research in other regions as needed. The third procedure was to seek to understand the cause-and-effect relationships between determinants rather than just identify them. The last improvement was that the pro-posed framework allows urban planners to predict the impacts of changing variables on urban investment. The proposed approach can also facilitate a fuller understand-ing of the complex decision problem under study due to its use of graphical visualizations.
Throughout this study, the results supported the con-clusion that, as predicted, the combination of fuzzy cog-nitive mapping techniques and SD is useful in analyses of urban investment determinants. The research focused on elaborating a model capable of representing the de-terminants of city attractiveness to urban investors and their cause-and-effect relationships, which facilitates a deeper understanding of the decision criteria’s behavior
over time. In addition to simplifying the decision problem at hand, the methodology adopted in this study works as a decision-support tool, especially in strategic planning of urban centers, making the entire process more transparent and informed.
Nevertheless, despite the limitations this approach is able to eliminate, the proposed methodology also has its shortcomings. These are due to the idiosyncratic nature of the constructed model, which means the results depend on the context in which the research is conducted (i.e., on participants in panel discussions and the study’s location). Different participants in group sessions may mean another model will be developed due to each human’s inherent subjectivity. However, the present expert panel’s heteroge-neity facilitated a representation of relevant stakeholders’ general ideas about urban investment. The specificities of each individual expert were not important enough to have a major impact on the final results and thus on the model of urban investment determinants. The region under study may, nonetheless, cause greater disparities in the perceived impacts on urban investment, which would be the result of the different environments involved. In this case, the model created can still be applied with the appropriate ad-justments, which depend on the specific context in which the model is to be used.
Since the model is idiosyncratic and it depends on the context in which it was developed, future research could replicate the procedures followed in other locations and with other experts so that the model can be adjusted to fit new realities. More differences in the impacts on urban investment might be detected if this study is replicated in urban areas in other countries. Further research may also consider performing a larger number of scenarios and simulations since this could lead to other conclusions. Ad-ditional studies may want to check whether the evidence shows that, the greater a cluster’s number of determinants, the more diluted its implications will be for the decision-making process. Any insights that add to the empirical robustness of this field of research will always be welcome.
Acknowledgements
This work was partially funded by the Portuguese Foundation for Science and Technology (Grant UID/ GES/00315/2019). Records of the expert panel meetings, including pictures, software output and non-confidential information of the study, can be obtained from the corre-sponding author upon request. The authors gratefully ac-knowledge the superb contribution and ac-knowledge shar-ing of the panel members: André Casaca, Daniel Martins, Elsa Soares, Francisco Abreu, Isabel Abreu, Rita Fonseca Lopes, Rui Carreto, and Vítor Alfaro. The authors also would like to express their gratitude to Hugo Santos Fer-reira, Vice-President of the Portuguese Association of Real Estate Developers and Investors, for his availability and the important insights he provided during the consolida-tion of results.
Author contributions
All authors contributed equally to the development of this study.
Disclosure statement
There are no competing financial, professional, or per-sonal interests from other parties.
References
Ackermann, F., & Eden, C. (2001). SODA – Journey making and mapping in practice. In J. Rosenhead, & J. Mingers (Eds.), Rational analysis for a problematic world revisited: problem structuring methods for complexity, uncertainty and conflict (pp. 43–60). John Wiley & Sons.
Amrollahi, A., & Rowlands, B. (2018). OSPM: a design methodo-logy for open strategic planning. Information & Management,
55(6), 667–685. https://doi.org/10.1016/j.im.2018.01.006
Armstrong, J. (1982). The value of formal planning for strategic decisions: review of empirical research. Strategic Management Journal, 3(3), 197–211.
https://doi.org/10.1002/smj.4250030303
Barney, J. (2002). Gaining and sustaining competitive advantage. Prentice Hall.
Bell, S., & Morse, S. (2013). Groups and facilitators within pro-blem structuring processes. Journal of the Operational Re-search Society, 64(7), 959–972.
https://doi.org/10.1057/jors.2012.110
Belton, V., & Stewart, T. (2002). Multiple criteria decision analy-sis: an integrated approach. Kluwer Academic Publishers. https://doi.org/10.1007/978-1-4615-1495-4
Brito, V., Ferreira, F., Pérez-Gladish, B., Govindan, K., & Meidutė-Kavaliauskienė, I. (2019). Developing a green city assessment system using cognitive maps and the Choquet integral. Jour-nal of Cleaner Production, 218, 486–497.
https://doi.org/10.1016/j.jclepro.2019.01.060
Bruneckiene, J., Cincikaite, R., & Kilijoniene, A. (2012). The spe-cifics of measurement the urban competitiveness at the na-tional and internana-tional level. Engineering Economics, 23(3), 256–270. https://doi.org/10.5755/j01.ee.23.3.1272
Bruneckienė, J., Zykienė, I., & Stankevičius, V. (2016). Critical analysis of city attractiveness factors in Lithuania–Poland cross-border regions: the viewpoints of businessmen and youth. Journal of Geography, Politics and Society, 6(2), 45–58. Carayannis, E., Ferreira, F., Bento, P., Ferreira, J., Jalali, M., & Fer-nandes, B. (2019). Developing a socio-technical evaluation in-dex for tourist destination competitiveness using cognitive ma-pping and MCDA. Technological Forecasting and Social Change,
131, 147–158. https://doi.org/10.1016/j.techfore.2018.01.015
Carley, K., & Palmquist, M. (1992). Extracting, representing, and analyzing mental models. Social Forces, 70(3), 601–636. https://doi.org/10.2307/2579746
Carvalho, J. (2013). On the semantics and the use of fuzzy cog-nitive maps and dynamic cogcog-nitive maps in social sciences. Fuzzy Sets and Systems, 214, 6–19.
https://doi.org/10.1016/j.fss.2011.12.009
Castanho, M., Ferreira, F., Carayannis, E., & Ferreira, J. (2019). SMART-C: developing a “smart city” assessment system using cognitive mapping and the Choquet integral. IEEE Transac-tions on Engineering Management.
Castellacci, F. (2018). Co-evolutionary growth: a system dynami-cs model. Economic Modelling, 70(C), 272–287.
https://doi.org/10.1016/j.econmod.2017.11.010
Chen, Y., & Jeng, B. (2002). Yet another representation for system dynamics models, and its advantages. In Proceedings of the 20th International Conference of the System Dynamics Society (pp. 1–27), Palermo, Italy.
De Noni, I., Orsi, L., & Zanderighi, L. (2014). Attributes of Milan influencing city brand attractiveness. Journal of Destination Marketing & Management, 3(4), 218–226.
https://doi.org/10.1016/j.jdmm.2014.06.001
Ding, C., & Lai, S. (2012). Challenges in urban management. Journal of Urban Management, 1(2), 1–2.
https://doi.org/10.1016/S2226-5856(18)30056-6
Dobrovolskienė, N., Tamošiūnienė, R., Banaitis, A., Ferreira, F., Banaitienė, N., Taujanskaitė, K., & Meidutė-Kavaliauskienė, I. (2019). Developing a composite sustainability index for real estate projects using multiple criteria decision making. Op-erational Research, 19(3), 617–635.
https://doi.org/10.1007/s12351-017-0365-y
Eden, C., & Ackermann, F. (2001). SODA – the principles. In J. Rosenhead, & J. Mingers (Eds.), Rational analysis for a problem-atic world revisited: problem structuring methods for complexity, uncertainty, and conflict (pp. 21–41). John Wiley & Sons. Estêvão, R., Ferreira, F., Rosa, A., Govindan, K., &
Meidutė-Kavaliauskienė, I. (2019). A socio-technical approach to the assessment of sustainable tourism: adding value with a com-prehensive process-oriented framework. Journal of Cleaner Production, 236, 1–11.
https://doi.org/10.1016/j.jclepro.2019.06.318
Ezmale, S. (2012). Strategies for enhancing attractiveness of the cities in Latgale region. European Integration Studies, 6, 121– 127. https://doi.org/10.5755/j01.eis.0.6.1601
Ezmale, S., & Litavniece, L. (2011). Spatial planning as a tool for improving attractiveness of the places: case of Latgale region. European Integration Studies, 5, 20–25.
https://doi.org/10.5755/j01.eis.0.5.1071
Faria, P., Ferreira, F., Jalali, M., Bento, P., & António, N. (2018). Combining cognitive mapping and MCDA for improving quality of life in urban areas. Cities, 78, 116–127.
https://doi.org/10.1016/j.cities.2018.02.006
Fernandes, I., Ferreira, F., Bento, P., Jalali, M., & António, N. (2018). Assessing sustainable development in urban areas using cognitive mapping and MCDA. International Journal of Sustainable Development & World Ecology, 25(3), 216–226. https://doi.org/10.1080/13504509.2017.1358221
Ferreira, F. (2016). Are you pleased with your neighborhood? A fuzzy cognitive mapping-based approach for measuring residential neighborhood satisfaction in urban communities. International Journal of Strategic Property Management, 20(2), 130–141. https://doi.org/10.3846/1648715X.2015.1121169 Ferreira, F., Santos, S., Rodrigues, P., & Spahr, R. (2014). How to
create indices for bank branch financial performance mea-surement using MCDA techniques: an illustrative example. Journal of Business Economics and Management, 15(4), 708– 728. https://doi.org/10.3846/16111699.2012.701230
Ferreira, F., Spahr, R., Sunderman, M., & Jalali, M. (2018). A prioritisation index for blight intervention strategies in residential real estate. Journal of the Operational Research So-ciety, 69(8), 1269–1285.
https://doi.org/10.1080/01605682.2017.1390535
Fonseca, M., Ferreira, F., Fang, W., & Jalali, M. (2018). Classifica-tion and selecClassifica-tion of tenants in residential real estate: a
cons-tructivist approach. International Journal of Strategic Property Management, 22(1), 1–11.
https://doi.org/10.3846/ijspm.2018.317
Forrester, J. (1969). Urban dynamics. The MIT Press.
Gavrilova, T., Carlucci, D., & Schiuma, G. (2013). Art of visual thinking for smart business education. In Proceedings of the 8th International Forum on Knowledge Asset Dynamics (IFKAD-2013) (pp. 1754–1761), Zagreb, Croatia.
Georgiou, I. (2012). Messing about in transformations: struc-tured systemic planning for systemic solutions to systemic problems. European Journal of Operational Research, 223(2), 392–406. https://doi.org/10.1016/j.ejor.2012.06.010
Grant, R. (2014). Contemporary Strategic Management. Wiley. Hanafizadeh, P., & Aliehyaei, R. (2011). The application of fuzzy
cognitive map in soft system methodology. Systemic Practice and Action Research, 24(4), 325–354.
https://doi.org/10.1007/s11213-011-9190-z
Jiang, Y., & Shen, J. (2013). Weighting for what? A comparison of two weighting methods for measuring urban competitiveness. Habitat International, 38(2), 167–174.
https://doi.org/10.1016/j.habitatint.2012.06.003
Kang, I., Lee, S., & Choi, J. (2004). Using fuzzy cognitive map for the relationship management in airline service. Expert Systems with Applications, 26(4), 545–555.
https://doi.org/10.1016/j.eswa.2003.10.012
Litavniece, L. (2012). The evaluation of a town’s attractiveness: a case study of Balvi city. In Proceedings of the 7th Annual International Scientific Conference “New Dimensions in the Development of Society” (pp. 170–179), Jelgava, Latvia. Marques, S., Ferreira, F., Meidutė-Kavaliauskienė, I., & Banaitis,
A. (2018). Classifying urban residential areas based on their exposure to crime: a constructivist approach. Sustainable Cit-ies and Society, 39, 418–429.
https://doi.org/10.1016/j.scs.2018.03.005
Martin, J., Bell, R., Farmer, E., & Henry, J. (2010). Strate-gic options development and analysis (SODA). In J. Ro-senhead (Ed.), Rational analysis for a problematic world (pp. 21–70). Open University.
Miguel, B., Ferreira, F., Banaitis, A., Banaitienė, N., Meidutė-Ka-valiauskienė, I., & Falcão, P. (2019). An expanded conceptua-lization of “smart” cities: adding value with fuzzy cognitive maps. E&M Economics and Management, 22(1), 4–21. https://doi.org/10.15240/tul/001/2019-1-001
Mingers, J., & Rosenhead, J. (2004). Problem structuring methods in action. European Journal of Operational Research, 152(3), 530–554. https://doi.org/10.1016/S0377-2217(03)00056-0 Ogata, K. (2004). System dynamics. Pearson Prentice Hall. Oliveira, I., Carayannis, E., Ferreira, F., Jalali, M., Carlucci, D.,
& Ferreira, J. (2018). Constructing home safety indices for strategic planning in residential real estate: a socio-technical approach. Technological Forecasting and Social Change, 131, 67–77. https://doi.org/10.1016/j.techfore.2017.10.012 Papachristos, G. (2019). System dynamics modelling and
simu-lation for sociotechnical transitions research. Environmental Innovation and Societal Transitions, 31, 248–261.
https://doi.org/10.1016/j.eist.2018.10.001
Pires, A., Ferreira, F., Jalali, M., & Chang, H. (2018). Barriers to real estate investments for residential rental purposes: mapping out the problem. International Journal of Strategic Property Management, 22(3), 168–178.
https://doi.org/10.3846/ijspm.2018.1541
Reis, I., Ferreira, F., Meidutė-Kavaliauskienė, I., Govindan, K., Fang, W., & Falcão, P. (2019). An evaluation thermometer for
assessing city sustainability and livability. Sustainable Cities and
Society, 47, 1–11. https://doi.org/10.1016/j.scs.2019.101449
Ribeiro, M., Ferreira, F., Jalali, M., & Meidutė-Kavaliauskienė, I. (2017). A fuzzy knowledge-based framework for risk assess-ment of residential real estate investassess-ments. Technological and Economic Development of Economy, 23(1), 140–156.
https://doi.org/10.3846/20294913.2016.1212742
Richmond, B. (2001). An introduction to systems thinking. High Performance Systems.
Romão, J., Kourtit, K., Neuts, B., & Nijkamp, P. (2018). The smart city as a common place for tourists and residents: a structural analysis of the determinants of urban attractiveness. Cities,
78, 67–75. https://doi.org/10.1016/j.cities.2017.11.007
Sáez, L., & Periáñez, I. (2015). Benchmarking urban competitive-ness in Europe to attract investment. Cities, 48, 76–85. https://doi.org/10.1016/j.cities.2015.06.002
Sáez, L., Periáñez, I., & Heras-Saizarbitoria, I. (2017). Measuring urban competitiveness: ranking European large urban zones. Journal of Place Management and Development, 10(5), 479– 496. https://doi.org/10.1108/JPMD-07-2017-0066
Salmeron, J. (2012). Fuzzy cognitive maps for artificial emotions forecasting. Applied Soft Computing, 12(12), 3704-3710. https://doi.org/10.1016/j.asoc.2012.01.015
Saysel, A., Barlas, Y., & Yenigün, O. (2002). Environmental sus-tainability in an agricultural development project: a system dynamics approach. Journal of Environmental Management,
64(3), 247–260. https://doi.org/10.1006/jema.2001.0488
Sedarati, P., Santos, S., & Pintassilgo, P. (2019). System dynamics in tourism planning and development. Tourism Planning & Development, 16(3), 256–280.
https://doi.org/10.1080/21568316.2018.1436586
Serrano, F. (2003). City competitiveness and attractiveness: a new approach to evaluate economic development in Mexican ci-ties (Doctoral dissertation). University of Glasgow.
Shepherd, S. (2014). A review of system dynamics models applied in transportation. Transportmetrica B: Transport Dynamics,
2(2), 83–105. https://doi.org/10.1080/21680566.2014.916236
Singhal, S., McGreal, S., & Berry, J. (2013). An evaluative model for city competitiveness: application to UK cities. Land Use Policy, 30(1), 214–222.
https://doi.org/10.1016/j.landusepol.2012.03.018
Snieška, V., & Zykienė, I. (2015). City attractiveness for invest-ment: characteristics and underlying factors. Procedia-Social and Behavioral Sciences, 213, 48–54.
https://doi.org/10.1016/j.sbspro.2015.11.402
Stach, W., Kurgan, L., Pedrycz, W., & Reformat, M. (2005). Gene-tic learning of fuzzy cognitive maps. Fuzzy Sets and Systems, 153(3), 371–401.
https://doi.org/10.1016/j.fss.2005.01.009
Sterman, J. (2000). Business dynamics: systems thinking and mo-deling for a complex world. Irwin/McGraw-Hill.
Tan, Y., Jiao, L., Shuai, C., & Shen, L. (2018). A system dynami-cs model for simulating urban sustainability performance: a China case study. Journal of Cleaner Production, 199, 1107– 1115. https://doi.org/10.1016/j.jclepro.2018.07.154
Thaller, C., Niemann, F., Dahmen, B., Clausen, U., Leerkamp, B. (2017). Describing and explaining urban freight transport by system dynamics. Transportation Research Procedia, 25, 1075–1094. https://doi.org/10.1016/j.trpro.2017.05.480 Wiranatha, A., & Smith, P. (2000). A conceptual framework for
a dynamic model for regional planning: towards sustainable development for Bali, Indonesia. In Proceedings of the 1st In-ternational Conference on Systems Thinking in Management (pp. 649–654), Geelong, Australia.
Yaman, D., & Polat, S. (2009). A fuzzy cognitive map approach for effect-based operations: an illustrative case. Information Sciences, 179(4), 382–403.
https://doi.org/10.1016/j.ins.2008.10.013
Zomorodian, M., Lai, S., Homayounfar, M., Ibrahim, S., Fa-temi, S., & El-Shafie, A. (2018). The state-of-the-art system dynamics application in integrated water resources modeling. Journal of Environmental Management, 227, 294–304. https://doi.org/10.1016/j.jenvman.2018.08.097