Key words: accessibility, health, perception, approach, space.
Palavras-Chave: acessibilidade, saúde, percepção, abordagem, espaço.
Recommended Citation
Maisa Tobias and Éden Ferreira (2014) Perception of health and accessibility: an approach to support projects for urban public spaces. Journal of Transport Literature, vol. 8, n. 1, pp. 24-51.
Maisa Sales Gama Tobias*, Éden Fernando Batista Ferreira
Abstract
Urban public spaces are conceived within certain technical standards, which would meet people’s needs. According to users’ perception that does not match all the time with the given arrangement, that may lead to rejection or misuse. In this article, the approach to analysis of projects for urban public spaces associates the perception of its users’ health with accessibility that these spaces can offer. This becomes a support for efficacy analysis of projects as part of a social inclusion policy. The approach associates an international functionality, incapacity and health classification to a multi-criteria analysis of these factors through interviews with involved population, using Likert scale, where aspects considered as accessibility barriers or facilitators of these spaces are evaluated. The results of the case studied in Belém–Brazil showed, for example, that the understanding that people build on the circulation environment regarding barriers or facilitators is not always determined by difficulties related to their performance in actions and that an inadequate project may be a limiting factor to accessibility, even for people without a diagnosed disability.
Resumo
Os espaços públicos urbanos são concebidos em padrões técnicos tidos como de atendimento às necessidades da população, o que na percepção dos usuários nem sempre coincide com o arranjo dado, podendo levar à rejeição e mau uso. Neste artigo, a abordagem de análise de projetos de espaços públicos urbanos associa a percepção de saúde dos usuários à acessibilidade que possam oferecer; o que serve de apoio à análise da eficácia de projetos, como parte de uma política de inclusão social. A abordagem conjuga a classificação internacional de funcionalidade, incapacidade e saúde à uma análise multicritério dos respectivos fatores, através de entrevistas a população envolvida, usando escala Likert, onde são avaliados aspectos considerados como barreiras ou facilitadores de acessibilidade nestes espaços. Os resultados do estudo de caso em Belém – Brazil mostraram, por exemplo, que o entendimento que as pessoas controem sobre o ambiente de circulação em relação às barreiras ou facilitadores nem sempre é determinado pelas dificuldades no seu desempenho em ações e que um projeto inadequado pode ser um fator limitante de acessibilidade, mesmo para pessoas sem um diagnóstico de incapacidade.
■JTL|RELIT is a fully electronic, peer-reviewed, open access, international journal focused on emerging transport markets and * Email: maisa@ufpa.br.
Submitted 12 Dec 2012; received in revised form 20 Jan 2013; accepted 22 Jan 2013
Perception of health and accessibility:
an approach to support projects for urban public spaces
[A percepção de saúde e acessibilidade: uma abordagem para apoiar projetos de espaços públicos urbanos]
University of Amazonia - Brasil
Introduction
Urban public spaces are part of circulation environment of its users and therefore they need to
be conceived in an adequate way in order to meet their needs. As urban structures for
collective use, they are supposed to meet average needs of involved population in their
aspiration and capacities. The approach in this paper results in efficacy evaluation of these
spaces according to its physical infrastructure associated with well-being in terms of
accessibility. The results can contribute to adjustments in implanted projects and to
conception of projects.
From the perspective of accessibility, urban environment is analyzed from the standpoint of
road infrastructure, conditions of means of transportation, among other things. The interaction
level of people and goods trips in the city is what sets urban accessibility (Patel, d'Cruz and
Burra, 2002; Albano, 2006). However, as cities grow larger, roads may suffer an overload of
people and goods. That might create conflicts between users, reflect the pattern of commuting
and movement of people and there may be limitations on accessibility. Barriers or difficulties
in proper fulfilment of activities that are part of people’s day-to-day can have direct impact on
their health, considering that health is the most complete state of physical, mental, and social
welfare, according to the World Health Organization – WHO, and not merely the absence of
disease (Scliar, 2007).
This understanding of users’ perception about accessibility of circulation environment and how it relates to their conditions of capacity and functionality come from studies like those by
Rozestraten (1988) and Silva (2001), which show that users behavior in the circulation
environment is influenced by environmental factors. From this perspective emerged the
International Classification of Functioning, Disability and Health – ICF, proposed by the
World Health Organization in 2001 (WHO, 2003), which describes functions and disabilities
related to health conditions. It starts with conditions of body functions and structures and with
engagement conditions in social activities in the environment where the person lives (Farias
In the context of city life, ICF establishes environmental factors as one of its analysis
components, considering it a factor of direct impact on all components of functioning and
disability. It means that, even when body functions and structures are preserved and present
no changes, environmental factors may affect engagement in activities. For this reason, it is
considered that ICF on a societal level should be used in evaluations such as architectural
universal projects, accessibility implementation, identification of facilitators, barriers and
changes in social policies (WHO, 2002).
Therefore, it means that, in order to evaluate a urbanization project, strategies must identified,
resources and equipment used in the project must meet the needs of users, relating it to their
ability in taking part inn activities, difficulties and disabilities of functionality. What can be
observed in most of the survey instruments in transportation studies is a lack of specific
association to evaluate the relationship between functionality and users ability on circulation
spaces.
This study proposes an analysis of users' perception of circulation environment, searching for
the relationship between users perception in face of its functionality, disability and health and
the features, barriers and facilitators of urban space where they live, constituted as restrictive
elements to urban accessibility. It is assumed that acknowledging these restrictions or
specificities could support the development of urban infrastructure projects related to
accessibility. This could provide social inclusion and people could be benefited.
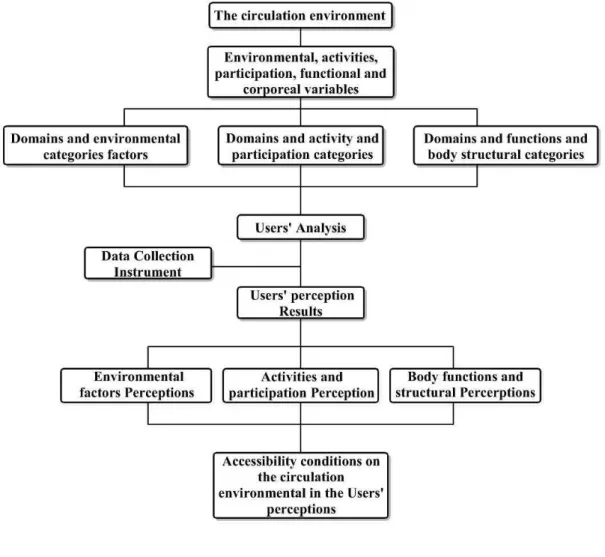
The research was developed and divided as follows: first, the perception process of built
environment and the instruments of international classification for health conditions are
approached. Then the approach is proposed, which associates the concepts of health and accessibility, establishing three groups of factor categories that are connected to people’s well-being regarding accessibility in urban public spaces. For testing the approach, a case in
Belém – Brazil is presented with its main results. For last, conclusions about contributions of
1. Built Environment Perception Process and Health Conditions
Considering the city as a built environment, Vasconcellos (2001) stated that it can be
understood as a large set of physical structures designed to support development process. This
environment is not static, but subject to a constant construction and destruction process
among complex social and economic processes. Thus, even from the perspective of this
author, the built environment involves a wide system of man-made resources, comprising the
usage of values embedded in the physical environment and it can be used for production,
exchange, and consumption. In each city a complex spatial system is materialized, with a
reunion of interdependent functional areas. These are denominated structures of production,
reproduction and circulation (Ewing and Cervero, 2001).
The circulation structure refers to that part of the built environment that allows physical
movement of people and goods: roads, sidewalks, railways, passengers and cargo terminals.
In circulation structure there has been the physical support of the movement itself, either on
foot or using another means of transportation, which Vasconcellos referred to as means of
circulation. Thus, the combination of the structure and means of circulation comprises a
circulation system which represents the movement of all physically activities connected that
occur in the physical environment.
The increase in distance leads individuals to move from their homes to perform their daily
activities, i.e., work, school, shopping or leisure. That makes the circulation environment a
constant struggle for space, which is scarce to meet individual needs. In the discussion about
users behavior in the circulation environment, Rozestraten (1988) considers at least three
conditions in order to produce an appropriate behavior in traffic:
- The presence of stimulus that can be observed and perceived by people: it means that
a clearer and less ambiguous situation or stimulus may contribute to the best
behavioral adaptation in relation to traffic environment.
- People able to perceive and react appropriately to stimulus perceived: in this case, it
means the presence of motor or mental disabilities that affect a reaction to stimulus.
- People with prior learning of signs and rules that must be followed: it is used as a
Despite the understanding that these three conditions are factors that influence users behavior
in the circulation environment, in this study such conditions in order to be attended are linked
to the functionality, ability and health of human beings. In other words, conditions can be
sufficiently suitable if there is a user able to perceive and react appropriately to stimulus of
circulation environment.
1.1 The Perception Process
Perception has an important role for understanding the relationship between human beings
and the environment. The discussion about perception is not new: Barber and Legge (1976)
defined perception as the "process of reception, selection, acquisition, processing and
organization of the information provided by our senses". The authors consider that perception
is the gateway to all information that a person receives and processes; it is also an important
consideration in evaluation studies. One application would be an answer to the question: how
do individuals envision the development of transport systems that are best suited to their
needs, from the standpoint of what is best for them in face of their physical and emotional
limitations? Moreover, it would be an answer to the question: which factors are more
perceived or valued by individuals considering the accessibility restrictions?
In the discussion about the perception process, Tobias (2009) considers that to begin a
perception process is necessary the exposition to information or to an object. Then this
information or object is observed and decoded. So not only do people select stimuli to which
they are exposed, they also organize and interpret them. It is from this organization and
interpretation of stimuli generated by perception that people define their attitudes and
behaviors, which in the context of the city it has become the focus of this study about the
evaluation of accessibility perception of the circulation environment.
Studies by Rio and Oliveira (1996) and later by Silva and Egler (2002) complement the
discussion by claiming that with studies related to perception is possible to develop a better
understanding of the interrelationships between man and environment, their expectations,
judgments and behaviors. In addition, the study of perception can reveal ideas and
impressions that groups have about something, considering that they have needs, values,
1.2 International Classification of Functioning, Disability and Health – ICF
Even before the discussion about health, considerations about becoming ill have been
established a long time ago, surrounded by cultural values, traditions and beliefs, which were
considered manifestations of evil spirits or divine punishment for sins committed. Whatever
the causes, identifying diseases seems simpler than identifying health. The concept of health
can be included among those considered inaccurate. However, when it is applied to specific
categories and relevance, it does not allow defining it with objectivity. Until 1948 there was
no universally accepted concept of health. Only after World War II, with the creation of the
United Nations and World Health Organization, was health recognized as a right and states
had to recognize the duty of promoting and protecting it. For that matter the WHO (2002)
released the concept that defines health as the most complete welfare, mental and social, and
not just the absence of disease.
Following this principle, actions of the WHO began to involve the survey of social issues with
the onset of diseases, replacing the specific look at biological questions. One of the WHO's
functions is to develop international classifications for application in various aspects of health.
These classifications create a common language that facilitates the worldwide system of
health information and provides references that encode diseases, other health-related
characteristics and interventions in that area. It is a tool for epidemiological research,
management and decision making in health systems worldwide, with major contributions to
public health (Martins et al, 2010).
In the WHO's international classifications, health conditions (diseases, disorders, injuries, and
so forth) are classified primarily in the ICD (International Classification of Diseases). Since
its first release in 1893, the ICD was the trailblazer of international classifications family and
had a number of reviews; it is now in its tenth edition - ICD10. However, despite its
importance and extensive use, the WHO pointed out that the classification of diseases is not
enough to describe all aspects related to health. They sought for further information about
consequences of diseases in people’s lives. In order to supply that demand, in 1980 the WHO
launched the International Classification of Impairments, Disabilities and Handicaps (ICID)
as an experiment for testing purposes, which is incorporated in categories that corresponded
Although it was an important step for expanding the way of understanding and applying the
concept of health, the ICID had weaknesses, according to Farias and Buchalla (2005): the lack
of relationship between its dimensions and no approach to social aspects. Because of that,
after being tested in more than 50 countries, involving more than 1,800 health professionals,
the World Health Assembly in 2001 approved the International Classification of Functioning,
Disability and Health (ICF). This classification is based on a bio-psychosocial approach that
incorporates the components in physical and social levels. Thus, it is an evolution from the
biomedical model, based on diagnoses, to one that incorporates three dimensions: biomedical,
psychological and social, where each level acts upon the other and all of them are influenced
by environmental factors.
The ICF's overall objective, according to WHO (2008), is to provide a unified and
standardized language, as well as a structure that describes health and its related states. This
classification suggests that there is a mutual influence between the disease presented by the
individual, which constitutes in a framework of functional capacity and the environmental
factors that affect the performance of their daily activities, which may act as barriers or
facilitators to their functional status (Maia, Sousa and Oliveira, 2011).
In this context, ICF has a universal application and can be used as a tool to identify health as
an enlarged perspective and it does not refer merely to disabled individuals, once the
international concern about health care outcomes has been displaced to assess the level
functionality of human being altogether in daily life (WHO, 2002). The ICF classifies health
and health-related states organizing them into two parts: (1) Functioning and Disability and
(2) Contextual Factors (WHO, 2003).
The Functioning and Disability components include body functions and structures and
activities and participation. The body component includes two classifications, one for organic
system functions and another one for body structures (WHO, 2003). From this perspective, it
is possible to understand that the functionality of an individual in a specific domain is an
interaction or a complex relationship between health condition or state and contextual factors.
This interaction is dynamic and interventions on an element could interfere in one or more
The WHO (2002) defines that, among other uses of ICF, the development of new policies can
be included. The WHO considers that health goes beyond the health sector, involving
functional status of people in situations such as social security, employment, education and
transportation. Not to mention that the development policy in these sectors requires valid and
reliable population data on functional status of individuals. In normal use of ICF, each
component consists of several domains, among which there are categories that are used as
units of classification. Therefore, the ICF is not an evaluation tool, but a qualifying one, with
which health is related to the state of a person, identified by clinical evaluations which are
recorded by selecting the appropriate code or codes of the category and the addition of a
qualifier, which specify the magnitude of functionality or disability (WHO 2002).
For the purposes of this work, clinical evaluations are not intended, but the search to evaluate
users perceptions of environmental factors that influence the movement in urban areas,
selected from some ICF categories and used as reference for the proposed approach, which is
to involve users evaluation, with their functionality and capability levels, on the perception of
the circulation environment in face to environmental factors and how it could influence on
accessibilities to perform their activities. The analysis could support decision making in urban
infrastructure projects, seeking to make them more suitable from a global perspective of
health and welfare.
2. The Approach
The basis for developing the approach of perception analysis on circulation environment is the
evaluation of functionality and capacity level of dwellers (activity/participation and body
functions/structures) associated to environmental factors. The approach proposed aims at
highlighting how users perceive their circulation environment in relation to possible
difficulties or disabilities and what can be improved in physical space to raise the level of
people’s welfare in this space in order to make urban projects more inclusive.
As a result of this understanding, such perceptions can identify, among other things, the way
urban policies and projects are influencing users accessibility, regardless of the level of
functioning and disability that they have. They can also bring insight on how to promote
The approach is based on three conditions:
1. Environmental factors category: products and technology, environment and natural
environmental changes made by humans and services, systems, and policies. In the field of
products and technology the components are used in design, architecture and construction for
accesses and exits of public buildings and also for the development of the urban area. In the
field of environmental changes, components are related to terrain forms, population changes
aspects of the biological environment - flora and fauna and the natural environment such as
light, sound, climate and air quality. In the field of services, systems and policies have service
components, architectural construction policies and systems, open space and public services
planning. Among these public services, transportation is considered.
2. Activity and participation category: comprises the domains of learning and applying
knowledge, general and demand tasks, communication, mobility, major life areas and life in
community, social and civic life. Thus, the corresponding components are related to
capabilities and skills learned and used directly in the movement and the elements that
generate motivation for the displacement.
3. Body functions and structures category: related to body functions and structures that lead
users to perceive the environment and are responsible for displacement and mobility. Thus,
the components were set in function of orientation, memory, cognition, attention, energy and
impulses, sensory sight functions, hearing, and university entrance exam (“vestibular”) systems, voice, speech, articulation, and also bone structure.
Starting from these conditions, each selected component composes the field survey
instrument, organized in a questionnaire, so that interviewees can evaluate each item
according to their perception. During the evaluation of perception, issues are systematized in
the form of Likert's Scale (Likert, 1932). For environmental factors, interviewees first
establish a rank for each domain or component investigated as a barrier or facilitator. Then,
for each item rated, interviewees quantify them as barriers or facilitators, on a scale from 0
(zero) to 4 (four). Table 1 shows the quantifiers, barriers and facilitators for the environmental
factors.
In relation to the categories of activity/participation and body functions/structures,
interviewees quantify their perception of difficulties or deficiencies to each item questioned
from 0 (zero) to 4 (four), greatest difficulty to no difficulty. Table 2 presents the quantifiers
for the evaluation of activities/participation and body functions/structures. It is known that
these impacts may not always be quantified or qualified by field survey instruments, which
emphasize the physical structure of urban spaces.
By dealing with the understanding on how the residents’ quality of life may be influenced by
structural changes in the public space, the perception that users have of circulation
environment, themselves and the activities they develop are being considered. Thus, the result
is an approximate measure of a current reality which can be very vulnerable to the kind of
the analysis could serve as a measure of efficacy on urban interventions given the present
environmental conditions.
The evaluation result of users’ perception of circulation environment was obtained by summing the incidences of answers for each item, multiplied by the weight assigned by the
qualifier (0, 1, 2, 3, or 4). Note that there may be a difference between the maximum value on
each item obtained in the responses and the ideal value (i.e., 4 or 100% scores - the maximum
possible), in other words, the real value. The final real value is converted in a percentage by
means of an apportioning between that value and the maximum score, consisting in a score
qualifier and classifying it according to the intervals in Table 3.
Table 1 - Qualifiers of barriers and facilitators to environmental factors
Quantifiers Barriers Facilitators
0 No barrier No facilitator
1 slight barrier slight facilitator
2 Moderate barrier Moderate facilitador
3 Severe barrier Considerable facilitator
4 Complete barrier Complete facilitator
Table 2 - Quantifiers for activity and participation, body functions and structures
Quantifier Activity and Participation Body functions and structures
0 No difficulty No difficulty or disability
1 Slight difficulty Difficulty or slight disability
2 Moderate difficulty Difficulty or moderate disability
3 Severe difficulty Difficulty or severe disability
4 Complete difficulty Difficulty or complete disability
The analysis of attribute score in Table 3 not only allows individual analysis of each category
regarding the predominant perception that users have of circulation environment, but also
or not on the environment should result from users perception of accessibility, associated with
conditions of health and functional capacity, as well as connected to information levels and
interpretation of their feelings, treated in the studies by Karsaklian (2000).
Finally, it is important to mention that, depending on the environment to be analyzed, all or
some of the factors cited on the three conditions will be involved. This way, each case must
be previously considered and relevant factors to a particular study must be chosen based in
specific conditions of the place.
Table 3 - Ranges of scores assigned by qualifier
Environmental factors
Barrier Facilitador
Body functions and
structures
Activity and
Participation
Attributed
score, %
No barrier No facilitator No difficulty or
disability No difficulty 0 – 4%
Slight barrier Sight facilitator Difficulty or slight
Disability Slight difficulty 5 – 24%
Moderate barrier
Moderate facilitator
Difficulty or moderate disability
Moderate
Difficulty 25 – 49%
Severe barrier Considerable facilitator
Difficulty or severe
disability Severe difficulty 50 – 95% Complete
barrier
Complete
facilitator
No difficulty or
disability
Complete
Difficulty
96 – 100%
3. Case study: Belém-Brazil
The city of Belém is located in the North of Brazil and has a population of over two million
inhabitants (IBGE, 2010). Figure 2 shows that recent urbanization processes of circulation
spaces are taking place in Belém, within initiatives aimed at building pathways more
accessible to users through the use of new types flooring, incorporation of bicycle lanes on
new projects, expansion of recreational areas in public space, and others. Soon, these
structural modifications of the environment may generate traffic impacts on the accessibility
The location chosen for exploring application was an avenue of the city, called Marques de
Herval Avenue (Figure 3). This avenue was chosen because it was an area of recent urban
transformation, which included implantation of signaling projects, review project of the road
and incorporation of space for leisure, for exclusive use of bicycles and walking.
The survey in Marques de Herval Avenue consisted of application of a questionnaire to a
universe of 600 residential lots (CODEM, 2000), excluding commercial or vacant lots. From
this universe, 60 households were contacted and agreed to participate in the survey,
considering one respondent by household. The research went on for one month, two rounds
per day. For each household, one resident was interviewed. The interviwee was randomly
chosen, but had to be at least 18 years old, living onthat avenue for more than 2 years, and in a
position to express their opinions about Marques of Herval urbanization project. Participants
were also chosen without restriction on mobility, gender, race, or any other issues.
The questionnaire was composed of three parts: socioeconomic data; commuting patterns; users’ perception of their conditions of functionality, capacity and health, and the opinion on accessibility in the urbanization project of Marques de Herval, in face of their personal
conditions. The questionnaire can be found in Appendix 1 and the results of interviews are
presented in Appendix 2. After this, the data were systematized in order to enable analysis of
the investigated aspects.
The data obtained from the analysis of responses allowed evaluating the satisfaction degree of
urban design implemented, as shown in Table 4. The percentages of the analytical categories
indicated that the population, in general, identifies the elements of the circulation environment
as barriers and moderate facilitators, judging the project satisfactory. In summary, it was
Figure 2 - Belém, Brazil - Marques de Herval location
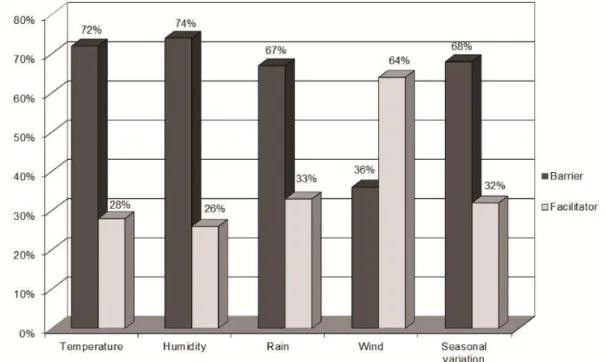
Environmental Factors: the main factors reported as barriers by the interviewed population
are related to environmental conditions, 26.4 % of the prevailing perception (Table 4).
Temperature, humidity, rainfall and seasonal variation factors are largely influenced by the
characteristic climate of northern Brazil. The high temperature associated with almost daily
rains, influenced by moisture and seasonal variation, are elements that, in the perception of
road users, affect circulation. Graphic 1 shows an example of opinion about climate. Other
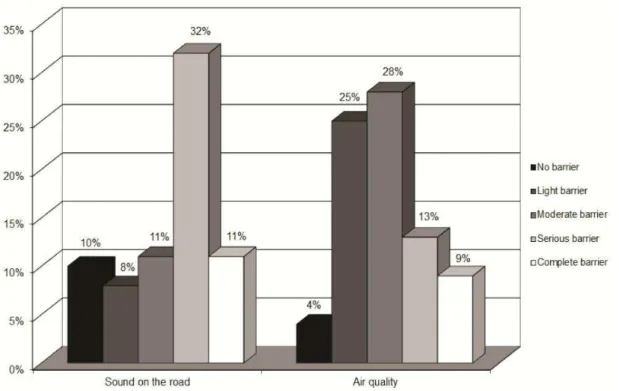
elements highlighted as a barrier by users are: air quality and noise from the road (Figure 4).
Table 4 - Score results assigned by category and qualifier
Category Perception in %Dominant Qualifier
Environmental factors - barriers 26.4 Moderate barrier
Environmental factors - facilitator 32.1 Moderate facilitator
Activities and participation 19.7 Slight difficulty
Body functions and structures 12.1 Difficulty or slight disability
Air quality and noise on the track can be considered a negative consequence of the
restorations that the avenue went through. The changes made in Marques de Herval Avenue,
which has always been an important corridor of city traffic, increased the number of
commuters. There has been an increase of traffic noise and gas emission that may have
affected air quality (Figure 5).
Figure 5 - Sound and air quality perception
Services, systems and transport policies: understood as services and programs for moving
people or goods by means of public or private transportation, including those who provide
services, they were elements of environmental factors perceived as a barrier (57%). The
changes refer mainly to the placement of bike lanes and adequacy of parking spaces. Public
transportation is one of the frequent complaints, regarding the quality of service and the
relationship between supply and demand. Despite these perceptions, some people do not
approve the changes occurring in Marques de Herval, but most elements investigated are
perceived positively by the interviewees.
Even elements that could be questioned as barriers, such as increasing population density,
increasing the number of people who move and live along the avenue, could interfere in
circulation. That was not perceived this way by the population and it was evaluated as a
facilitator by the great majority of interviewees. The architecture work and constructions as
the leveling of sidewalks, public services such as garbage collection and planning of spaces
that surround the implementation of the outdoor gyms and playgrounds were evaluated
positively by most interviewees. These elements, in addition to promoting the circulation
towards ensuring accessibility, also play a social role because they contribute to social
Factors of Activities and Participation: the results related to the category of activity
participation (Table 4) led to a slight difficulty in relation to engagement and participation of
people and activities. However, results on the learning and application of knowledge indicated
49% of people with difficulties in activities such as reading, writing or calculating. These are
elements that have influence on the prior learning of signs and rules that must be followed in
the circulation environment. A similar contradictory result was found in relation to mobility,
where it was possible to observe that over 60% of the interviewees did not report difficulties.
However, on issues that are directly related to the shift in the circulation environment, as the
ability to walk and use transport, a significant portion of the population (50%) reported having
difficulties.
Factors of Body Functions and Structures: the research focus was not on people with
disabilities previously identified, thus the results presented in Table 4 show the general
perception of respondents as a difficulty or a slight disability. However, on the analysis of
data presented in Figure 6 it is possible to identify that disabilities are present, even if they are
slight. An important result of this evaluation was that barriers on environmental factors are
not always subject to problems or disabilities identified in relation to functions and structures
of the body or the activity and participation, since 60% of the interviewees said they have no
difficulty or slight difficulty regarding access to public transportation.
In summary, for an improved welfare of residents, the results on Marques de Herval Avenue
pointed to a review of equipment and other architectural elements installed; a revision of
signaling devices, because of traffic conflicts; pollution control and improvements in public
transportation service.
Conclusion
This research has generated results that allowed to build an understanding about how the
population of a region, that has gone through an process of urbanization, perceives this
environment. It also relates the accessibility level of this project with their ability to engage in
daily activities or with difficulties related to body functions and structures. The approach
proposed allowed us to analyze not only the physical environment related to accessibility, but
also the way people see themselves in this environment based on the perception they have of
their health, capacity and functionality.
With the data analysis it was established that the understanding that people build on the
circulation environment regarding barriers or facilitators is not always determined by present
difficulties regarding their performance to develop actions, as walking on uneven terrain or
living with some kind of physical disability. Many interviewees, over 40%, considered it no
difficult in terms of functions and structure of the body, but when evaluating the
environmental factors considered them as moderate barriers. This result shows that an
inadequate project of urban infrastructure may be a limiting factor in relation to accessibility,
even for people without a diagnosed disability.
The identification of items in the field of political architecture and construction, transportation
services, quality of street lighting, among others, as significant barriers to accessibility reflect
social discontent with the process of urbanization. Urbanization projects, in general, such as
the one performed on Marques de Herval Avenue are perceived positively as a progress in
terms of accessibility to urban public spaces. Thus, the approach enables evaluations of urban
projects by the government, after implementation, regarding the perception of the people
involved and it can contribute to necessary adjustments in order to make projects more
The approach proposed allowed the evaluation of public space environment, establishing
relationships between the perception of environmental factors and the perception of
functioning and disability of users, contributing to the discussion about the analysis of
accessibility, depending on the users’ characteristics. The approach allows an analysis of
individual factors, as well as a comprehensive analysis of the interaction between factors
serving to other situations on accessibility analysis in urban public spaces.
The results allow the evaluation of these spaces in terms of social inclusion in public policies
regarding accessibility and for incorporation of instruments for urban management in order to
conceive projects of urban public spaces in universal scale. That can offer equal opportunities to various users’ segments of these spaces.
Given the application of the general structure of the approach tested in a case study, it was
observed that it is valid for environments where there have been recent interventions and may
not apply to already established environments, where the individual may have lost sensitivity
of such changes, or even generate many different perceptions of certain areas, because they
already are accustomed to the that environment and all its problems.
It means that it was possible to observe in research that people are sensitive to the problems of
urban public spaces, but they tend to be accustomed to it because of the time spent living with
those problems and they adapt to these distortions within their limitations. However, they
would like that those spaces could be adapted to their needs in order to improve their
well-being and increase time of use.
Suggestions for improvements will be specific for each case: the conditions of projects must
be investigated individually based on a previous consultation to involved population about
perception of that space and how they would like it to be built. This could help during project
conception stage; in equipment and public services improvement and in adjustment of
For future research, we can move forward discussing environmental factors, functionality and
health, seeking further validation experiments and other situations. Moreover, the analysis
incorporating perception of health and environmental factors could contribute in behavioral
models to predict the welfare perception of actors involved in urban projects even before their
deployment with prior adjustments and more funds to projects, in addition to immediate care
for those involved.
References
Albano, J. J. (2006) Circulação e mobilidade urbana. Porto Alegre, Brasil: LASTRAN, UFRGS.
Barber, P. J. e Legge, D. (1976) Perception and information. Essential Psychology Series, vol. A4.
Companhia de Desenvolvimento e Administração da Área Metropolitana de Belém - CODEM (2000) Cadastro técnico multifinalitário. Documento de Trabalho. Belém, Brasil.
Di Nubila, H. B. V. e Buchalla, C. M. (2008) O papel das Classificações da OMS – CID e CIF nas definições de deficiência e incapacidade. Revista Brasileira de Epidemiologia, vol. 11, n. 2.
Ewing, R. e Cervero, R. (2001) Travel and the built environment: a synthesis. Transportation
Research Record, n. 1780, pp. 87- 114.
Farias, N. e Buchalla, C. M. A. (2005) Classificação internacional de funcionalidade, incapacidade e saúde da Organização Mundial de Saúde: conceitos, usos e perspectivas. Revista de Epidemiologia, vol. 8, n. 2.
Instituto Brasileiro de Geografia e Estatística - IBGE (2010) Censo demográfico – população residente. Rio de Janeiro, Brasil.
Karsaklian, E. (2000) Comportamento do consumidor. São Paulo, Brasil: Atlas.
Likert, R. (1932) A technique for the measurement of attitudes. Archives of Psychology, n. 140, pp. 1-55.
Maia, H. F., Sousa, C. S. e Oliveira, K. G. F. (2011) Os debates ancestrais e atuais acerca do que é saúde e a classificação internacional de funcionalidade, incapacidade e saúde: contribuições para compreensão das possibilidades de uma política nacional de saúde funcional. Revista
Brasileira de Saúde Funcional, vol. 1, n. 1, pp. 1-11.
Martins, E. F., Silva, S. M. B., Fracon, J. F. e Cardoso, C. S. (2010) Experiência no uso combinado das classificações internacionais para descrever informações em saúde. Revista Brasileira de Ciências da Saúde, vol. 8, n. 26.
World Health Organization - WHO (2002) Rumo a uma linguagem comum para Funcionalidade, Incapacidade e Saúde – CIF. Documento de Trabalho. Genebra, Suíça.
World Health Organization - WHO (2003) Classificação Internacional de Funcionalidade, Incapacidade e Saúde: Classificação Detalhada com definições. Documento de Trabalho. Genebra, Suíça.
World Health Organization - WHO (2008) CIF: Classificação Internacional de Funcionalidade, Incapacidade e Saúde. Centro Colaborador da Organização Mundial da Saúde para a Família
Rio, V. D., Oliveira, L. (1996) Percepção Ambiental a experiência brasileira. São Paulo, Brasil: Studio Novel.
Rozestraten, R. J. A. (1988) Psicologia do Trânsito: conceitos e processos básicos. São Paulo, Brasil: EDUSP.
Scliar, M. (2007) PHYSiS. História do conceito de saúde. Revista de Saúde Coletiva, vol. 17, n. 10.
Patel, S., D´Cruz, C. e Burra, S. (2002) Beyond evictions in a global city; people-managed resettlement in Mumbai. Environment and Urbanization, vol. 14, n. 1, pp. 159-172.
Silva, L. J. M. e Egler, I. (2002) O estudo da percepção em espaços urbanos preservados. Encontro da
Associação nacional de Pós-Graduação e Pesquisa em Ambiente e Sociedade, Indaiatuba, São
Paulo, Brasil.
Tobias, M. S. G. (2009) A percepção dos atributos de transporte por ônibus frente a modos
alternativos: a preferência declarada do usuário. Belém: Editora Unama.
Appendix 1 - Questionnaire
Model for Evaluation of Users’ Perception of Urban Public Spaces Contextual Factors
I – Environmental Factors 1 Technology Products
1.1 How do you evaluate the architecture and construction of buildings for public usage? Entry and exit ( ) Barrier ( ) Facilitator;
1.2 How do you evaluate the influence of urban zone development in mobility? ( ) Barrier ( ) Facilitator
2 Natural environment and environmental changes made by human being 2.1 How do you evaluate land forms? ( ) Barrier ( ) Facilitator
2.2 How do you evaluate the demographic changes for mobility? ( ) Barrier ( ) Facilitator 2.3 How do you evaluate changes in population density for mobility? ( ) Barrier ( ) Facilitator 2.4 How do you evaluate the presence of plants? ( ) Barrier ( ) Facilitator
2.4 How do you evaluate the presence of animals? ( ) Barrier ( ) Facilitator
2.6 How do you evaluate the influence of climate? Temperature ( ) Barrier ( ) Facilitator / Humidity ( ) Barrier ( ) Facilitator / Rain ( ) Barrier ( ) Facilitator / Winds ( ) Barrier ( ) Facilitator / Seasonal Variation ( ) Barrier ( ) Facilitator
2.7 How do you evaluate street lights?: ( ) Barrier ( ) Facilitator
2.7 How do you evaluate sound level on streets?: ( ) Barrier ( ) Facilitator 2.9 How do you evaluate air quality? ( ) Barrier ( ) Facilitator
3 Services, systems and policies
3.1 How do you evaluate architecture and construction services, systems and policies? ( ) Barrier ( ) Facilitator
3.2 How do you evaluate open spaces planning services, systems and policies? ( ) Barrier ( ) Facilitator
3.3 How do you evaluate services, systems and policies of public services? ( ) Barrier ( ) Facilitator 3.1 How do you evaluate transportation services, systems and policies? ( ) Barrier ( ) Facilitator II- Activity and Participation
1 Learning and Knowledge Application
1.1 How do you evaluate your reading performance? ( ) 0 ( ) 1 ( ) 2 ( ) 3 ( ) 4 1.1 How do you evaluate your writing performance? ( ) 0 ( ) 1 ( ) 2 ( ) 3 ( ) 4 1.1 How do you evaluate your calculating performance? ( ) 0 ( ) 1 ( ) 2 ( ) 3 ( ) 4
1.4 How do you evaluate your performance in solving problems? ( ) 0 ( ) 1 ( ) 2 ( ) 3 ( ) 4 1.1 How do you evaluate your performance in making decisions? ( ) 0 ( ) 1 ( ) 2 ( ) 3 ( ) 4 2 Tasks and general demands
2.1 How do you evaluate your performance in accomplishing daily routine? ( ) 0 ( ) 1 ( ) 2 ( ) 3 ( ) 4 3 Communication
1.1 How do you evaluate your conversation performance? ( ) 0 ( ) 1 ( ) 2 ( ) 3 ( ) 4 4 Mobility
4.1 How do you evaluate your capacity in changing your basic position of the body? ( ) 0 ( ) 1 ( ) 2 ( ) 3 ( ) 4 4.1 How do you evaluate your capacity in keeping your basic position of the body? Standing ( ) 0 ( ) 1 ( ) 2 ( ) 3 ( ) 4
4.3 How do you evaluate your walking capacity? Short distances ( ) 0 ( ) 1 ( ) 2 ( ) 3 ( ) 4 Long distances ( ) 0 ( ) 1 ( ) 2 ( ) 3 ( ) 4 On different surfaces ( ) 0 ( ) 1 ( ) 2 ( ) 3 ( ) 4 Obstacles diversion ( ) 0 ( ) 1 ( ) 2 ( ) 3 ( ) 4
4.4 How do you evaluate your capacity of moving through different locations? Inside the house ( ) 0 ( ) 1 ( ) 2 ( ) 3 ( ) 4 Other buildings ( ) 0 ( ) 1 ( ) 2 ( ) 3 ( ) 4 Outside the house and buildings ( ) 0 ( ) 1 ( ) 2 ( ) 3 ( ) 4
4.5 How do you evaluate your capacity of moving using some kind of equipments? ( ) 0 ( ) 1 ( )2 ( ) 3 ( ) 4 ( ) It doesn't apply
4.6 How do you evaluate your transport usage? Human traction ( ) 0 ( ) 1 ( ) 2 ( ) 3 ( ) 4 Private motorized ( ) 0 ( ) 1 ( ) 2 ( ) 3 ( ) 4 Public transportation ( ) 0 ( ) 1 ( ) 2 ( ) 3 ( ) 4
4.7 How do you evaluate your driving performance? Human traction ( ) 0 ( ) 1 ( ) 2 ( ) 3 ( ) 4 Motorized ( ) 0 ( ) 1 ( ) 2 ( ) 3 ( ) 4 ( ) It doesn't apply
Appendix 1
–
Questionnaire (cont.)
5.1 How do you evaluate your participation in educational activities? ( ) 0 ( ) 1 ( ) 2 ( ) 3 ( ) 4 5.1 How do you evaluate your participation in work and job activities? ( ) 0 ( ) 1 ( ) 2 ( ) 3 ( ) 4 6 Community, social and civic life
6.1 How do you evaluate your participation in recreation and leisure activities ( ) 0 ( ) 1 ( ) 2 ( ) 3 ( ) 4 6.2 How do you evaluate your participation in religion and spirituality activities ( ) 0 ( ) 1 ( ) 2 ( ) 3 ( ) 4
6.3 How do you evaluate your participation in citizen and political activities ( ) 0 ( ) 1 ( ) 2 ( ) 3 ( ) 4 III- Body functions
1- Mental functions
4.3 How do you evaluate your orientation capacity? ( ) 0 ( ) 1 ( ) 2 ( ) 3 ( ) 4
1.2- How do you evaluate your energy and motivation in doing activities? ( ) 0 ( ) 1 ( ) 2 ( ) 3 ( ) 4 4.3 How do you evaluate your attention capacity? ( ) 0 ( ) 1 ( ) 2 ( ) 3 ( ) 4
4.3 How do you evaluate your memory capacity? ( ) 0 ( ) 1 ( ) 2 ( ) 3 ( ) 4
1.5- How do you evaluate your organizing, planning and managing capacity? ( ) 0 ( ) 1 ( ) 2 ( ) 3 ( ) 4
2- Sensory functions and pain
2.1- How do you evaluate your vision function? ( ) 0 ( ) 1 ( ) 2 ( ) 3 ( ) 4 2.1- How do you evaluate your audition function? ( ) 0 ( ) 1 ( ) 2 ( ) 3 ( ) 4
2.3- How do you evaluate your vestibular and balance functions? ( ) 0 ( ) 1 ( ) 2 ( ) 3 ( ) 4 3- Voice and speaking functions
3.1- How do you evaluate your voice regarding production and quality? ( ) 0 ( ) 1 ( ) 2 ( ) 3 ( ) 4 4 Neuromusculoskeletal and related to movement functions
4.1- How do you evaluate the mobility of your articulations? ( ) 0 ( ) 1 ( ) 2 ( ) 3 ( ) 4 4.2- How do you evaluate your muscular strength? ( ) 0 ( ) 1 ( ) 2 ( ) 3 ( ) 4
IV- Body structure
1- Structures related to movement:
1.1- How do you evaluate your bone structure? ( ) 0 ( ) 1 ( ) 2 ( ) 3 ( ) 4 1.2-How do you evaluate your ligament structure? ( ) 0 ( ) 1 ( ) 2 ( ) 3 ( ) 4
Personal data
1. Gender: M ( ) F ( ) 15. Age Bracket:15 to 25 years old ( ) 26 to 37 years old ( ) 38 to 48 years old ( ) 49 to 60 years old ( ) more than 60 years old
2. Occupation: ( ) wage-earner ( ) Self-employed ( ) Retired ( ) Civil Servant
( ) Housewife ( ) Liberal Professional ( ) Student 8. ( ) Others: specify________________________________ .
3. Income: ( ) Up to 1 MW; ( ) From 1MW up to 2MW ( ) From 2MW up to 4MW ( ) From 4MW up to 7MW
( ) From 7MW up to 10MW; ( ) Above 10MW
Appendix 2
–
Results
Contextual and Environmental Factors - Barriers Perception
1 Technology Products
Barrier
0 1 2 3 4
% Base % Base % Base % Base % Base
1.1)
Architecture and construction of buildings for public usage: entry and exit
5.0 5.0 7.0 7 4.0 4.0 7.0 7.0 6.0 6.0
1.2)
Influence of urban zone development in
mobility
8.0 8.0 4.0 4.0 9.0 9.0 7.0 7.0 4.0 4.0
2 Natural environment and environmental changes made by human being
% Base % Base % Base % Base % Base
2.1) Landforms 0.0 0.0 2.0 2.0 20.0 2.0 6.0 6.0 9.0 9.0
2.2) Demographic
changes 1.0 1.0 4.0 4.0 6.0 6.0 9.0 9.0 11.0 11.0
2.3) Population density
changes 7.0 7.0 8.0 8.0 7.0 7.0 15.0 15.0 7.0 7.0
2.4) Presence of plants 5.0 5.0 9.0 9.0 0.0 0.0 7.0 7.0 8.0 8.0
2.5) Presence of animals 7.0 7.0 23.0 23 23.0 23 8.0 8.0 10.0 10
2.6) Temperature 13.0 13 21.0 21.0 18.0 18.0 11.0 11.0 9.0 9.0
2.7) Humidity 9.0 9.0 13.0 13.0 18.0 18.0 26.0 26.0 8.0 8.0
2.8) Rain 3.0 3.0 21.0 21.0 15.0 15.0 19.0 19.0 9.0 9.0
2.9) Winds 6.0 6.0 7.0 7.0 6.0 6.0 9.0 9.0 8.0 8.0
2.10) Seasonal variation 9.0 9.0 9.0 9.0 23.0 23.0 19.0 19.0 8.0 8.0
2.11) Street lights 5.0 5.0 7.0 7.0 9.0 9.0 8.0 8.0 7.0 7.0
2.12) Sound level on
streets 10.0 10 8.0 8.0 11.0 11 32.0 32.0 11.0 11.0
2.13) Air Quality 4.0 4.0 25.0 25.0 28.0 28.0 13.0 13.0 9.0 9.0
3 Services, systems and
policies % Base % Base % Base % Base % Base
3.1)
Architecture and construction services, systems
and policies
4.0 4.0 2.0 2.0 11.0 11.0 7.0 7.0 6.0 6.0
3.2)
Open spaces planning services,
systems and policies?
5.0 5.0 2.0 2.0 11.0 11.0 9.0 9.0 9.0 9.0
3.3)
Services, systems, and policies of public services
5.0 5.0 7.0 7.0 11.0 11.0 13.0 13.0 5.0 5.0
3.4)
Transportation services, systems,
and policies
Appendix 2
–
Results (cont.)
Contextual and Environmental Factors - Facilitators Perception
1 Technology Products
Barrier
0 1 2 3 4
% Base % Base % Base % Base % Base
1.1)
Architecture and construction of buildings for public usage: entry and exit
9.0 9.0 13.0 13.0 11.0 11.0 21.0 21.0 17.0 17.0
1.2)
Influence of urban zone development in
mobility
8.0 8.0 9.0 9.0 13.0 13.0 14.0 14.0 24.0 24.0
2 Natural environment and environmental changes made by human being
% Base % Base % Base % Base % Base
2.1) Landforms 5.0 5.0 9.0 9.0 7.0 7.0 19.0 19 23.0 23
2.2) Demographic
changes 2.0 2.0 6.0 6.0 11.0 11 22.0 22 28.0 28
2.3) Population density
changes 1.0 1.0 4.0 4.0 14.0 14 17.0 17.0 20.0 20
2.4) Presence of plants 6.0 6.0 7.0 7.0 9.0 9.0 18.0 18.0 31.0 31
2.5) Presence of animals 0.0 0.0 6.0 6.0 8.0 8.0 11.0 11.0 4.0 4.0
2.6) Temperature 0.0 0.0 7.0 7.0 5.0 5.0 7.0 7.0 9.0 9.0
2.7) Humidity 8.0 8.0 1.0 1.0 7.0 7.0 8.0 8.0 2.0 2.0
2.8) Rain 3.0 3.0 6.0 6.0 5.0 5.0 7.0 7.0 12.0 12
2.9) Winds 4.0 4.0 6.0 6.0 20.0 20.0 12.0 12.0 22.0 22
2.10) Seasonal variation 4.0 4.0 6.0 6.0 5.0 5.0 9.0 9.0 8.0 8.0
2.11) Street lights 4.0 4.0 7.0 7.0 13.0 13.0 11.0 11.0 29.0 29.0
2.12) Sound level on
streets 5.0 5.0 4.0 4.0 8.0 8.0 6.0 6.0 5.0 5.0
2.13) Air Quality 6.0 6.0 3.0 3.0 5.0 5.0 5.0 5.0 2.0 2.0
3 Services, systems and
policies % Base % Base % Base % Base % Base
3.1)
Architecture and construction services, systems
and policies
7.0 7.0 5.0 5.0 21.0 21.0 28.0 28 9.0 9.0
3.2)
Open spaces planning services,
systems and policies?
3.0 3.0 8.0 8.0 11.0 11.0 23.0 23 19.0 19.0
3.3)
Services, systems, and policies of public services
6.0 6.0 11.0 11.0 15.0 15.0 18.0 18 9.0 9.0
3.4)
Transportation services, systems,
and policies
Appendix 2
–
Results (cont.)
Perception of factors connected to activities and participation
1 Learning and Knowledge
Application 0 1 2 3 4
% Base % Base % Base % Base % Base
1.1) Reading performance 54.0 54 25.0 25 11.0 11.0 6.0 6.0 4.0 4.0
1.2) Writing performance 47.0 47.0 21.0 21.0 22.0 22.0 10.0 10.0 0.0 0.0
1.3) Calculating
performance 38.0 38.0 31.0 31.0 20.0 20.0 9.0 9.0 2.0 2.0
1.4) Performance in
solving problems 39.0 39.0 32.0 32.0 10.0 10.0 13.0 13.0 6.0 6.0
1.5) Performance in
making decisions 41.0 41 26.0 26.0 17.0 17.0 11.0 11.0 5.0 5.0
2 Tasks and general demands % Base % Base % Base % Base % Base
2.1)
Performance in accomplishing daily
routine
58.0 58 15.0 15 19.0 19 3.0 3 5.0 5.0
3 Communication % Base % Base % Base % Base % Base
3.1) Conversation
Appendix 2
–
Results (cont.)
4 Mobility % Base % Base % Base % Base % Base
4.1) Changing basic
position of the body 0.0 0.0 6.0 6.0 8.0 8.0 11.0 11.0 4.0 4.0
4.2) Keeping basic position
of the body: standing 0.0 0.0 7.0 7.0 5.0 5.0 7.0 7.0 9.0 9.0
4.3) Walking capacity:
short distances 8.0 8.0 1.0 1.0 7.0 7.0 8.0 8.0 2.0 2.0
4.4) Walking capacity: long
distances 3.0 3.0 6.0 6.0 5.0 5.0 7.0 7.0 12.0 12
4.5) Walking capacity: on
different surfaces 4.0 4.0 6.0 6.0 20.0 20.0 12.0 12.0 22.0 22
4.6) Walking capacity:
obstacle diversion 4.0 4.0 6.0 6.0 5.0 5.0 9.0 9.0 8.0 8.0
4.7) Moving: inside the
house 4.0 4.0 7.0 7.0 13.0 13.0 11.0 11.0 29.0 29.0
4.8) Moving: other
buildings 5.0 5.0 4.0 4.0 8.0 8.0 6.0 6.0 5.0 5.0
4.9) Moving: outside the
house and buildings 6.0 6.0 3.0 3.0 5.0 5.0 5.0 5.0 2.0 2.0
4.10) Moving using some
kind of equipment 53.0 53.0 27.0 27.0 12.0 12.0 6.0 6.0 2.0 2.0
4.11) Transportation Usage:
Human traction 57.0 57 19.0 19.0 11.0 11.0 9.0 9.0 4.0 4.0
4.12)
Usage of private motorized transportation
64.0 64.0 27.0 27 4.0 4.0 2.0 2.0 3.0 3.0
4.13) Public transportation
usage: 40.0 40.0 20.0 20.0 28.0 28.0 7.0 7.0 5.0 5.0
4.14) Driving capacity:
human traction 43.0 43.0 29.0 29.0 19.0 19.0 7.0 7.0 2.0 2.0
4.15) Driving capacity:
motorized 41.0 41.0 12.0 12.0 28.0 28.0 13.0 13.0 6.0 6.0
5 Main areas of life % Base % Base % Base % Base % Base
5.1) Educational activities 39.0 39.0 32.0 32.0 11.0 11.0 12.0 12.0 6.0 6.0
5.2) Work and job activities 62.0 62 29.0 29.0 2.0 2.0 4.0 4.0 3.0 3.0
6 Community, social and civic
life % Base % Base % Base % Base % Base
6.1) Recreation and leisure
activities 41.0 41 32.0 32 19.0 19 5.0 5 3.0 3
6.2) Religion and
spirituality activities 39.0 39 26.0 26 13.0 13 11.0 11 11.0 11
6.3) Citizen and political
Appendix 2
–
Results (cont.)
Perception of factors connected to body functions and structures
1 Mental functions 0 1 2 3 4
% Base % Base % Base % Base % Base
1.1) Orientation capacity 44.0 44.0 39.0 39.0 7.0 7.0 7.0 7.0 3.0 3.0
1.2) Energy and motivation
in doing activities 39.0 39.0 37.0 37.0 16.0 16 7.0 7.0 1.0 1.0
1.3) Attention capacity 41.0 41.0 32.0 32.0 15.0 15 10.0 10.0 2.0 2.0
1.4) Memory capacity 36.0 36.0 32.0 32.0 15.0 15 15.0 15.0 2.0 2.0
1.5) Organizing, planning
and managing capacity 36.0 36.0 29.0 29.0 22.0 22 5.0 5.0 8.0 8.0
2 Sensory functions and pain % Base % Base % Base % Base % Base
2.1) Vision function 46.0 46 35.0 35 11.0 11 5.0 5 3.0 3
2.2) Audition function 60.0 60 28.0 28 8.0 8 2.0 2 2.0 2
2.3) Vestibular and balance
function 58.0 58 26.0 26 11.0 11 3.0 3 2.0 2
3 Voice and speaking
functions % Base % Base % Base % Base % Base
3.1) Voice regarding
production and quality 66.0 66 15.0 15 9.0 9 8.0 8 2.0 2
4 Neuromusculoskeletal and related to movement functions
% Base % Base % Base % Base % Base
4.1) Mobility of
articulations 53.0 53 22.0 22 14.0 14 7.0 7 4.0 4
4.2) Muscular strength 55.0 55 26.0 26 7.0 7 8.0 8 4.0 4
5 Structures related to
moviment % Base % Base % Base % Base % Base
5.1) Bone structure 39.0 39.0 32.0 32.0 11.0 11.0 12.0 12.0 6.0 6.0