ORIGINAL ARTICLE
A system dynamics approach to analyse the impact of energy
efficiency policy on ESCO ventures in European Union
countries: a case study of Portugal
Carlos Capelo&João Ferreira Dias&Renato Pereira
Received: 16 May 2017 / Accepted: 9 January 2018 / Published online: 19 January 2018 # Springer Science+Business Media B.V., part of Springer Nature 2018
Abstract The development of a competitive and sus-tainable market for energy performance contracting (EPC) projects supplied by energy service companies (ESCO) may contribute to realising the existent poten-tial of energy savings. Nevertheless, in different coun-tries, like Portugal, this market is still immature and remains far below its promised potential. Different from the existent research that assumes factors operate inde-pendently and focusses on how to remove barriers to the adoption of EPC, this study provides insights into how delayed impacts from interdependent policies affect the business processes of an energy service business ven-ture. To understand the relationships beneath the dy-namics of those small and developing ESCO markets in the European Union (EU), a system dynamics model of an ESCO venture was developed. The model simu-lation provides a powerful tool to improve understand-ing and accelerate learnunderstand-ing of the policies that critically impact venture performance. The base case simulation shows an unattractive market value added (MVA) and a
high probability of a firm’s failure. The demand simu-lation is quite sensitive to the word-of-mouth (WOM) parameter, and simultaneous initiatives to positively intensify it with incentive public policies such as low interest rate and demonstration projects significantly increased the MVA, reduced the probability of the firm’s failure, and consequently increased the widespread adoption of EPC.
Keywords Energy service company (ESCO) . Energy efficiency . Energy policy . Business simulation . System dynamics
Introduction
Energy efficiency projects based on energy performance contracting (EPC) consist of the implementation of measures that enhance energy efficiency. EPC is an agreement between the facility user or owner and the supplier, also known as energy service company (ESCO). Under EPC, the ESCO designs and puts to-gether a set of measures to improve energy efficiency, or a green energy project, and utilises the stream of gain flows from energy cut-backs, or the renewable energy produced, to repay the investment project, including the initial outflow (Bertoldi et al.2006). This kind of agree-ment aims at running-over financial restrictions of ener-gy efficiency projects by replacing upfront costs with future savings consequential from decreased energy ex-penditures. According to many energy efficiency advo-cates, the development of a competitive EPC market
https://doi.org/10.1007/s12053-018-9617-9
C. Capelo (*)
Universidade Europeia, Quinta do Bom Nome, Estrada da Correia, 53, 1500-210 Lisbon, Portugal e-mail: [email protected] J. Ferreira Dias Lisbon, Portugal e-mail: [email protected] R. Pereira
OBSERVARE/UAL, Rua Santa Marta, 47, 1150-293 Lisbon, Portugal
may contribute to realising the existent potential of energy savings.
However, in different European countries, this mar-ket is yet to be developed and remains far below its awaited potential. An important question remains: what policies, including public ones, might increase the suc-cess of ESCO ventures? Regardless of the considerable number of studies on the factors affecting the ESCO market (e.g. Bertoldi et al.2006,2014; Hansen2011; Kindström et al. 2017; Marino et al. 2010; Patari and Sinkkonen2014; Soroye and Nilsson2010; Vine2005), there has been little attention to analysing the business processes involved in an energy service business ven-ture. Previous research has generally focussed on what policies remove barriers to the adoption of EPC, and many of them assuming that factors operate indepen-dently and have linear and noncircular causality. The critical issue is to comprehend the key factors surround-ing the early stages of an ESCO venture and the dynam-ic interactions among them, as they act interdependently and some impacts are delayed. Once identified, it is expected that more effective policies that drive the eco-nomic success of a business venture will be implement-ed to increase the widespread adoption of EPCs.
To gather insight into this issue, a system dynamics model was developed representing the entrepreneurial processes of an ESCO venture in Portugal, as a repre-sentative of a small and developing ESCO market in a European Union (EU) country.
The model simulation provides a powerful tool to improve understanding and accelerate learning regard-ing the policies that critically impact venture perfor-mance. Its algebraic structure of interlinked variables allows the prospective analyses through simulation of the behaviour of some key business variables when several policy measures are implemented.
The remainder of the paper is organised as follows: The following section relates the energy efficiency gap to the development of ESCO markets, presents some specific aspects of EPC and ESCO, describes market failures and barriers limiting the growth in EU ESCO market, and gives an overview of the current status of
the ESCO market in Portugal. Section‘Objectives and
methodology’ presents the goals and methods of the
present study. Section ‘Model development’ describes
the development of the system dynamics model representing an ESCO venture. The following section discusses the results of model simulation and analyses the performance impact of certain government policies.
Finally, the main conclusions, limitations, and further work are presented.
Closing the energy efficiency gap through ESCOs Energy efficiency gap and ESCOs
Many countries around the world have implemented policies to improve energy efficiency. Regardless of the advancement in energy efficiency throughout times, there is still a huge room for supplementary energy savings in several business industries (Deng et al. 2012; Worrell et al.2009) through the implementation of public policies that remove previously identified bar-riers to energy efficiency (Sardinou 2008; Thollander and Ottosson2008; Trianni et al.2013). According to the opinions of different energy efficiency scholars and policy makers, a significant amount of the potential for improving energy efficiency would be successfully realised through the development of a competitive and
sustainable ESCO market (Steinberger et al. 2009;
Painuly et al. 2003; Bertoldi et al. 2006; Soroye and Nilsson 2010). Previous studies provide support that
ESCOs reduce energy use (Fang et al. 2012), and
Heiskanen et al. (2011) analysed the role that entrepre-neurial firms, such as ESCOs, play in establishing dif-fusion paths to foster more energy efficient technolo-gies. Okay and Akman (2010) investigated the relation-ships among the ESCO indicators and the country indi-cators and observed that either the ineffectiveness of ESCOs or the lack of saturation of ESCO markets may limit the improvement of energy efficiency in the ma-jority of the countries examined.
Nature of EPC and ESCOs
In a typical energy efficiency project supported by an EPC, the ESCO may (a) perform energy audits, project design, and engineering; (b) install new energy conver-sion, distribution, and/or control equipment at the client site; (c) finance this investment or assist in obtaining financing for the client; (d) operate and control some equipment and monitor and verify performance in terms of energy efficiency; (e) guarantee a particular level of savings in energy consumption or energy costs; and (f) take on the majority of the risks related to the perfor-mance of the energy efficiency project, including equip-ment performance risk and credit risk.
Financing an energy efficiency project through EPC relates to the funding sources for energy conversion and equipment control. Generally speaking, one could men-tion three wide financing solumen-tions for supporting EPC energy efficiency projects: energy client financing, ESCO financing, and third-party financing (Thumann
and Woodroof 2009). The current research considers
ESCO financing, as this option is considered to be a proper solution in developing markets where clients take no financial risk (Dreessen2003). Under an EPC con-tract, the energy gains are divided according to a pre-arranged rate. This percentage depends on the cost of the project, the length of the contract, and the risks taken by the ESCO and the consumer. In this arrangement, the ESCO takes on the majority of risks related to the performance of the efficiency project provision in addi-tion to the credit risk.
The ESCO market in the EU
The application of the EPC mechanism for energy effi-ciency improvements has not been as widespread as expected, however, and many investment opportunities still remain unexploited (e.g. Brown2001; Hannon et al. 2013; Kindström et al. 2017; Kostka and Shin 2013;
Limaye and Limaye2011; Patari and Sinkkonen2014;
Patari et al.2016). Researchers describe various market failures and internal and external barriers limiting EPC adoption and the growth in ESCO market. Although each country and sector is different, several common factors impeding ESCO business have been reported. Poor economic attractiveness of ESCO projects due to decreasing availability of highly cost-effective projects (Goldman et al.2005), heavy capital needs, long pay-back periods, long project cycles (Deng et al. 2014;
Taylor et al. 2008), uncertain energy savings due to
efficiency performance variation and energy price fluc-tuation (Deng et al. 2015), and high transaction costs (Patari et al.2016). Clients devote low priority to energy efficiency projects and economic incentive depends up-on external factors such as the energy price (Bertoldi et al. 2006; Vine 2005); non-compatible legal frame-works, public procurement and accounting rules (e.g.
Bertoldi and Boza-Kissb 2017; Marino et al. 2010;
Roshchanka and Evans2016; Vine2005); lack of
ap-propriate forms of finance (e.g. Bertoldi et al. 2006; Hansen2011); short track record and low awareness of the EPC concept among customers and financial insti-tutions (e.g. Backlund and Eidenskog2013; Kindström
et al.2017; Marino et al.2010; Patari and Sinkkonen 2014; Soroye and Nilsson2010); lack of accepted and standardised measurement and verification procedures for determining project savings (e.g. Marino et al.2010; Mills et al.2006); and lack of technical, business, mar-ket, financial, and management skills (Okay and Akman 2010; Taylor et al.2008).
According to Marino et al. (2011), the ESCO
market in the EU and bordering countries still has far to go in order to take advantage of its full capacity, even in countries with a more developed
market. Hannon et al. (2013) investigated how
ESCOs have progressed within the UK energy sector and concluded that the ESCO business mod-el has not yet managed to reach a rmod-elevant stage in that industry. The 2013 ESCO market report
(Bertoldi et al. 2014; Bertoldi and Boza-Kissb
2017) provides an up-to-date snapshot of the key
developments of the EU markets as well as of some non-EU countries. It concludes that most of the countries have grown since 2010, but only a few have demonstrated strong growth (e.g. Den-mark, France, Ireland, and Spain). According to the report, one or more of the following market qualities had been established between 2010 and 2013 in the process of maturation: (a) the markets are becoming demand driven; (b) policies ac-knowledge and support the ESCO solution; (c) facilitators (e.g. energy audit companies) exist and are effective; (d) ESCO associations have been set up; (e) model contracts, standards, and/or in-tensive information dissemination are developed and carried out by third parties/market facilitators; and (f) participation of a wide array of companies, including consultants, ESCOs, utilities, and energy suppliers indicate an open and competitive market. Nevertheless, ESCO markets in European coun-tries are far from reaching their potential, so it is important to mitigate or remove major barriers that are different for large national markets (e.g. Aus-tria, Germany, and the UK) and small ones (e.g. Portugal, Hungary, the Baltics, and Serbia). In smaller national markets, like Portugal, supportive legislative frameworks and effective incentive pol-icies are lacking, trust between ESCO and clients is low, and financing is quite difficult; however, in the larger markets, the barriers are more related to competition with in-house activities and high trans-action costs (Bertoldi et al. 2014).
The ESCO market in Portugal
In May 2008, the Portuguese government published the National Energy Efficiency Action Plan. The objectives were to cut 10% of final energy consumption by 2015 and at the same time create and promote ESCOs. Then, in 2010, the Portuguese National Energy Strategy pro-moted energy efficiency aiming at a 20% reduction in final energy consumption by 2020. This strategic plan reinforced that the development of the ESCO market was a priority as this would create an energy efficiency industry with long-term relevance.
The situation of the Portuguese ESCO market is described by Bertoldi et al. (2014). The markets for efficient technologies and energy services have been developing since 2008, mainly fostered by the energy efficiency initiatives of the government. Some of those initiatives require industries to perform energy audits and to present and implement energy efficiency projects containing specific measures to reduce energy con-sumption. However, the main driver for the growth is assumed to be public procurement, given the financial weakness of the private sector and the low awareness and trust of EPC contracts. Thus, in 2011, the Portu-guese government established new procurement rules to facilitate long-term EPC agreements between ESCOs and public administration.
The Portuguese ESCO market represents about M€ 10 to 30 and has been growing at a slow rate to a potential estimate of M€ 100 to 200 (Bertoldi and
Boza-Kissb2017). Around 10 firms have declared that
they are ESCOs, although other types of non-performance-based contracts are much more frequent (Marino et al.2010). Only a few firms are members of the National ESCO Association, and most of those companies are very small and reported several difficul-ties mainly associated with the funding and financing of EPC contracts.
Objectives and methodology
This study explores how to create successful ESCO ventures in small European markets. The main issue is to identify the most crucial factors involved in ESCO processes and understand the dynamic interactions among those factors that will determine long-term firm performance. To provide insight into the research prob-lem, a system dynamics model was developed and
simulated, representing an ESCO venture. The main objective is to identify and recommend political initia-tives that promote reinforcing mechanisms supporting a viable and sustainable development of ESCOs and the dissemination of EPC as an effective means for enhanc-ing energy efficiency.
The study was conducted in Portugal for conve-nience, as the authors have knowledge and data of its ESCO market. This market is in a similar development stage as other small EU markets like Hungary and the Baltic countries, and all of them have the same main barriers: lack of supportive legislative framework and effective incentive policies, difficulties in financing pro-jects, and low trust among actors. The common EU legislation, firms’ managerial processes, and the exis-tence of similar market barriers support our hope that this research process and its conclusions will offer useful insights to others studying or working in EU countries with small and underdeveloped ESCO markets. System dynamics modelling
The system dynamics (SD) approach has been used to investigate the dynamic and complex nature of socio-economic systems in various scientific domains
(Sterman 2000). Various fields within public policy
studies have used this approach to study complex prob-lems. In particular, SD has a valuable track record for studies in the energy sector (for example Dyner et al. 2009; Ford2008). Miller and Sterman (2007) developed a SD model representing a new clean energy technology venture. More recently, Blumberga et al. (2014) applied SD to explore the impact of different national consumer-oriented energy efficiency policies in Latvia’s residen-tial building sector. SD translates the understanding on real world problems into‘glass-box’ simulation models, as they make explicit the relations among variables (i.e. the structure of the computational model underlying the simulations), thus providing powerful learning environ-ments for understanding complex problems. By experimenting with this prototype of the system (the real world) at hand, we can relate the perceived structure of a system to its behaviour over time and gain further knowledge about the system.
Several public policy studies have used this method-ology to explore complex problems. The pertinence and legitimacy of using SD in such policy studies derives from its faculty to capture dynamical structural elements such as feedback loops, time delays, and accumulation
of flows into stocks. These attributes combine to create models with nonlinear and non-intuitive behaviour that can often provide useful insight into the behaviour of the
complex problem being modelled (Sterman2000). SD
modelling tries to discover and represent those building blocks, which may be described as follow. The feedback loop occurs when the level of a variable is changed directly or indirectly as a result of some prior change in its level. Feedback loops may have a reinforcing or balancing nature. A loop type may be identified by imagining that the effect of a change in a variable is propagated link-by-link around loop (Morecroft2015). A reinforcing loop is one where an increase in that variable leads to a further increase in itself. An example of a reinforcing loop is the wage-price spiral. Higher wages leads to higher prices, which in turn increase the wages etc. A balancing loop on the other hand is goal seeking leading to stabilising behaviour. Thus, an in-crease in that variable leads to a counterbalancing de-crease in itself. An example of balancing loop is the central heating system. It ascertains that the room tem-perature will remain within a certain range. A delay occurs when a given cause leads to an effect, but not immediately. Sometimes the consequences of an action or decision are not apparent until several days, months, or even years after an event has taken place. Such time delays add dynamic complexity because cause and ef-fect is less obvious. Any feedback loop in a SD model contains at least one stock and one flow. A stock repre-sents a system entity that accumulates or depletes over time (e.g. the amount of inventory or the number of employees at a certain point of time) and a flow affects the rate of change in the stock. Dynamic behaviour is the result of flows accumulating in stocks. In other words, stocks are a kind of memory storing the results of past actions (Morecroft2015). They represent the observed state of the system and their value can only be changed through the actions of flows, but it takes time. A delay is involved in changing any stock, be it inventory or the number of employees. For instance, the number of employees is increased by new employees hired (inflow) and decreased by employees leaving the firm (outflow). The flows can be controlled by decision policies, which in turn are embedded in feedback loops. For example, if desirable workforce (an auxiliary vari-able) exceeds actual number of employees (the stock), a decision will be made to hire new employees and thus increase the number of employees in the firm, closing
the gap between desired and actual workforce (a balancing feedback loop).
Causal loop diagrams can be used as visual tools for revealing cause and effect relationships and feedback processes. The basic elements are‘variables’ (words or phrases) and‘links’ (arrows). A ‘variable’ represents a condition, situation, action, or decision with can influ-ence, and can be influenced by, other variables. A‘link’ (arrow) indicates a causal association between two
var-iables. Causal relationships are indicated by ‘+’ or
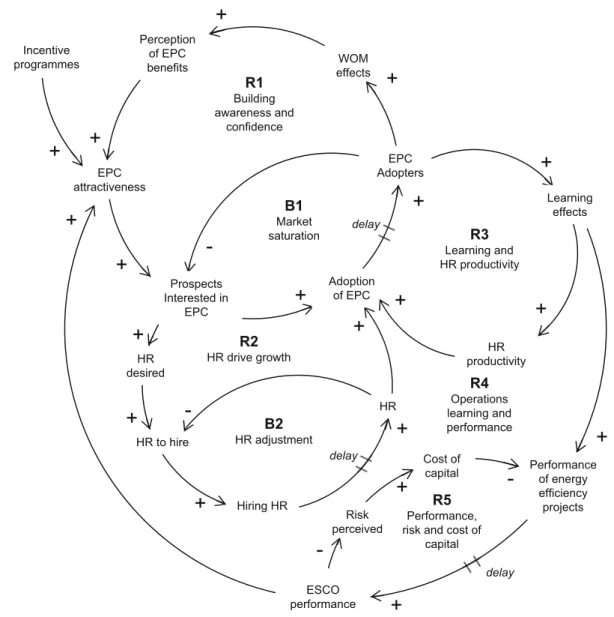
‘−‘signs, where ‘+’ means a positive influence, while ‘−’ indicates a negative influence. The notation ‘| |’ on the arrow is used to denote delay in the cause-and-effect relationship. The letter ‘R’ inside a loop indicates a reinforcing feedback process, and the letter‘B’ denotes a balancing loop. At the same time, each loop can be named with a mnemonic for the underlying feedback
process. For example, Fig.1 shows a reinforcing loop
called‘R1 - Building awareness and confidence’. That loop includes a positive relationship between‘Prospects
interested in EPC’ and ‘Adoption of EPC’. That link
contains a delay symbol‘| |’, which denotes a time delay. The more prospects are interested in EPC, the more prospects will adopt EPC, but it takes a while (months) for interested prospects to become full EPC adopters.
As dynamic behaviour is the result of flows accumu-lating into stocks, an essential feature of a SD model is the way in which the system being analysed is described in terms of stocks and flows. Symbols representing stocks, flows, variables (called auxiliaries), constants, and information links are used to create graphical rep-resentations of the system’s structure in stock and flow diagrams. Stocks are represented by squares and the accompanying flows by double arrows. Flows are con-trolled by flow rates represented by valves. Auxiliary variables are used to combine or reformulate informa-tion and are represented by circles. Auxiliaries are used to model information, so they change with no delay, instantaneously. Flow rates and auxiliaries are defined in the same manner. The difference is that the flow rate is connected to the flow valve and thereby controls the flow directly. Constants variables remain constant over the time period of the simulation. A diamond represents these constants. Connections are made among con-stants, auxiliaries, flow rates, and stocks by means of information links, which are represented by thin arrows or connectors. They can be inputs to flows, but never directly to stocks, because flows are the only variables that change their associated levels. Stocks, however, can
be inputs to auxiliaries and flow rates. For example, we can observe the diagram presented in Fig.3. The square ‘HR’ represents the number (stock) of employees and the valve‘HR Hiring Rate’ represents the rate (flow) of new employees hired. The cloud symbols represent the boundaries of the system being modelled (e.g. people/ employees arrive from the environment of the defined system and are returned to the environment). The aux-iliary variable‘HR to Hire’ and the constant ‘Average Time to Hire and Train’ determine the flow rate ‘HR
Hiring Rate’ which controls the inflow of new
employees.
In a SD model, the structure of the system is repre-sented mathematically. Model simulation consists of
accumulation (or integration) of the flows that cause the stocks to change. Thus, when creating a stock and flow diagram in a SD computer package, every variable in the model is defined by an equation.
Model development
To provide insight into the research problem, a SD model was developed with the Powersim code representing the market, operations, human resources, and cash flow for an ESCO venture. The simulation model was created according to the process described in Sterman (2000) that includes the following steps: (a)
R1 Building awareness and confidence
+
B1 Market saturation delay -WOM effects Perception of EPC benefits EPC attractiveness EPC Adopters+
-+
+
+
+
+
+
+
R3 Learning and HR productivity Prospects Interested in EPC Adoption of EPC Learning effects HR productivity HR desired HR to hire HR Hiring HR delay ESCO performance Performance of energy efficiency projects Risk perceived Cost of capital R5 Performance, risk and cost ofcapital R4 Operations learning and performance R2 HR drive growth B2 HR adjustment delay
-+
+
+
-+
+
+
+
+
+
Incentive programmes+
problem articulation (including historical behaviour of the key variables); (b) formulation of a qualitative model (dynamic hypothesis) that explains the dynamics as endogenous consequences of the feedback structure, using causal loop diagrams and stock and flow maps; (c) construction of the quantitative model, specifying the variables, constants, and equations, and estimating the parameters and initial conditions; (d) model testing and validation; and (e) policy design and evaluation.
A literature review, document content analysis, inter-views, and a case study were conducted in order to define the structure and assumptions incorporated into the model. A qualitative content analysis on relevant documents was performed, and a set of interviews were conducted to gather insight and practical experience from energy efficiency specialists, energy authorities, ESCO professionals, and energy end-users regarding the creation of an ESCO venture in the Portuguese market. That data were analysed to capture the critical variables and their relationships to build a representation of the problem structure as stock and flow diagrams. Then, the quantitative simulation model was obtained by defining equations, assumptions, and initial values. The reference mode (historical behaviour of the key variables), parameters and initial values definition, and model calibration and validation were performed using data collected from a case study of an ESCO venture. Causal loop diagram
The initial analysis of the data surveyed suggests some reinforcing (R) and balancing (B) feedbacks that could
support the development of an ESCO venture. Figure1
depicts those loops.
Building awareness and confidence (reinforcing loop R1): As reported in literature reviewed, low awareness and scepticism towards the potential benefits of EPC was one of the most commonly reported barriers to the deployment of EPC projects. Most potential clients are ignorant of the concept or are reluctant to adopt EPC. According to data gathered, the awareness and percep-tion of EPC benefits play an important role in the adoption process. The benefits of EPC offered by the ESCO must be known and understood to improve its attractiveness. The ESCO case study revealed that the power of word-of-mouth (WOM) marketing among clients and government communication initiatives are determining factors to influence the EPC awareness and attractiveness. The building awareness and confidence
reinforcing loop is described as follows. As the ESCO launches its services into the market, there exists low interest in EPC due to the unusual underlying business model. As the first prospects implement EPC projects with the ESCO, they may contact other prospects, make them aware, make them interested, and encourage them to engage in EPC projects. As more prospects imple-ment EPC projects, they communicate favourable WOM concerning their energy efficiency impacts, ac-celerating the diffusion of EPC practices and benefits. The adoption process will be extremely long because prospects need to be moved up through several phases until they become full EPC adopters (this is indicated by the time delay symbol placed in the link between ‘Pros-pects interested in EPC’ and ‘Adoption of EPC’).
Market saturation (balancing loop B1): Market satu-ration induces a balancing loop that limits the growth of EPC adopters. The more the EPC adopters in the sys-tem, the fewer the potential projects and the lower the expected new profits from EPC.
HR (human resources) drives growth (reinforcing loop R2): As more prospects become interested in implementing EPC projects with the ESCO, the work-force required to be able to capture those business opportunities increases, driving HR adjustment deci-sions. By hiring new employees, the firm will be able to assign additional HR effort to business operations, and thus more prospects will become EPC adopters.
HR adjustment (balancing loop B2): This balancing loop seeks to adjust the number of employees in the firm. The parameter HR to hire is defined as the differ-ence between desired workforce (HR desired) and existing workforce (HR). The link between Hiring HR and HR includes a delay representing the time needed to recruit, hire, and train new employees.
Learning and HR productivity (reinforcing loop R3) and Operations learning and performance (reinforcing loop R4): Learning effects in increasing EPC capabili-ties are often mentioned as important drivers for de-creasing EPC cost elements and inde-creasing the certainty of the estimated future savings. Thus, one of the most important reinforcing feedbacks is supposed to be the virtuous learning-accumulation of experience loop. This learning process will create and enhance the capabilities of the ESCO for marketing, selling, defining, and implementing EPC projects. As the ESCO employees are engaged in EPC projects they gain further experi-ence and improve their technical, financial, marketing, sales, and management abilities to develop the market,
and thus they improve their productivity in all the ESCO activities. Project design and future energy savings are enhanced, and most project processes become more productive and less costly. Higher EPC performance increases EPC attractiveness and encourage further adoption.
Performance, risk, and cost of capital (reinforcing loop R5): Estimating energy savings potential and per-formance verification involves volatility data, which is an important source of risk. This perceived risk forces lenders to increase the cost of borrowing, which in turn erodes the intrinsic cost-effectiveness of EPC projects and lowers the overall level of available financial re-sources. As the ESCO improves its capabilities and increases value creation through EPC business, share-holders will start seeing the EPC business as a less risky business or as a promising market niche and will grad-ually require a lower interest rate.
Incentive programmes: It is assumed that subsidies and government programmes supporting energy effi-ciency projects and EPC may be useful to foster the initial moves of this industry. Financial incentives and programme deadlines played a powerful role in making EPC attractive for many clients. Beyond providing a source of financing, subsidy programmes presented firm deadlines, which fostered a sense of urgency for action that drives EPC adoption. Some examples are incentive policies to subsidise a part of energy audit costs or the interest rate on debt.
Stock and flow diagrams
This section presents a description of the simulation model. The model includes feedback relationships that represent the previously discussed dynamics. The sim-ulation model is divided into five different sectors that will then be described in more detail: Marketing (pros-pect chain), HR (human resources), Operations (this sector addresses the assignment of human resources to business activities), Finance, and EVA (Economic Value Added).
Market sector
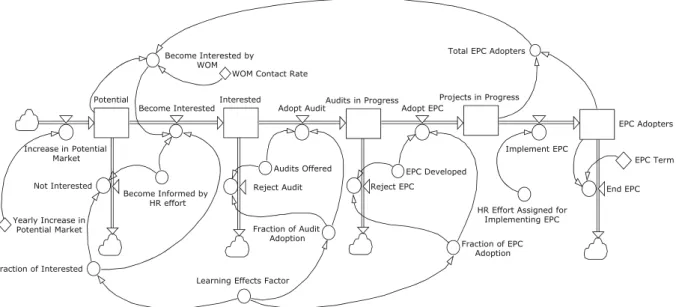
The market contains commercial buildings that have potential for EPC projects. The model representing the process of market development depicts the adoption cycle as working through a series of stages. This struc-ture is based on Warren (2008, pp. 345–356) and the
Bass diffusion model (Bass1969). Figure2presents a stock-flow map of this model sector. Potential prospects are moved up through four stages until they become full EPC adopters: Interested (gaining prospect interest), Audits in Progress (selling and performing energy au-dit), Projects in Progress (contracting and implementing EPC project), and EPC Adopters.
The Potential stage represents buildings capable of implementing an EPC efficiency project. This stock contains prospects whose managers are not informed or are not interested in EPC. The Interested stock in-cludes those prospects with potential for implementing energy efficiency projects that are informed and interested in adopting EPC. Once prospects have become informed on EPC benefits and adopt a positive attitude towards the EPC model, they move from Potential stock to Interested stock. The rate of that flow is determined by marketing effort and the effect WOM communication between potential prospects and those who already adopted EPC. As described previously, the WOM effect is assumed to b e a d e t e r m i n i n g f a c t o r i n a c c e l e r a t i n g t h e dissemination of EPC benefits and building awareness and confidence. The WOM effect is modelled as
described by Sterman (2000, p. 333) and Morecroft
(2015, pp. 169–181). From this stage forward, the
WOM effect is no longer considered significant. Audits in Progress are prospects that have signed an initial EPC contract for executing an energy audit. Interested prospects move to Audits in Progress as they become involved in an energy audit to develop an EPC project. The Adopt Audit flow rate is determined by HR effort and some attractiveness aspects that are enhanced through experience and learning.
The EPC Adopters stock represents prospects that have implemented an EPC energy efficiency project with the ESCO venture. Once the energy audit and the EPC energy project have been de-veloped, the ESCO offers the client a final EPC agreement. The prospects flow from Audit in Progress to Projects in Progress as they close an EPC and the ESCO starts implementing the energy efficiency project. The Adopt EPC flow rate is determined by HR efforts and some performance aspects that are enhanced through experience and learning. Then, the prospects become EPC Adopters as the ESCO implements the energy ef-ficiency project.
HR sector
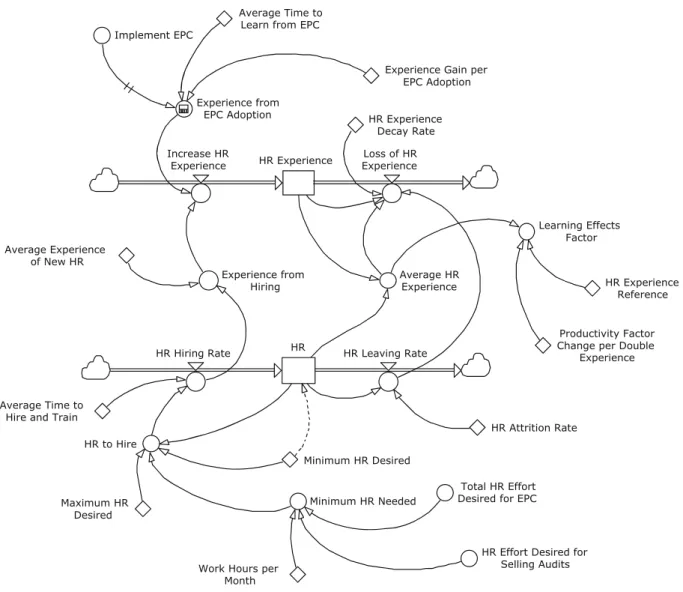
The HR sector of the simulation model (Fig. 3) is
supported by Sterman’s (2000, p. 758) structure of la-bour and hiring. The stock labelled HR consists of the number of employees in the firm. They are relevant employees (project managers) with project management responsibilities, including marketing and engineering. The HR Hiring Rate is the flow into the stock HR, and it is diminished by the HR Leaving Rate. The parameter Minimum HR Needed determines the estimation of the HR to Hire, and it is determined by the total HR effort desired for performing ESCO activities that are estimat-ed in the Operations sector of the model.
Learning effects on enhancing ESCO capabilities (marketing, selling, designing, and implementing EPC projects) are important drivers for increasing the perfor-mance of energy efficiency projects. As the venture employees are engaged in energy efficiency projects, they acquire additional experience and they enhance their abilities to develop the market. Project energy savings are improved, and EPC business processes be-come more efficient.
The HR Experience stock accumulates the job expe-rience of employees in terms of number of person-hours. It is assumed that employee experience increases for each EPC that is developed and implemented. The ex-periences of the employees are incorporated into this
model sector using Sterman’s (2000, p. 505) labour
force co-flow structure and Warren’s research (2008,
pp. 258–261). The underlying theoretical assumption is that employees learn and accumulate abilities as they are engaged in job activities. New employees bring a certain amount of experience with them, and departing employees take their experience with them. Experience increases with tenure in the job and declines as em-ployees forget relevant knowledge. This co-flow struc-ture provides the average experience of the employee, which influences the variable Learning Effects Factor that reproduces the learning curve for productivity from job experience. This variable is computed using the
equation 12–61 from Sterman’s work (2000, p. 507).
This equation assumes that productivity, starting with an initial reference amount, will increase by a certain value for every doubling of accumulated experience. This is a very important variable as it influences the effectiveness and efficiency of human resources, as well as the revenues and costs regarding the imple-mentation and exploitation of energy efficiency pro-jects. The parameter Minimum HR Desired estab-lishes the initial work force. That initial condition is critical to the success of the venture. The main task of these employees is to develop a market and feed the prospect pipeline. This work force is costly because the firm does not yet have any revenue. As such, this business venture should avoid an over-abundance of personnel, as that would drain their cash flow. However, the firm must have enough personnel who must also be sufficiently skilful to effectively sell and develop EPC projects. As clients
EPC Adopters End EPC Implement EPC Adopt Audit Projects in Progress Adopt EPC Interested EPC Term Potential Fraction of EPC Adoption Fraction of Audit Adoption
Total EPC Adopters Become Interested by
WOM
Increase in Potential Market
Not Interested Reject Audit Reject EPC
Become Informed by HR effort Become Interested Audits Offered Fraction of Interested Yearly Increase in Potential Market
Learning Effects Factor
HR Effort Assigned for Implementing EPC WOM Contact Rate
EPC Developed Audits in Progress
begin to adopt EPC, additional employees are need-ed to implement and run energy projects.
Operations, finance, and EVA sectors
The Operations sector of the model sequences and assigns business operations to employees according to specific operation management practices. The work effort desired for each activity (informing about EPC, selling audits, developing EPC, implementing EPC, and running EPC) determines the employee effort assigned for each one of the ESCO activities, which is limited by the total employee effort available. The effort desired for performing each activity is determined by the stocks EPC Adopters, Projects in Progress, Audits
in Progress, Interested, and Potential in the
mar-keting sector (Fig. 1). The work effort is assigned
according to the following priorities: first, to per-form the activities of developing, implementing, and running EPC; second, to perform the activity of selling audits; and finally, to inform potential prospects about EPC. The variables that represent the unitary work effort to perform the business activities are influenced by the variable Learning Effects Factor (learning curve for productivity
from experience) included in HR sector (Fig. 3).
The cash flow and debt of the firm are addressed in the finance sector of the model. The cash flows in from borrowing and through revenues provided by energy savings. The cash flows out to pay the investment in efficiency projects, operating expenses, debt, capital
HR e t a R g n i v a e L R H e t a R g n i r i H R H HR to Hire Average Time to
Hire and Train
HR Attrition Rate HR Experience Increase HR Experience Loss of HR Experience Minimum HR Needed
Work Hours per Month Average Experience
of New HR
Average HR Experience Experience Gain per
EPC Adoption Experience from Hiring Implement EPC Experience from EPC Adoption Average Time to Learn from EPC
Total HR Effort Desired for EPC
Learning Effects Factor
HR Experience Reference
Productivity Factor Change per Double
Experience
Minimum HR Desired
HR Effort Desired for Selling Audits Maximum HR
Desired
HR Experience Decay Rate
interests, and taxes. The funds are borrowed when the level of cash does not permit the ESCO firm to fund its activities. The cost of debt is a function that increases when the debt to equity ratio increases. The cost of debt determines the value of WACC that is utilised to com-pute the capital charge and EVA.
The EVA sector describes the process of value creation over time. Some financial parameters such as revenues, costs, capital, and value creation are computed from the accumulation and flow of re-sources in the ESCO. A stock represents the net capital employed in EPC projects. The inflow is determined by the rate of EPC implementation and the outflow represents the depreciation for the related
assets. The parameter EVA (Young and O’Byrne
2000) is computed as net operating profit less
amortisations and taxes (NOPLAT) minus Capital Charge (WACC × Capital Employed). The variable MVA (market value added) represents the present value of future EVAs and is determined by summing the discounted EVA, using weighted average cost of capital (WACC) as a discount rate. The net revenues produced by EPC projects are represented by a stock variable. The inflow of that stock is determined by the rate of EPC implementation and the learning effects factor. The outflow represents the reduction of firm revenues due to the termination of EPC term.
Model parameters
A case study of an ESCO venture was carried out during the period of 2009 to 2014. That venture (Galp Energy Solutions) was launched in 2009 by Galp, a Portuguese oil and gas company and one of the largest firms in the country. The services provided included mainly EPC-based projects to improve energy efficiency or produce renewable energy. The projects are financed with internal funds of the ESCO, and the energy savings are split in accordance with a pre-arranged percentage. Data collected from that case study were utilised to represent the reference mode, estimate the pa-rameters and initial values, and validate the behav-iour of the simulation model. For instance, the parameters that drive the flows that accumulate the stocks of clients in the adoption cycle were determined from quarterly data available in the ESCO sales reports.
Model validation
This section presents the model validation which focusses on the process of building confidence around the assertion that the developed model is suitable for the purpose; this involves structural and behavioural vali-dation tests (Sterman2000). Assessing the model struc-ture consists of verifying whether the strucstruc-ture reflects the essential descriptive knowledge of the real problem
(Sterman 2000). In order to examine how simulation
output replicates the historical behaviour of the real problem, behavioural validation tests are applied (Barlas1996).
Structure verification
As described in Section‘Stock and flow diagrams’, the main model structures are those included in the market and human resources sectors that are derived from sys-tem dynamics literature and past research. In the market sector, the series of stocks used as a client choice pipe-line has been modelled to represent clients at various stages in the adoption cycle (Miller and Sterman2007;
Warren 2008). The effect of WOM that influences the
flows included in the adoption cycle is modelled accord-ing to Sterman (2000, p. 333) and Morecroft (2015, pp. 169–181). The co-flow structure applied in the human resources sector is based on Sterman’s (2000) structure of labour and hiring (p. 758) and takes into account the
experience of the employees (Sterman 2000, p. 505;
Miller and Sterman2007; Warren2008, pp. 258–261).
Thus, it can be assumed that those model structures represent the existing knowledge of the real problem.
Behaviour tests
Behavioural validation tests were used to both calibrate the parameters and assumptions of the model and to examine how simulation outputs replicate the historical behaviour of the real problem. Empirical data gathered from an ESCO venture during the period of 2009 to 2014 (6 years) were utilised to validate the model be-haviour. For instance, the client choice pipeline structure attempts to replicate very specific aspects of the ESCO industry. Thus, special attention was paid to the deter-mination of parameters that drive the flows that accu-mulate the prospect stocks in the client adoption cycle. Those parameters were calibrated in order to minimise
the mean deviations between simulation results and observed data.
The simulation results for the stock variables Inter-ested (prospects interInter-ested in EPC), Audit in Progress, and EPC Adopters are plotted against the historical data for 6 years to offer a visual comparison. Figure4 illus-trates both the simulation results and the historical data about those stock variables. In order to test the model for its appropriate behaviour, statistical measures of corre-spondence between model simulation results and
ob-served data can be applied (Sterman2000). Thus, the
simulation results and the empirical data were further used to calculate statistical measures as those presented
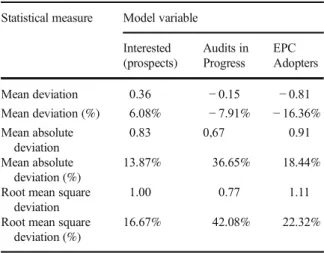
in Table 1. The results presented in Table 1 do not
suggest a perfect fit between simulation results and actual data (e.g. Audits in Progress produces a root mean square deviation of 42%). However, the main purpose of the system dynamics model is to capture the broad dynamic behaviour patterns of the real system, and not provide accurate point predictions. Figure4reveals that actual curves exhibit an oscillatory behaviour around simulated data, which, in turn, seem to smooth out historical data. Moreover, the mean absolute deviations found are lower than 1 client/prospect, and the per cent deviations are significant due to the low number of prospects flowing in at this stage of the venture. There-fore, we can conclude that the simulated data match the trend of historical data, thus providing the model with a reasonable appropriateness to reproduce the prospect chain of the venture.
Model simulation Base case
The ESCO venture launches a new energy service (EPC) into the market. There exist 600 commercial buildings that are capable of implementing EPC-based energy efficiency projects in partnership with the ESCO. The firm possesses€1 M of initial capital invested that is applied to develop the first projects. The initial work force consists of five employees performing marketing and engineering activities. They have no significant experience since they have never been involved in EPC projects. However, since the employees will be engaged in energy efficiency projects, they will enhance their abilities and become progressively more efficient.
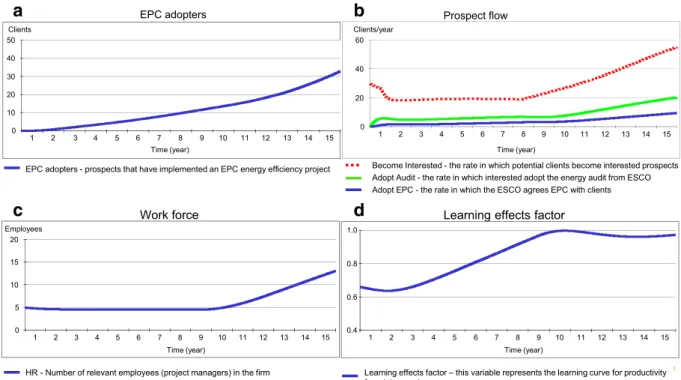
Figure 5a–h presents venture performance over the
15-year simulation period. Because of the extremely long adoption cycle, it will take a long time to accumu-late a reasonable number of EPC adopters, as it implies that potential adopters have moved up through the stages of the client choice pipeline until they become full EPC adopters. There are no full implemented pro-jects for the first 2 years. The first full EPC adopters are accomplished in the third year. The firm would run 33 projects by year 15 (Fig.5a). As presented in Fig.5c, the number of project managers maintains at approximately the minimum level (five employees) until the ninth year. As the flow in the prospect pipeline increases, the em-ployee effort required augments, and the number of project managers is regulated, achieving 13 employees by year 15. The behaviour of the variables Capital Employed, Equity, Debt, Cost of Debt, and WACC is presented in Fig.5e, f. Before the third year, the firm has no full implemented projects and yet deploys a signifi-cant portion of the initial capital (€1 M). The first projects commence to produce the energy savings and corresponding revenues in the third year. Figure 5g–h shows the economic performance over the 15-year sim-ulation period. Accumulated net earnings are negative for the first 6 years and become positive afterwards. For the first 7 years, the business operations of the venture do not add value as the EVA is negative during that period. There is no record of relevant positive EVA flow in the following 4 years. The venture only commences to produce a significant positive EVA after approximate-ly 12 years (a considerabapproximate-ly long time for investors). In the first 14 years, the firm produces a negative MVA. That means that the venture only starts adding value in the 15th year. As such, the results indicate that the simulated ESCO is economically viable in the long term. Nevertheless, as presented in Fig. 5h, the MVA (by year 15) of the venture is not relevant (€105 K).
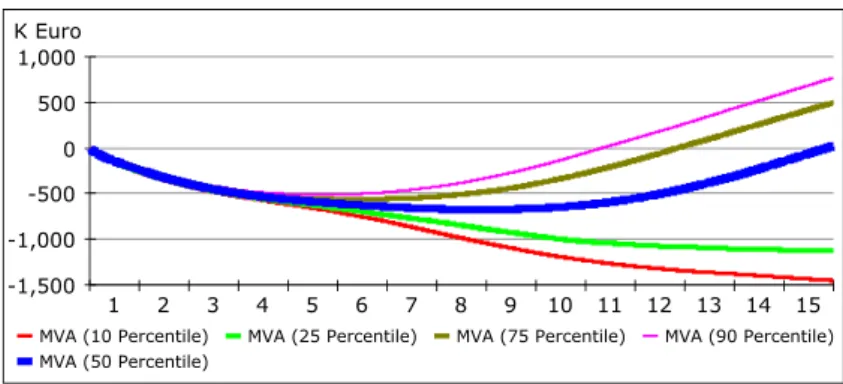
A sensitivity analysis is performed (using the Monte Carlo sampling method provided by Powersim software with 1000 iterations) with respect to the uncertainty of some crucial parameters that are determined according to a normal probability distribution. The procedure took into account the following parameters and correspond-ing standard deviations: net savcorrespond-ings per EPC and invest-ment per EPC, with 10% standard deviation, and time to inform prospects, time to adopt audit, time to develop EPC, and time to implement the project, with 25% standard deviation. This sensitivity analysis varies the values of those parameters to compute a probability
distribution for the MVA variable. Figure 6 pre-sents the range in which the MVA falls with distinct confidence levels (MVA curves of 10, 25, 50, 75, and 90 percentiles). For example, a value of 75% means that 75% of the simulation runs placed MVA below the 75 percentile curve, also meaning that 25% of the simulation runs placed MVA above the 25 percentile curve, and so on. As
presented in Fig. 6, MVA values (by year 15) are
not significant and quite sensitive to variations in the assumption parameters, which makes it more strenuous for the venture to succeed. The poor
MVA 50 percentile value (€24 K) suggests that the venture has approximately a 50% probability of success (corresponding to a positive MVA).
In summary, supposing that the assumptions consid-ered in this scenario are representative and realistic, the model outcomes indicate that an ESCO firm with ap-propriate business processes can be viable in the long term. The risk analysis of the simulation model evi-dences, however, that such a business venture would involve considerable risk as it would have an approxi-mately 50% likelihood of adding value.
Analysing the sensitivity of the ESCO performance to government policies
The simulation of the present model allows deci-sion makers to analyse the sensitivity of firm per-formance to certain government policies that may be needed to overcome the barriers to success. The model considers the effect of various policies re-lated to ESCO on the business venture, and in-cludes parameters that allow one to adjust the existence and effect of those policies. The follow-ing sections explore the dynamic effects of energy policy on an ESCO business venture. Some gov-ernment policies recommended in the literature to develop an energy services industry are selected for assessment through simulation, such as initia-tives to improve WOM, low interest rates, energy
0 10 20
0 1 2 3 4 5 6 7 8 9 10
Audits in Progress (actual) Audits in Progress (sim) EPC Adopters (actual) EPC Adopters (sim) Interested (actual) Interested (sim)
Year Clients
Fig. 4 Base case comparison of observed and simulated values
Table 1 Statistical measures of deviations between simulation results and observed data
Statistical measure Model variable Interested (prospects) Audits in Progress EPC Adopters Mean deviation 0.36 − 0.15 − 0.81 Mean deviation (%) 6.08% − 7.91% − 16.36% Mean absolute deviation 0.83 0,67 0.91 Mean absolute deviation (%) 13.87% 36.65% 18.44%
Root mean square deviation
1.00 0.77 1.11
Root mean square deviation (%)
audit subsidies, public procurement for EPC, and demonstration projects. By generating scenarios over time, the model simulates the performance impacts of those policies.
Effect of WOM initiatives
Prospects will not adopt EPC-based projects unless they are assured of their benefits, eventually from contact 1 2 3 4 5 6 7 8 9 10 11 12 13 14 15 0 500 1,000 K Euro/year 1 2 3 4 5 6 7 8 9 10 11 12 13 14 15 -1,000 -500 0 500 1,000 K Euro Work force
Capital employed Cost of capital
g n i n r a e t e n d e t a l u m u c c A A V E d n a s g n i n r a e t e N s and MVA 1 2 3 4 5 6 7 8 9 10 11 12 13 14 15 0 5 10 15 20 Employees Time (year) 1 2 3 4 5 6 7 8 9 10 11 12 13 14 15 0 10,000 20,000 K Euro 1 2 3 4 5 6 7 8 9 10 11 12 13 14 15 0 5 10 15 20 25 %/year
Learning effects factor
1 2 3 4 5 6 7 8 9 10 11 12 13 14 15 0.4 0.6 0.8 1.0 Time (year)
EPC adopters - prospects that have implemented an EPC energy efficiency project
Prospect flow 1 2 3 4 5 6 7 8 9 10 11 12 13 14 15 0 10 20 30 40 50 Clients Time (year) 1 2 3 4 5 6 7 8 9 10 11 12 13 14 15 0 20 40 60 Clients/year Time (year)
Time (year) Time (year)
Time (year) Time (year)
EPC adopters
Become Interested - the rate in which potential clients become interested prospects Adopt Audit - the rate in which interested adopt the energy audit from ESCO Adopt EPC - the rate in which the ESCO agrees EPC with clients
HR - Number of relevant employees (project managers) in the firm Learning effects factor – this variable represents the learning curve for productivity from job experience
Capital employed - ESCO total capital employed Equity - the amount of ESCO equity Debt - the amount of ESCO debt
WACC - weighted average cost of capital
Cost of equity - rate of return required by equity holders Cost of debt - interest rate on debt
Net earnings - yearly net earnings of the ESCO EVA - yearly economic value added of the ESCO
Accumulated net earnings of the ESCO MVA – market value added of the ESCO
a
b
c
d
e
f
g
h
with existing adopters. Adversely, it will take a consid-erably long time to accumulate adopters to diffuse the advantages of EPC projects, as it obliges prospects to have advanced up through stages of the client choice pipeline until they become full EPC adopters. At that phase, to accelerate the business profitability, it is crucial to benefit from the WOM potential.
This scenario assumes that a set of government and ESCO initiatives would induce the WOM mechanism by fostering special events such as workshops and seminars to evidence and dissemi-nate information on the experience regarding suc-cessful energy efficiency projects in order to make potential prospects aware of EPC and its benefits. In the base case, the WOM contact rate is as-sumed to be three prospects per adopter per year.
Figure 7a–e illustrates the behaviour of the
simu-lation model as the contact rate parameter is in-creased by up to nine prospects per adopter per
year. Comparing Figs. 5b and 7b, we can observe
that the prospect flow rates augment significantly, particularly from year 4 to year 9.
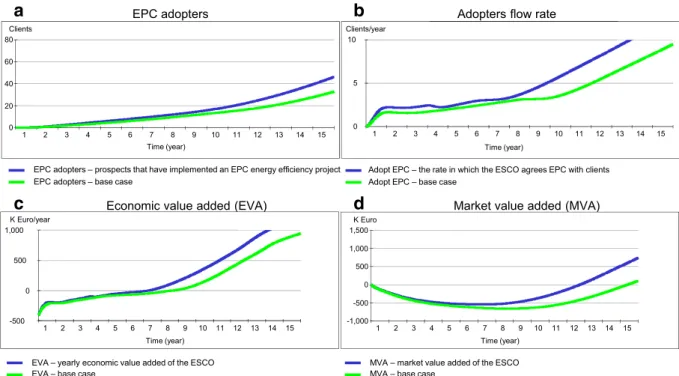
By year 15, the firm will have accumulated approx-imately 80 projects (Fig.7a). As presented in Fig.7c, the number of employees hovers around the minimum ca-pacity (five project managers) until the fourth year. Then, reacting to the augmenting number of clients, the work force is increased by up to 23 employees. Figure7d, e illustrates the firm’s economic performance. For the first 4 years, the variable EVA is negative, after which point the venture commences to produce positive EVA resulting in a reasonable final MVA (€1.2 M); this means that in this case the venture will be economically viable because it will add value in the long term. These outcomes suggest that the simulation model is sensitive to variations in the WOM contact rate assumption. Therefore, effective policies should include initiatives
that could accelerate and take advantage of WOM com-munication among potential prospects and EPC adopters.
Effect of interest rate on debt
As mentioned in the literature review, it is assumed that financial incentives could play an important role in this business venture. A common type of financial incentive policy is to subsidise the interest rate on debt. The result of this policy is to lower the financial cost of the ESCO, enabling higher profits without affecting the costs and attractiveness to the client firms. By benefiting from this incentive, the ESCO avoids the very high interest rates on debt due to the financial stress (high debt to equity ratio) incurred in the base case from year 5 to year 12 (as displayed in Fig.6f).
Effect of energy audit subsidy
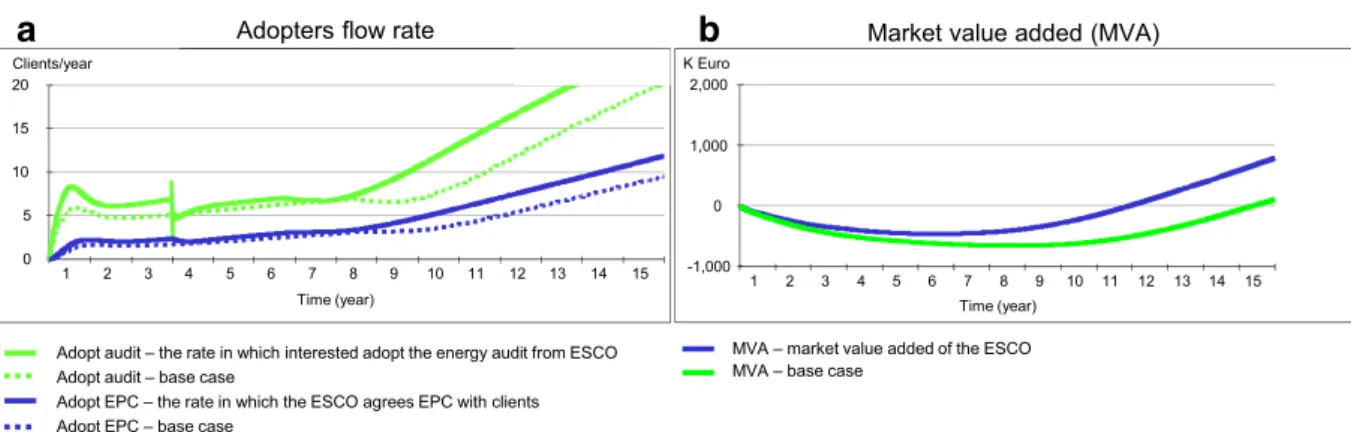
Another common type of policy is to subsidise a portion of the energy audit costs (Bertoldi et al. 2014). The expected result of this policy is to stimulate energy audits to be used as the basis for EPC projects by lowering the upfront costs to the client. It is assumed that a subsidy programme would increase the fraction of
energy audit adoption from 20 to 50%. Figure 8a, b
presents some simulation results for a case that con-siders an impact factor of 1.5 (for a 3-year programme). Effect of public procurement programme
The promotion of public tenders for implementing EPC projects in public buildings could be a supportive policy measure. In this initiative, government energy authori-ties select certain public buildings for EPC project im-plementation in partnership with ESCOs. A stock
1 2 3 4 5 6 7 8 9 10 11 12 13 14 15 -1,500 -1,000 -500 0 500 1,000 K Euro
MVA (10 Percentile) MVA (25 Percentile) MVA (75 Percentile) MVA (90 Percentile) MVA (50 Percentile)
Fig. 6 Base case: MVA sensitivity analysis
representing those buildings is defined to accommodate that policy measure in the model structure. These build-ings will be submitted to energy audits, project
development, and EPC agreements. In the present study, a 3-year programme for improving energy efficiency in public buildings is simulated in which ESCOs are called
1 2 3 4 5 6 7 8 9 10 11 12 13 14 15 -500 -250 0 250 500 K Euro/year Time (year)
Adopters flow rate EPC adopters
Work force Economic value added (EVA)
Market value added (MVA)
1 2 3 4 5 6 7 8 9 10 11 12 13 14 15 0 25 50 75 100 Clients 1 2 3 4 5 6 7 8 9 10 11 12 13 14 15 0 5 10 15 20 Clients/year 1 2 3 4 5 6 7 8 9 10 11 12 13 14 15 0 10 20 30 Employees 1 2 3 4 5 6 7 8 9 10 11 12 13 14 15 -1,000 0 1,000 2,000 K Euro Time (year)
Time (year) Time (year)
Time (year)
EPC adopters – prospects that have implemented an EPC energy efficiency project EPC adopters – base case
Adopt EPC – the rate in which the ESCO agrees EPC with clients Adopt EPC – base case
HR – Number of relevant employees (project managers) in the firm HR – base case
EVA – yearly economic value added of the ESCO EVA – base case
MVA – market value added of the ESCO MVA – base case
a
c
b
e
d
Fig. 7 a–e Improved WOM case: performance over 15 years
Adopters flow rate Market value added (MVA)
1 2 3 4 5 6 7 8 9 10 11 12 13 14 15 -1,000 0 1,000 2,000 K Euro Time (year) 1 2 3 4 5 6 7 8 9 10 11 12 13 14 15 0 5 10 15 20 Clients/year Time (year)
Adopt audit – the rate in which interested adopt the energy audit from ESCO Adopt audit – base case
Adopt EPC – the rate in which the ESCO agrees EPC with clients Adopt EPC – base case
MVA – market value added of the ESCO MVA – base case
a
b
on to propose their energy audit and EPC offers. It is assumed that a certain number of public projects will be available to the startup firm.
Figure 9a–d presents some simulation results for a scenario which considers a calling rate of three buildings per year (for the 3-year program). As shown, this type of policy measure could be very beneficial for an ESCO startup.
Effect of demonstration projects programme
A demonstration programme is another policy measure that could be applied by government authorities to pro-mote ESCOs, particularly in countries where there is a lack of experience and awareness concerning energy services and projects on an EPC basis. In a demonstra-tion programme, ESCOs are called to develop and im-plement EPC-based projects. Energy authorities select a set of private and public buildings that are suitable to serve as pilot and demonstration projects to display the benefits of energy efficiency projects based on EPC. Those buildings have had energy audits and are capable (legally, economically and technically) of adopting EPC. By engaging in this type of programme, the startup firm has the opportunity to accelerate learning on EPC processes. On the other hand, the results of these
learning processes will be disseminated to improve knowledge, awareness, and trust surrounding EPC and ESCOs. The model development considers a stock var-iable representing those demonstration projects to per-mit the evaluation of that policy measure.
The present study explores a 3-year demonstration programme. It is assumed that a certain number of dem-onstration projects will be available to the startup firm. Figure10a–e presents some simulation results consider-ing a callconsider-ing rate of three demonstration projects per year (for the 3-year programme). Figure 10e in particular shows the acceleration of the learning processes as the associated effect occurs approximately 3 years before the base case. These results suggest that this type of policy measure can be very effective as it contributes expressly to the success of that business venture.
Effect of combining policies
As revealed by the base case simulation results, an ESCO venture with proper management processes can succeed without government policies in place. The sen-sitivity analysis of the model shows, however, that such a business venture would have approximately 50% chance of doing so. As each one of the above fostering policies is implemented in the simulation model, the
EPC adopters 1 2 3 4 5 6 7 8 9 10 11 12 13 14 15 0 20 40 60 80 Clients
Adopters flow rate
1 2 3 4 5 6 7 8 9 10 11 12 13 14 15 0 5 10 Clients/year Time (year) Time (year) M ( d e d d a e u l a v t e k r a M ) A V E ( d e d d a e u l a v c i m o n o c E VA) 1 2 3 4 5 6 7 8 9 10 11 12 13 14 15 -1,000 -500 0 500 1,000 1,500 K Euro Time (year) 1 2 3 4 5 6 7 8 9 10 11 12 13 14 15 -500 0 500 1,000 K Euro/year Time (year)
EVA – yearly economic value added of the ESCO EVA – base case
MVA – market value added of the ESCO MVA – base case
Adopt EPC – the rate in which the ESCO agrees EPC with clients Adopt EPC – base case
EPC adopters – prospects that have implemented an EPC energy efficiency project EPC adopters – base case
a
b
c
d
firm does significantly better than the base case. Thus, supportive government policies would provide the ven-ture a much higher chance of succeeding and achieving wide adoption of EPC. This section analyses and ex-plores the effect of combining the following government policies as described in previous sections:
A. Improved WOM contact rates: it is assumed that the WOM contact rate parameter would be im-proved from 3 to 6 prospects/adopter/year. B. Financial incentives: this scenario assumes that the
ESCO will benefit from a 2.5%/year interest rate on debt for the first 10 years.
C. Audit subsidies: a 3-year subsidy programme is assumed, during which the fraction of energy audit adoption would increase by 30%.
D. Public EPC projects: it is assumed that on average, two public projects per year would be available to the startup firm for the 3-year programme. E. Demonstration projects: this scenario assumes that
on average, two demonstration projects per year would be available to the startup firm for the 3-year programme.
Table 2 presents a comparison of these five policy
measures in terms of MVA to the startup firm. As shown, implementing of any of the policies results in significantly better economic performance than in the base case. The simulated ESCO produces nearly €0.54 M (audit subsidy policy) to €1.658 M (demon-stration projects policy) of MVA by year 15. Overall, the firm produces a positive EVA sooner in the presence of
Economic value added (EVA) Market value added (MVA)
Learning effects factor
1 2 3 4 5 6 7 8 9 10 11 12 13 14 15 -500 0 500 1,000 1,500 K Euro/year Time (year) 1 2 3 4 5 6 7 8 9 10 11 12 13 14 15 -1,000 0 1,000 2,000 3,000 K Euro Time (year) 1 2 3 4 5 6 7 8 9 10 11 12 13 14 15 0.4 0.6 0.8 1.0 Time (year)
Adopters flow rate
1 2 3 4 5 6 7 8 9 10 11 12 13 14 15 0 5 11 15 Clients/year Time (year)
Adopt EPC – the rate in which the ESCO agrees EPC with clients Adopt EPC – base case
EPC adopters 1 2 3 4 5 6 7 8 9 10 11 12 13 14 15 0 20 40 60 80 Clients Time (year)
EPC adopters – prospects that have implemented an EPC energy efficiency project EPC adopters – base case
EVA – yearly economic value added of the ESCO EVA – base case
MVA – market value added of the ESCO MVA – base case
Learning effects factor – this variable represents the learning curve for productivity from job experience
Learning effects factor – base case
a
b
c
d
e
those favourable policies. Most importantly, the ven-ture’s probability of failure has been reduced substan-tially. The MVA figures from risk analysis (5, 10, 25, 50, 75, 90, and 95% percentiles) indicate that those govern-ment measures enable the reduction of the likelihood of negative MVA. Unsurprisingly, the interest rate reduc-tion policy produced the better improvement of the simulated firm in terms of risk exposure.
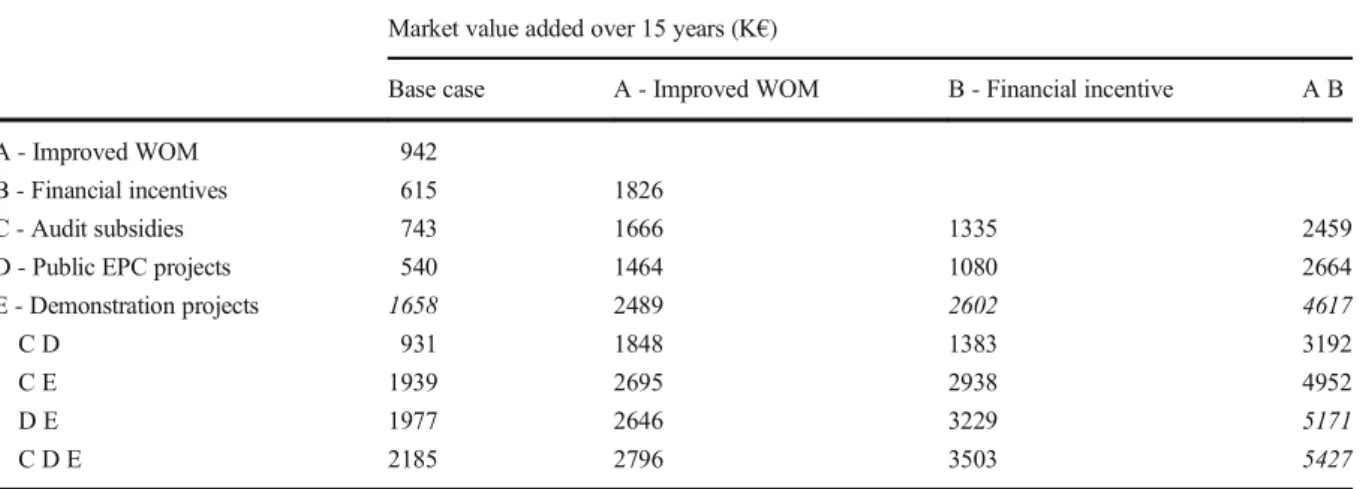
Table 3 shows how the possible combinations of
government policies impact the expected market value of the simulated firm. As shown, the maximum perfor-mance is achieved by combining all five policy
mea-sures (A, B, C, D, and E), producing€5.427 M of MVA
by year 15. If just four measures are to be selected, the greatest performance impact comes from the A, B, D, and E policies (€5.171 M of MVA by year 15, corre-sponding to 95% of maximum MVA). Then, in terms of the three measure combination, the A, B, and E policies provide the best performance (€4.617 M of MVA by year 15, corresponding to 85% of maximum MVA). Concerning the implementation of two policies, the greatest MVA is obtained by combining B and E
(€2.602 M of MVA by year 15, corresponding to 48%
of maximum MVA). Table4presents the impact of the
most efficient combinations of policy measures on the ESCO performanc e. As shown, the g reatest
Table 2 Effect of incentive policies on the ESCO performance over 15 years Market value added (k€) Risk analysis MVA (5 perc) MVA (10 perc) MVA (25 perc) MVA (50 perc) MVA (75 perc) MVA (90 perc) MVA (95 perc) Likelihood of negative MVA (%) Base case 105 − 1622 − 1454 − 1120 24 500 774 900 49% A - Improved WOM contact rates 942 − 2036 − 1725 − 694 823 1365 1835 2051 36% B - Financial incentives 615 − 152 66 360 572 795 988 1089 8% C - Audit subsidies 743 − 1605 − 1409 − 882 488 859 1145 1287 41% D - Public EPC projects 540 − 1686 − 1495 − 1056 465 963 1277 1428 42% E - Demonstration projects 1658 − 2050 − 1715 − 256 1543 2099 2541 2776 29%
Risk analysis: MVA (over 15 years) sensitivity analysis (Monte Carlo sampling method with 1000 iterations) with regards to the variation of the following assumptions (normal distribution with 10% standard deviation): Net Savings per EPC (normal distribution with 10% standard deviation); Investment per EPC (normal distribution with 10% standard deviation); Time to Inform Prospects (normal distribution with 25% standard deviation); Time to Adopt Audit (normal distribution with 25% standard deviation); Time to Develop EPC (normal distribution with 25% standard deviation); Time to Implement Project (normal distribution with 25% standard deviation)
Table 3 Effect of combined policies on the ESCO performance (MVA over 15 years) Market value added over 15 years (K€)
Base case A - Improved WOM B - Financial incentive A B
A - Improved WOM 942
B - Financial incentives 615 1826
C - Audit subsidies 743 1666 1335 2459
D - Public EPC projects 540 1464 1080 2664
E - Demonstration projects 1658 2489 2602 4617
C D 931 1848 1383 3192
C E 1939 2695 2938 4952
D E 1977 2646 3229 5171
C D E 2185 2796 3503 5427
performance impact is generated by combining the A -improved WOM measure with the E - demonstration projects initiative.
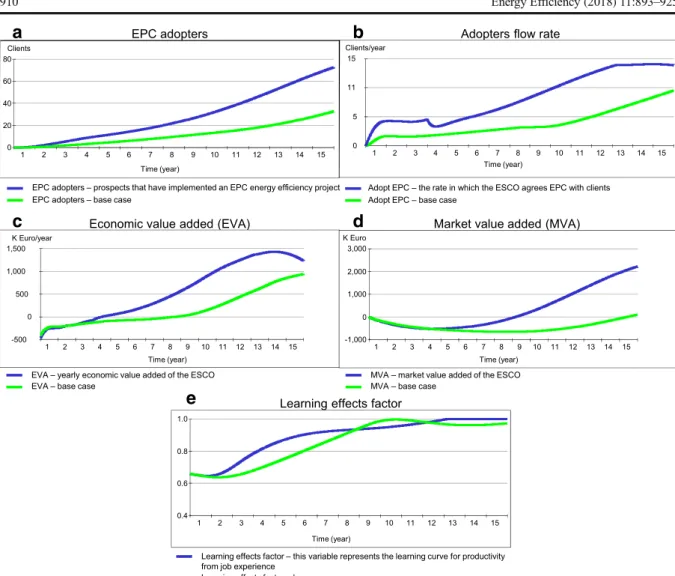
By interpreting the data from Table4using a Pareto analysis, it is interesting to observe that a combination of the three measures A, B, and E produces 85% of max-imum performance (corresponding to the five measure combination). Table5and Fig.11a–f illustrate the firm performance over the 15-year duration of the simulation mode under those three policies. The differences be-tween this A-B-E scenario and the base case are imme-diately identifiable. There is a clear acceleration of the EPC adopters’ accumulation process, as seen from the behaviour of the prospects flow rate and stock presented in Fig.11a, b. There are expected to be approximately 88 EPC-based projects implemented by year 15
(Fig. 11b), in comparison to 33 adopters occurring
in the base case. The number of relevant employees increases to up to 23 in the tenth year, whereas in the base case it stays steady around the minimum
capacity until the ninth year (Fig. 11c). Equity
re-mains lower than debt until approximately the elev-enth year, at which point cash flow from EPC starts to exceed capital expenditures in new projects, which
enables debt repayment (Fig. 11d). Figure 11e, f
compares the economic performance of the simulated firm ESCO to the A-B-E and base case scenarios. In the base case scenario, the EVA is negative for 7 years, there is no record of significant EVA after 9 years, and the firm begins to develop a reasonable positive EVA flow after only approximately 12 years of simulation time. In the A-B-E scenario, on the other hand, with those government policy measures in place, the investment has strong positive returns (EVA) after 3 years, almost 9 years earlier than the
base case (Fig. 11e). With respect to MVA, Fig. 11f
shows that the combination of the policies also displays a more favourable behaviour as MVA be-comes positive in the fifth year, 10 years earlier than
the base case. Figure 12 presents the results of a
sensitivity analysis for the A-B-E scenario regarding the uncertainty of some critical assumptions, which is compared to the similar analysis performed for the
base case and presented in Fig. 6. As can be
ob-served in Fig. 12, although MVA values (by year 15)
are also very sensitive to changes in the considered assumptions, the probability of failure (corresponding to negative MVA) seems to be quite low, which indicates that starting an ESCO venture under these conditions will have a greater chance of success.
Table 4 Effect of the most efficient combinations of policy measures on the ESCO performance (MVA)
Simulation time (years) Base case E B-E A-B-E A-B-D-E A-B-C-D-E
3 years MVA (k€) − 494 − 475 − 383 − 350 − 327 − 263
5 years MVA (k€) − 601 − 496 − 202 − 60 42 149
10 years MVA (k€) − 588 217 1100 2247 2766 3105
15 years MVA (k€) 105 1658 2602 4617 5171 5427
%/ABCDE 15 years MVA 2% 31% 48% 85% 95% 100%
A - Improved WOM contact rates = 6 prospects/adopter/year. B - Financial incentives - 2.5%/year interest rate on debt for the first 10 years. C - Audit subsidies - 30% increase in fraction of audit adoption for a 3-year subsidy program. D - Public EPC projects - 2/year calling rate for a 3-year programme. E - Demonstration projects - 2/year calling rate for a 3-year programme
Table 5 A-B-E initiatives case: performance over 15 years Simulation time
(years)
Work force (project managers)
Learning effects
factor (0–1) Interestedprospects
EPC adopters
Accumulated net
earnings (k€) Market valueadded (k€)
1 5 0.64 7 0 − 89 − 216
3 6 0.75 25 6 20 − 350
5 11 0.80 45 13 881 − 60
10 23 0.93 55 50 9177 2247
Conclusion
The development of a competitive and sustainable mar-ket for EPC projects supplied by ESCOs is considered to
be a necessary way to improve energy efficiency. How-ever, against the initial expectations in Portugal, similar to other small European markets, only a few firms are engaged in EPC ventures, and many of those firms
Prospects flow rate EPC adopters
Capital employed Work force
Economic value added (EVA) Market value added(MVA)
1 2 3 4 5 6 7 8 9 10 11 12 13 14 15 0 5 10 15 20 Clients/year 1 2 3 4 5 6 7 8 9 10 11 12 13 14 15 0 25 50 75 100 Clients 1 2 3 4 5 6 7 8 9 10 11 12 13 14 15 0 10 20 30 Employees 1 2 3 4 5 6 7 8 9 10 11 12 13 14 15 0 10,000 20,000 30,000 40,000 50,000 K Euro 1 2 3 4 5 6 7 8 9 10 11 12 13 14 15 -500 0 500 1,000 1,500 2,000 K Euro/year Time (year) 1 2 3 4 5 6 7 8 9 10 11 12 13 14 15 -1,000 0 1,000 2,000 3,000 4,000 5,000 K Euro Time (year) Time (year) Time (year) Time (year) Time (year)
Adopt EPC – the rate in which the ESCO agrees EPC with clients Adopt EPC – base case
EPC adopters – prospects that have implemented an EPC energy efficiency project EPC adopters – base case
HR – Number of relevant employees (project managers) in the firm HR – base case
Capital employed – ESCO total capital employed Equity – the amount of ESCO equity Debt – the amount of ESCO debt
EVA – yearly economic value added of the ESCO EVA – base case
MVA – market value added of the ESCO MVA – base case
a
b
c
d
e
f
Fig. 11 a–f A-B-E initiatives case: performance over 15 years
1 2 3 4 5 6 7 8 9 10 11 12 13 14 15 0
3,000 6,000 K Euro
MVA (10 Percentile) MVA (25 Percentile) MVA (75 Percentile) MVA (90 Percentile) MVA (50 Percentile)
Time
Fig. 12 A-B-E initiatives case: MVA sensitivity analysis