ISSN 1517-7076 artigo e-12162, 2018
Autor Responsável: Raphaele Malheiro Data de envio: 13/05/2017 Data de aceite: 06/02/2018
10.1590/S1517-707620180003.0496
Behaviour of cementitious matrices
subjected to the combined action
of chloride ions and carbonation
Raphaele Malheiro 1, Aires Camões 1, Gibson Meira 2, Maria Teresa Amorim 3, João Castro-Gomes 4, Rui Miguel Ferreira 5
1 CTAC, Departament of Civil Engineering, University of Minho, Campus de Azurém, Guimarães, Portugal.
e-mail: [email protected]; [email protected]
2 Federal Institute of Education, Science and Technology of Paraíba, R. Dep. Balduíno M. de Carvalho, 155/1104,
58.036-860 João Pessoa, Paraíba, PB, Brazil. e-mail: [email protected]
3 Centre for Textile Science and Technology, University of Minho, Campus de Azurém, Guimarães, Portugal.
e-mail: [email protected]
4 C-MADE, Department of Civil Engineering and Architecture, University of Beira Interior, 6201-001 Covilhã, Portugal.
e-mail: [email protected]
5 VTT, Technical Research Centre of Finland Ltd., Espoo, Finland.
e-mail: [email protected]
ABSTRACT
Carbonation and chloride action are the two leading causes of degradation in reinforced concrete structures. Despite the combined action of these two mechanisms being a reality, there is little research on the effect of this combination in cementitious matrices. Furthermore, the incorporation of fly ash in cementitious matrices has been frequently used in order to make the matrix more resistant to the action of chlorides. On the other hand, it is known that Ca(OH)2 existing in the matrix is consumed by the pozzolanic reactions, which makes easier the carbonation front advance. Therefore, this paper presents a study of the behavior of cementitious matrices, with and without fly ash, subjected to the combined action of chlorides and carbonation. Two dif-ferent kinds of mortars were produced: reference (only cement CEM I 42.5R) and fly ash mortar (40% re-placement of cement). After curing, the specimens were subjected to three different wetting-drying cycles, considering NaCl solutions and CO2 atmospheres. Afterwards, chloride profiles and carbonation front were measured. Results show that carbonation has a direct influence on chloride penetration, decreasing it for ce-ment mortars with 0% fly ash and increasing it for mortars with 40% cece-ment replacece-ment by fly ash. Moreo-ver, the evolution of carbonation is also influenced by chloride presence, which decreases under the com-bined action.
Keywords: Chloride; Carbonation; Mortar; Fly ash; Wetting-drying cycles.
1. INTRODUCTION
A significant number of concrete structures around the world have deteriorated prematurely [1]. In the USA, for example, about 9.1% of the nation’s bridges were classified as structurally deficient in 2016. The most recent estimate puts the nation’s backlog of bridge rehabilitation needs at $123 billion [2]. Usually rein-forcement corrosion is the main cause of the reduction of service life of concrete structures. In most cases, corrosion in concrete structures is a direct consequence of the action of chlorides and carbonation [3].
Standards, in general, show instructions for designing structures to have appropriate performance against the deterioration mechanisms individually [4,5]. Even though the deterioration of concrete structures in real environments is a consequence of a combination of deterioration phenomenon, most previous studies focused on a single cause for this issue [6,7]. For instance, structures exposed to marine environments or de-icing salts are also exposed to action of carbonation [8].
The study of combined phenomena for starting reinforcement corrosion has become more expressive in the recent years. It is possible to mention few examples in this direction, like those studies carried out by COSTA and APPLETON [9], ZIVICA [10], CHINDAPRASIRT et al. [3], CHENGFANG et al. [11], LEE et al. [6], MALHEIRO et al. [12] and RAMEZANIANPOUR et al. [13]. These studies have not been able to
materials. According CHINDAPRASIRT et al. [3], for instance, the exposure to CO2 environment does not
increase the chloride ingress for mortar made with Ordinary Portland Cement (OPC). In the opposite way, CHENGFANG et al. [11] say that, for OPC concrete, the chloride diffusion coefficient increases as a result
of concrete carbonation.
Diffusion is one of the main mechanisms governing chloride penetration into saturated concrete [14]. In concretes subjected to immersion and drying cycles, the capillary absorption play a important role too. Considering that the carbonation changes the concrete microstructure and its pH [1], it may directly influence the chloride penetration into concrete through diffusion or capillary absorption. The transformation of Ca(OH)2 and others hydrates into carbonates, decreases the porosity of concrete [15, 16, 17] and, consequent-ly, the amount of penetrated chlorides. Equations (1) to (4) represent, in a simplified way, the main carbona-tion reaccarbona-tions [18]. According to JOHANNESSON and UTGENANNT [17], a well carbonated OPC mortar can have up to two times more small pores than the same non carbonated mortar.
2 3 22
O
CO
2
H
CO
H
(1)
CO
HCO
H
O
H
2 2 3 (2)
H
CO
HCO
3 32 (3)O
H
CaCO
CO
H
OH
Ca
(
)
2
2
32
3
2
2 (4)The pH changes of the pore solution are due to interaction of carbon dioxide with the cement hydrates. This aspect may directly influence the chloride diffusion into concrete because the pH decrease caused by carbonation [17] can contribute towards releasing chemically fixed chlorides and increasing free chlorides content, which may actively ingress into concrete [19]. One possible source of chloride ions within concrete are in Friedel´s salt form (3CaO.Al2O3.CaCl2.10H2O). This salt is a result of the combination of chlorides and tricalcium aluminate and, in this context, plays a significant role due to their ability to fix chlorides [20]. However, studies point to an increase of the solubility of the Friedel´s salt when increasing the degree of car-bonation [21] because its stability is related to the pH of the pore solution [20, 21]. As a result, two phenom-ena that play roles in opposite ways take place when carbonating cementitious material: porosity reduction and chloride release. Thus, the prevalence of one effect over the other may result in different consequences to chloride transport into cement-based materials.
Taking into account the combination of carbonation and chloride transport into cementitious matrices, JUNG et al. [22] used immersion and drying cycles to study the effect of CO2 presence on chloride ingress.
The specimens were immersed in sodium chloride solution (5% NaCl solution, 25ºC), during 1 week, and dried in CO2 presence (10% CO2, 40ºC), during 1 week, for a period up to 56 weeks. After analysing the chloride profiles, the authors concluded that the chloride ingress is more evident for the combined action than for the case of single chloride action. In the same way, CHENGFANG et al. [11] placed OPC concrete
spec-imens to carbonation chamber (20% CO2, 20ºC and 70% RH) for 14 and 28 days and after to immersion in 5% NaCl solution and drying in laboratory environment cycles to study the impact of CO2 presence on chlo-ride ingress. They concluded that the chlochlo-ride diffusivity coefficient increases with the carbonation time. NIU and SUN [23] also investigated the effect of CO2 presence on chloride penetration into concrete by cycles of wetting in salinity solution and drying in CO2 environment, and showed that carbonation increases the rate of chloride ingress into material.
As opposite to this, IHEKWABA et al. [18] submitted concrete specimens to carbonation for 6
months and, after this, the specimens were subjected to ponding tests with saturated NaCl solution for 18 months in order to study the influence of carbonation on the electrochemical extraction of chlorides. They concluded that the diffusion of chlorides is delayed by carbonation. According to these researchers, chemical alterations caused by carbonation, namely the decreasing in pH, can hamper the speed of chloride ingress, as well as improving the chemical reactions related to with chloride ion binding by cement. CHINDARPRASIT
et al. [3] submitted OPC mortars specimens to carbonation chamber (5% CO2, 23ºC and 50% RH) for 28
days and after that the specimens were tested through rapid chloride penetration test, modified rapid migra-tion test and chloride immersion test (3% NaCl solumigra-tion). They concluded that the exposure to CO2 environ-ment has no influence in the chloride ingress of samples studied.
pre-sent in FA reacts with Ca(OH)2 resulting from cement hydration and produces C-S-H structures that strongly decrease the concrete porosity and hence reduces the transport of aggressive agents such as chloride ions. In addition, the aluminates present in FA chemically react with free chlorides binding them and reducing the amount of free chlorides able to penetrate into concrete [24]. Furthermore, in the presence of FA, less Ca(OH)2 is formed, resulting in a decrease of the concrete pH. Since less Ca(OH)2 is present, the amount of CaCO3 produced during carbonation also decreases, facilitating the progress of the carbonation [25].
LEIVO et al. [26] studied the combined action of chloride transport and carbonation of concrete with
FA (24% of the binding material). Aiming to study the influence of carbonation on chloride penetration, the specimens were first carbonated for 56 days and after that were submitted to migration tests. The results show that chlorides have penetrated deeply through the carbonated areas than through the non carbonated areas.
Concerning the effect of the chloride penetration on concrete carbonation, very few investigations were carried out. In order to study the influence of chloride penetration on carbonation, LEIVO et al. [26]
carried out migration tests in samples, which were then placed in a carbonation environment, 4% CO2, for 56 days. The ensuing conclusions indicated that the carbonation of samples previously exposed to chlorides cor-responded to only 54% of the carbonation of samples with no chloride exposure. As stated in these studies, this behaviour can be a consequence of the higher concrete humidity content and water film thickness inside the pores as a result of the hygroscopic nature of salt, ultimately reducing the carbonation progress.
Although there are some studies about combined action, the lack of standardization about the various parameters involved in the tests such as its setup, temperature, humidity and concentration of NaCl and CO2 makes difficult the comparison of compare results.
In order to contribute to this important and ongoing discussion, this experimental work focuses on the influence of carbonation on chloride penetration into cementitious matrices, with and without FA, by acceler-ated cyclic tests. The influence of chloride penetration on carbonacceler-ated specimens is also evaluacceler-ated.
2. EXPERIMENTAL WORK
2.1 Materials and specimens preparation
Mortar specimens were used in this study. For a better results' clarity mortars were chosen instead of concrete because mortar is more porous than concrete and, consequently, the mortar enables faster chloride and CO2 penetration front.
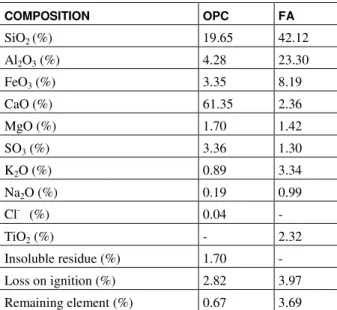
Ordinary Portland Cement (OPC) and Fly Ash (FA) were used as binder materials, which chemical compositions are presented in Table 1. Scanning Electron Microscopy (SEM) was used to observe FA mor-phology (Figure 1), revealing that it is mainly composed by cenosphere particles (REIS et al. [27]).
Table 1: Chemical composition of Ordinary Portland Cement and Fly Ash.
COMPOSITION OPC FA
SiO2 (%) 19.65 42.12
Al2O3 (%) 4.28 23.30
FeO3 (%) 3.35 8.19
CaO (%) 61.35 2.36
MgO (%) 1.70 1.42
SO3 (%) 3.36 1.30
K2O (%) 0.89 3.34
Na2O (%) 0.19 0.99
Cl- (%) 0.04 -
TiO2 (%) - 2.32
Insoluble residue (%) 1.70 -
Loss on ignition (%) 2.82 3.97
Figure 1: SEM fly ash images 100m (x300) (a) 30m (x1500) (b) (REIS et al. [27]).
Quartz river sand with a 2.77 fineness modulus and a maximum particle size of 4 mm was used as fine aggregate. The mortar compositions and their main characteristics regarding fresh and hardened states are shown in Table 2. Two mortar mixtures were used in this study, produced with OPC, CEM I 42.5R, and class F FA, from a thermoelectric power plant in Portugal, as a cement replacement of 40% by mass. The mortar water content was set to maintain a similar flow value. No chemical admixtures were adopted.
Cubic mortar samples with 50 x 50 x 50 mm3 were moulded, and the associated mix compositions are shown in Table 2.
Table 2: Mix-design and main properties of mortar.
MATERIAL AND PROPERTIES OPC MORTAR
(0% FA)
40% FA MORTAR
Mortar mixture (binder: sand: water)
1:3: 0.56 1:3:0.52
Flow spread (mm) 190 ±20 190 ±20
Compressive strength (MPa) –
28/ 90 days
37.6 3.9/ 39.1 2.2
23.6 0.1/ 44.60 0.16
Afterwards, plastic sheet was wrapped around the samples, preventing the evaporation of water, fol-lowed by their placement in a humid environment (21 ºC and 98% RH) for one day. Then, they were demoulded and cured while immersed in water for 90 days. The latter period was adopted so as to allow enough time for pozzolanic reactions to occur in samples with FA.
2.2 Testing program
Finishing the curing period, the specimens needed to be prepared to the tests. They were painted with an epoxy resin. After some preliminary tests the more appropriate method for painting was determined: first, the specimens were kept in an oven at 40°C for 1 day to remove the excess water (this amount of water was not measured). Then, the samples had five faces painted with an epoxy resin in three layers, this took 3 days. The only free face was used to allow a unidirectional flux during the immersion period. The first epoxy resin layer worked as a basis. The second one was used to effectively cover the pores and the third and last one was used to fill those pores that were not fully covered with the resin. Twenty-four hours was the break time between the painting layers and, after the last layer, the specimens remained in laboratory environment (18.5ºC and 58%RH) for more 4 days in order to allow the drying of the epoxy resin. After this period, the specimens were ready to be tested.
With the purpose of reproducing the combined action of chloride ions and carbonation, the mortars were submitted to three kinds of 14-day aggressive cycles. All samples were tested until 56 (4 cycles) and 168 days (12 cycles). Before starting the cycles, the mortars were immersed in water until reaching a constant mass. In the first aggressive cycle (Cycle A (Cl-/CO2)), the samples were submerged for 2 days in 3.5% NaCl
solution, which is similar to the Atlantic Ocean salinity [28], before being in a carbonation chamber (20ºC, 55% RH and 4% CO2) for 12 days. This complies with the recommendations of the draft technical specifica-tion CEN/TS 12390-12 [29]. In the second aggressive cycle (cycle B (Cl-/O2)), which is the reference cycle for studying the influence of carbonation on chloride penetration, the samples were kept 2 days in 3.5% NaCl solution and then stored for 12 days in laboratory environment (18.5ºC, 58% RH and 0.04% CO2). Finally, in the last aggressive cycle (cycle C (H2O/CO2)), corresponding to the reference cycle for studying the influence of chloride ingress on concrete carbonation, the samples were immersed for 2 days in H2O, followed by their placement in a carbonation chamber (20ºC, 55% RH and 4% CO2) for 12 days. When the exposure period was over, the penetration of chlorides and the carbonation front were evaluated.
Chloride profiles were obtained to assess the chloride penetration into cement mortar. The specimens were continuously ground into powder in successive 5mm thickness layers from the surface until a depth of 30mm [30], which means 6 layers for each specimen. After this extraction, total chloride content in each powered sample was measured by chemical analysis using the Volhard´s method [31]. This analysis gave a chloride profile, from which the apparent diffusion coefficient, Dap (m2/s), and the surface chloride content, CS (%), were obtained by fitting the error-function solution of Fick’s 2nd law (Equation 5) to the experimental data. In the Equation 5, CX is the chloride content (%) measured at a depth x (m) for a time of immersion t (s), Cs is the chloride content at the concrete surface (%) after a time of immersion t (s), C0 is the initial chloride content in material (%) and erf is the error-function.
t D x erf C C C C ap S S x 2 0) ( (5)
To evaluate the advance of the carbonation front, the specimens were split perpendicularly to the CO2 penetration direction. Afterwards, the fractured surfaces were sprayed with a 1% phenolphthalein solution in 70% ethyl alcohol. Twenty-four hours after spraying the solution, when the margin between carbonated and non-carbonated concrete is often more clearly, the carbonation depth was measured in 5 different points, ac-cording RILEM CPC-18 [32]. The carbonation rates were determined acac-cording to the Equation 6, where X is the CO2 average penetration depth (mm), K is the carbonation rate (mm/year1/2) and t is the time in which the samples were exposed to the CO2 (year). In this case, it was assumed that there was no previous carbona-tion in mortar specimens.
t
K
X
(6)2.3 Complementary tests
Capillary absorption, oxygen permeability and mercury intrusion porosity (MIP) tests were also carried out with the objective of characterising the studied materials and to assist in the comprehension of the materials behaviour. These tests were chosen because they can help to clarify how the pore are distributed in the mortar and how this distribution can influence in the transport of aggressive agents studied.
a) Capillary water absorption of mortar
The capillary water absorption test was carried out according to the Portuguese Specification E 393 [33]. The test consisted in measuring, during three days, the amount of absorbed water through only one face of a non-saturated mortar specimen immersed in a water film of 5 ± 1 mm. The absorption of water through capillari-ty is the difference between concrete hardened mass, Mi (g), that had one face in contact with water during a time ti and the dry concrete mass, M0 (g), divided by the superficial area that was in contact with water, a (mm), according to Equation (7).
a
M
M
A
i i 0
(7)b) Oxygen permeability of mortar
(con-sidered 2.02 x 10⁻¹⁶ Ns/m2, 20ºC, for oxygen), L is the thickness of the mortar cross section crossed by the gas (m), A is the cross section of mortar crossed by the gas (m2), P1 is the absolute pressure gas inlet (N/m2) and P2 is the absolute pressure gas outlet, atmospheric pressure (N/m2).
2
2 2 1
2
2
P
P
A
P
L
K
(8)c) Mercury Intrusion Porosimetry (MIP)of mortar
The MIP tests were performed with an Auto Pore IV scanning mercury porosimeter, which had a pressure range from 0.10 to 33000 psi. The contact angle and the mercury surface tension considered were 130° and 0.485 N/m, respectively.
The pressures were converted to equivalent pore diameter using the Washburn equation [35], as ex-pressed in Equation (9), where d is the pore diameter (m), is the surface tension (mN/m), is the contact angle between mercury and the pore wall (º), and P is the net pressure across the mercury meniscus at the time of the cumulative intrusion measurement (MPa).
P
d
4
cos
(9)The samples used for this test were removed from regions close to the specimens surface regardless carbonation presence. MIP requires complete removal of water from the sample prior to intrusion of the mer-cury. Thus, prior to test, specimens were oven-dried at 60°C for 24 hours.
3. RESULTS
3.1 Compressive strength
The compressive strength values presented in Table 2 show that the value obtained for FA mortars, 28 days curing, is lower than one obtained for OPC mortar: 23.60 and 37.60 MPa, respectively. However, for 90 days curing, the situation was opposite, 44.60 MPa for FA mortar and 39.10 MPa for OPC mortar. The compres-sive strength for FA mortar increased almost 90% with the period curing increase. This increase is expected and it is related with pozzolanic reactions provide by FA.
3.2 Chloride profiles
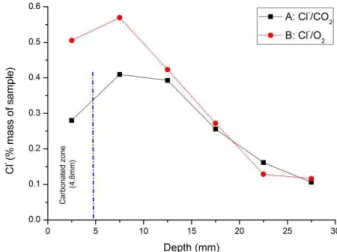
Figure 2: Chloride profiles obtained from cycles A and B, after 56 days (4 cycles), for plain OPC specimens.
Figure 3: Chloride profiles obtained from cycles A and B, after168 days (12 cycles), for plain OPC specimens.
Figure 5: Chloride profiles obtained from cycles A and B, after 168 days (12 cycles), for specimens containing Fly Ash.
For OPC mixtures, the combined action represented by cycle A (Cl-/CO2) seems to hamper the chlo-ride ingress into studied mortars. This can be observed in Figures 2 and 3, where chlochlo-ride profiles present lower chloride contents for the test specimens subjected to cycle A, combined action, than those subjected to cycle B, reference cycle. However, increasing the time test and, consequently, increasing the carbonation depth, the difference between the chloride profiles obtained in cycles A (Cl-/CO2) and B (Cl-/O2) is less sig-nificant. For 168 day-test, in the initial depth of the profile the difference between chloride profiles increases slightly but in deeper zones it does not happen.
Furthermore, for two time test, a peak of chloride concentration is observed after the carbonated zone. The chlorides content in the carbonated area is lower than in the immediately adjacent non-carbonated zone for both period of exposure.
It can be observed in Figures 4 and 5 that the incorporation of FA in mortar mixtures decreases the chloride penetration for the aggressive cycle B (Cl-/O2). Although, FA mortars subjected to the cycle A (Cl -/CO2) seem to present an opposite behaviour when compared to OPC mortars. The combined action of cycle A (Cl-/CO2) seems to contribute to the increasing the amount of total chlorides along chloride profile for FA mortars. This behaviour is more noticeable for 168-day tests.
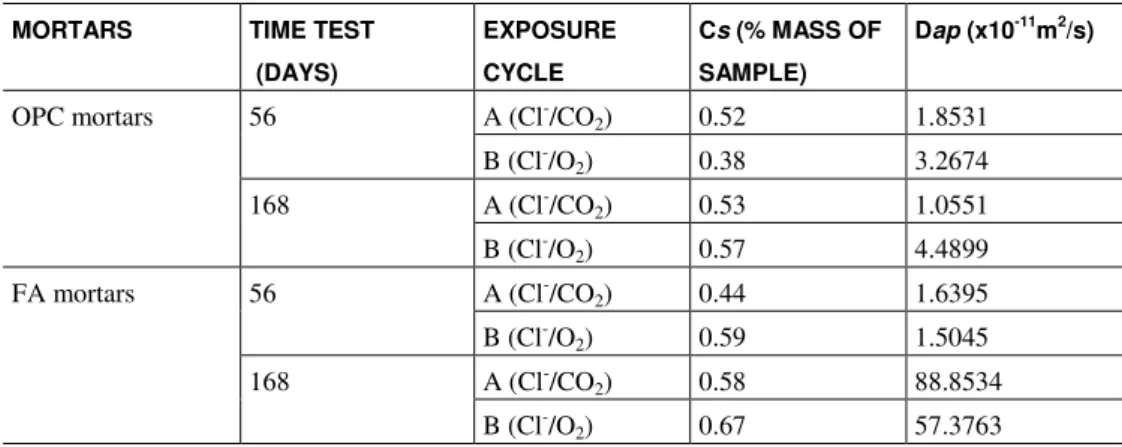
The apparent diffusion coefficients, calculated using Equation 5, are showed in Table 3. Despite the equation used not take into account the carbonation of samples, the results are in accordance with the above observed behaviours.
Table 3: Surface chloride content and apparent diffusion coefficients of OPC and FA mortars.
MORTARS TIME TEST
(DAYS)
EXPOSURE
CYCLE
Cs (% MASS OF
SAMPLE)
Dap (x10-11m2/s)
OPC mortars 56 A (Cl-/CO
2) 0.52 1.8531
B (Cl-/O
2) 0.38 3.2674
168 A (Cl-/CO
2) 0.53 1.0551
B (Cl-/O
2) 0.57 4.4899
FA mortars 56 A (Cl-/CO
2) 0.44 1.6395
B (Cl-/O
2) 0.59 1.5045
168 A (Cl-/CO
2) 0.58 88.8534
B (Cl-/O
2) 0.67 57.3763
1.55 times higher than samples subjected to aggressive cycle B (Cl-/O2).
Furthermore, the chloride concentration tends to be higher throughout the carbonated zone and, after a peak of chloride content inside or just after the carbonated zone, the chloride concentration sharply drops. JUNG et al.[20] also observed a similar behaviour for FA mortars.
3.3 Carbonation depth
Figures 6 and 7 show the average depth of carbonation front obtained for the specimens and exposure periods studied. Each result represents average data from three specimens. Figure 6 shows the results for OPC mor-tars and Figure 7 presents results for FA mormor-tars.
Figure 6: Carbonation depths obtained from cycles A and C, after 56 (4 cycles) and 168 (12 cycles) days, for OPC
spec-imens.
Figure 7: Carbonation depths obtained from cycles A and C, after 56 (4 cycles) and 168 (12 cycles) days, for specimens
containing Fly Ash.
Table 4: Increase of carbonation depth for mortars with FA when compared to OPC mortars.
TIME TEST
(days) EXPOSURE CYCLE
INCREASE CARBONATION DEPTH FOR FA
MOR-TARS COMPARED WITH OPC MORMOR-TARS (%)
56 A (Cl-/CO
2) 320
C (H2O/CO2) 138
168 A (Cl-/CO
2) 279
C (H2O/CO2) 327
For OPC mortars, the combined action seems to hamper the increase of the carbonation front in mor-tar. The mortars subjected to the combined action, cycle A (Cl-/CO2) show lower carbonation depths than the ones subject to the reference cycle, cycle C (H2O/CO2). This decrease was more pronounced for 56 days test, which was around 51%.
In the case of FA mortars, although there is a deeper carbonation, a similar behaviour to OPC mortars can be observed. It means that FA mortars subjected cycle C presented higher carbonation depth those sub-jected to cycle A, showing that the combined action seems to decrease the carbonation depth (Figures 6 and 7).
The carbonation rates, calculated using Equation 6, are showed in Table 5. Since this equation does not consider the drying-wetting effects, because during wetting there is no carbonation, the time considered in this equation was adjusted.
Table 5: Surface chloride content and apparent diffusion coefficients of OPC and FA mortars. MORTARS TIME TEST (DAYS) EXPOSURE
CYCLE
K (mm/year)
OPC mortars 56 A (Cl-/CO
2) 10.03
C (H2O/CO2) 21.18
168 A (Cl-/CO
2) 7.75
C (H2O/CO2) 9.04
FA mortars 56 A (Cl-/CO
2) 32.05
C (H2O/CO2) 45.98
168 A (Cl-/CO
2) 21.64
C (H2O/CO2) 29.55
The results achieved are in accordance with the above observed behaviours. In chloride presence, k decreases. For OPC mortars, the samples submitted to aggressive cycle C (H2O/CO2) for 56 and 168 days have, respectively, a k 2.11 and 1.16 times higher than samples subjected to the cycle A (Cl-/CO2). For FA mortar, the samples submitted to aggressive cycle C (H2O/CO2) for 56 and 168 days have, respectively, a k 1.43 and 1.36 times higher than samples subjected to the cycle A (Cl-/CO2).
3.4 Complementary tests
a) Capillary water absorption of mortar
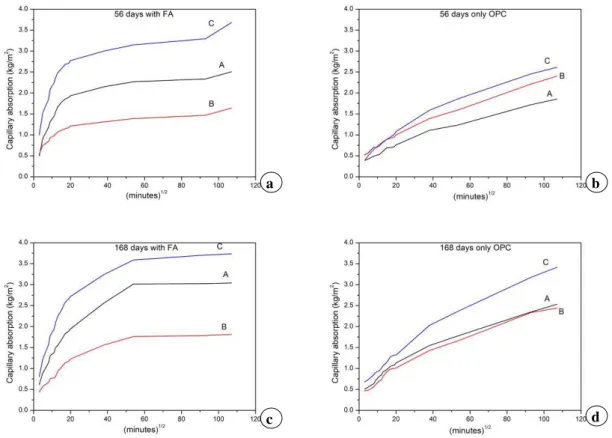
Figure 8: Capillary water absorption kinetics for cycles A, B and C: after 56 days on FA specimens (a); after 56 days on OPC specimens (b); after 168 days on FA specimens (c); after 168 days on OPC specimens (d).
The coefficient of capillary absorption (S), which corresponds to the slope of curves presents in Figure 8, were obtained taking in account only the results measured during the first 4 hours of testing that involves the capillary absorption of water from pores of larger diameters [36]. These values are presented in Table 6 as well as the respective determination coefficients (R2).
Table 6: Average coefficients of capillary water absorption (Sm) for plain OPC and FA mortars, after wetting and drying cycles.
MORTARS TIME TEST (DAYS) EXPOSURE
CYCLE
Sm
(kg/m2/(min)1/2)
STANDARD
ER-ROR
R2 (%)
OPC mortars 56 A (Cl-/CO
2) 0.024 0.0019 95.55
B (Cl-/O
2) 0.042 0.0022 98.13
C (H2O/CO2) 0.030 0.0018 97.47
168 A (Cl-/CO
2) 0.041 0.0023 97.78
B (Cl-/O
2) 0.038 0.0038 93.53
C (H2O/CO2) 0.039 0.0016 98.87
FA mortars 56 A (Cl-/CO
2) 0.102 0.0076 96.27
B (Cl-/O
2) 0.045 0.0040 94.72
C (H2O/CO2) 0.128 0.0111 94.94
168 A (Cl-/CO
2) 0.087 0.0054 97.40
B (Cl-/O
2) 0.045 0.0034 96.20
C (H2O/CO2) 0.130 0.0069 98.07
The coefficients of capillary absorption presented in Table 6 show that the values obtained for mortars
a b
subjected only to chloride penetration (cycle B) are similar for all situations, regardless FA presence and time test. The values obtained for mortars subjected to carbon dioxide (cycles A and C) show that the carbonation has a influence on capillary absorption. In FA presence, it is observed that mortars subjected to combined action of chlorides and carbon dioxide (cycle A) show greater coefficients of capillary absorption than the ones subjected only to the action of chloride penetration (cycle B). Furthermore, mortars subjected only to the action of carbon dioxide (cycle C) show greater coefficients of capillary absorption (and carbonation depth) than the ones subjected to the combined action (cycle A). For OPC mortars, the coefficient of capil-lary absorption has a variable behaviour. This result is in the same way of those observed by NGALA and PAGE [15] and MORANDEU et al. [37]. These researchers studied the effect of carbonation on pore
struc-ture and found that, after carbonation, there is a reduction in total porosity but the proportion of large capil-lary pores was increased slightly for the OPC pastes and much more significantly for FA pastes.
b) Oxygen permeability of mortar
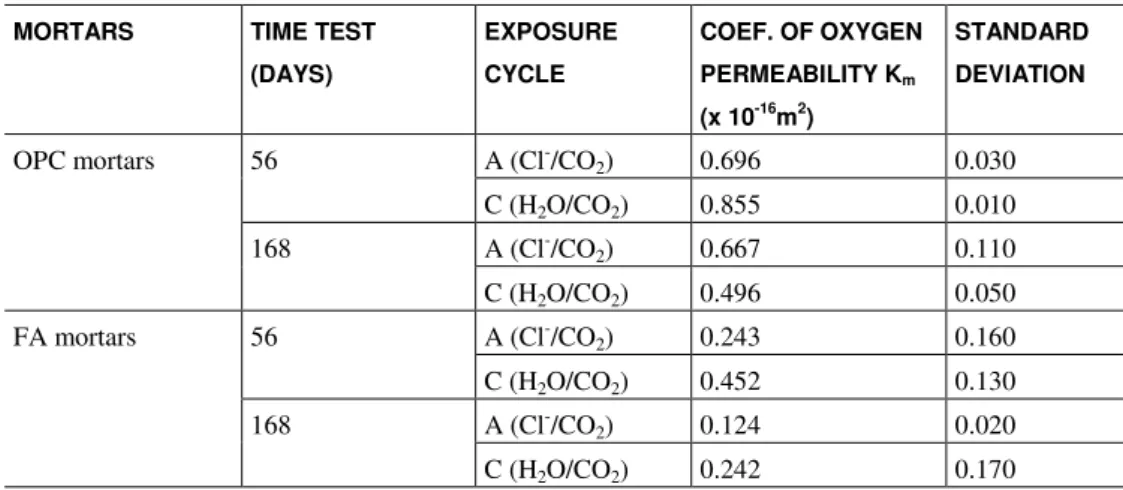
Table 7 shows oxygen permeability test results obtained after aggressive cycles A (Cl-/CO2) and C (H2O/CO2) for mortars with and without FA. These cycles were chosen because they are related with the ag-gressive gas permeability. The results represent the average values obtained from three specimens.
Table 7: Average oxygen permeability coefficients (Km) for OPC and FA mortars, after wetting and drying cycles.
MORTARS TIME TEST
(DAYS)
EXPOSURE
CYCLE
COEF. OF OXYGEN
PERMEABILITY Km
(x 10-16m2)
STANDARD
DEVIATION
OPC mortars 56 A (Cl-/CO
2) 0.696 0.030
C (H2O/CO2) 0.855 0.010
168 A (Cl-/CO
2) 0.667 0.110
C (H2O/CO2) 0.496 0.050
FA mortars 56 A (Cl-/CO
2) 0.243 0.160
C (H2O/CO2) 0.452 0.130
168 A (Cl-/CO
2) 0.124 0.020
C (H2O/CO2) 0.242 0.170
It can be observed that the incorporation of FA decreases the mortar oxygen permeability regardless exposition condition. This reduction may be related to reduction in total porosity due to FA presence. Fur-thermore, it can be observed a general tendency that mortars subjected to combined action of carbon dioxide and chlorides (cycle A) show lower oxygen permeability than the ones subjected only to the action of carbon dioxide (cycle C). In this sense, these results corroborate the carbonation depth obtained results, where the combined action resulted in less deep carbonation fronts.
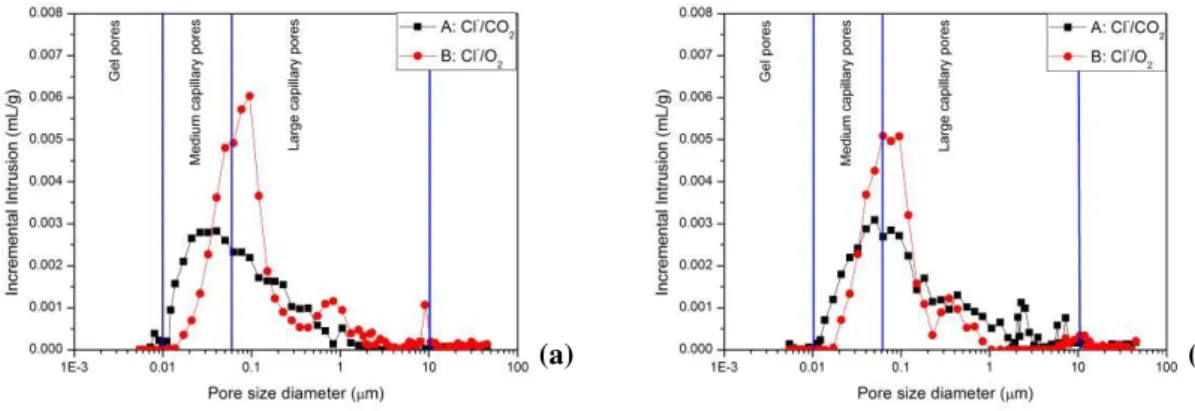
c) Mercury Intrusion Porosimetry (MIP)
Figure 9: Incremental mercury intrusion versus pore size for cycles A and B: after 56 days on OPC specimens (a) and
after 168 days on OPC specimens (b).
Figure 10: Incremental mercury intrusion versus pore size for cycles A and B: after 56 days on FA specimens (a) and after 168 days on FA specimens (b).
Table 8 summarizes the percentage of mercury intruded according to the pore ranges. The following classification was adopted: large capillary pores (10–0.05 m) medium capillary pores (0.05–0.01 m) and gel pores (<0.01 m) [38].
Table 8: Percentage of mercury intruded according to the pores range for OPC and FA mortars, after wetting and drying
cycles.
MORTARS TIME TEST
(days)
EXPOSURE
CYCLE
INCREMENTAL INTRUSION (%)
< 0.01m 0.01 - 0.05 m 10 - 0.05m > 10m
OPC mor-tars
56
A (Cl-/CO
2) 1.91 37.86 51.19 9.04
B (Cl-/O
2) 0.00 15.26 72.64 12.11
168
A (Cl-/CO
2) 0.55 23.82 67.32 10.30
B (Cl-/O
2) 0.00 17.71 67.79 14.51
FA mortars
56
A (Cl-/CO
2) 5.47 32.04 58.72 3.77
B (Cl-/O
2) 2.61 36.34 55.13 5.92
168
A (Cl-/CO
2) 5.28 28.10 60.40 6.23
B (Cl-/O
2) 2.31 46.83 37.05 13.80
For OPC mortars, it can be observed that, for mortars subjected to combined action of chlorides and carbon dioxide (cycle A), the proportion of large capillary pores decreased while the proportion of medium
(a) (b)
capillary pores and gel pores increased in relation to mortars subjected only to chloride penetration (cycle B), Figure 9, which means a refinement of porous microstructure. This fact is clearer in 56 days test (4 cycles), Figure 9 (a).
In FA presence, it is observed an opposite behaviour, that is, there is a increase in the proportion of large capillary pores and a decrease in the proportion of medium capillary pores in mortars subjected to com-bined action of chlorides and carbon dioxide (cycle A) in relation to mortars subjected only to chloride pene-tration (cycle B), Figure 10. However, there is a increase in the proportion of gel pores, which means that the refinement of pores cannot be discarded. This way, more research is being carried out to clarify this point.
4. DISCUSSION
4.1 Influence of carbonation on chloride penetration into mortars
The differences among chloride profiles presented from Figures 2 to 5 show that the carbonation has influ-ence on chloride ingress into mortars with and without FA.
For OPC mortars, under the studied conditions, combined cyclic action seems to hinder the chloride ingress into samples. The apparent diffusion coefficients shown in Table 3 corroborate this statement as they present lower coefficients for specimens under combined action.
Thus, it is likely that, for OPC mortars, the action of densification of pores caused by carbonation [15, 16, 17], and consequent reduction of matrix porosity, has been responsible for the decrease of chloride pene-tration in mortar subjected to combined action. The verified reduction in the amount of large capillary pores and the increase in the amount of medium capillary pores and gel pores caused by carbonation, Table 8, are obtained results support the above explanation.
In the opposite manner, for FA mortars (and deeper carbonation depths), under the studied conditions, the combined action seems to increase the amount of total chloride that penetrate into specimens. The appar-ent diffusion coefficiappar-ents shown in Table 3 corroborate this statemappar-ent as they presappar-ent higher values for sam-ples under combined action. In this case, the difference between Dap of specimens submitted to aggressive cycle B (Cl-/O2) and specimens subjected to the cycle A (Cl-/CO2) is lower than this same difference for OPC mixtures. This fact can be related with the lower porosity difference that there is between matrix carbonated with FA and matrix non carbonated with FA when compared to porosity difference that there is between OPC matrix carbonated and OPC matrix non carbonated.
The FA mortar coefficients of capillary absorption shown in Table 6 also present higher values for the samples under combined action, which means an increase in large capillary fraction pores. In this case, as we can see in Table 8, there is a reduction in medium capillary pores and an important increase in large capillary pores. This increase is more significant between 0.05 and 1m (Figure 10). Furthermore, it is likely that for FA mortars, the release by carbonation of chlorides previously chemically fixed has occurred. As a result, an increase of the amount of free chlorides can be verified [19] which also has been responsible for the increase of chloride penetration into mortar subjected to combined action.
It is important to note that the capillary pores and, consequently, the capillary absorption plays a im-portant role in the wetting and drying cycles. In these situations, the chlorides are absorbed by capillary ab-sorption in partially saturated concrete (convection zone) and remain inside during dry periods. This leads to a fluctuation of chloride concentration in this external region and reach a maximum chloride concentration, like a peak, in the end of the convection zone [39, 40]. The chloride profiles presented in Figures 2 to 5 show this peak. According to ANDRADE and ALONSO [41], this behaviour is also influenced by carbonation of concrete. Probably for this reason, this peak is more evident for samples under combined action. However, it is advisable to study high carbonation depths for clarify this situation.
4.2 Importance of chloride presence on carbonation progress
Analysing the differences between the values of carbonation depth shown in Figures 6 and 7, one can infer that the carbonation progress is affected by the existence of Cl- in the cementations matrix. A trend to de-crease the carbonation depth can be verified in cases where the mortars were in contact with chlorides and carbon dioxide (cycle A). These results agree with the results presented by LEIVO et al. [26], where the
car-bonation with chlorides was only 53.8% of the carcar-bonation without chlorides.
same rate in specimens subjected only to the action of carbonation (cycle C).
As reported by MALHEIRO et al. [42], the carbonation depth decrease can be associated to porosity
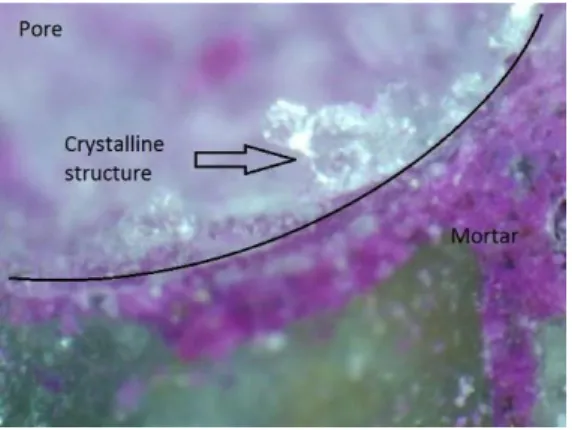
modifications. Table 7 shows that, in general, a trend can be verified in what concerns the reduction of the oxygen permeability coefficient in mortars exposed to chlorides and carbon dioxide, when compared to those exposed only to the carbon dioxide. Moreover, the capacity of the sodium chloride to physically fill the pores of the mortar, and to subsequently become an obstacle to the ingress of the carbon dioxide, should be taken into account. In order to confirm the existence of sodium chloride in the drying period of the mortar exposed to the chlorides and carbon dioxide (cycle A), pore images where captured by means of optical microscope, as depicted in Figure 11.
Figure 11: Optical microscope image (x400) of sample subjected to the combined action of CO2 and Cl- (cycle A) in a
non-carbonated region.
The crystalline structure showed in Figure 11 can be associated to sodium chloride precipitation (sol-ubility of NaCl, H2O, 25°C, is 36.9g/100ml) following the evaporation of the water from the solution during the drying period of the mortars.
It is important to bear in mind that, apart from filling the pores, sodium chloride is hygroscopic, which has is especially significant in the case of humid samples. This capacity to maintain water into the pore can help to increase the humidity inside the mortar, hindering the progress of carbonation reactions, since the humidity is one of the factors that strongly controls the carbonation [43, 44].
5. CONCLUSIONS
Mortars specimens with 0% (OPC mortar) and 40% replacement of cement CEM I 42.5 R for FA (FA mor-tar) were cast. After curing, the specimens were subjected to three different wetting-drying cycles, consider-ing NaCl solutions and CO2 atmospheres. For the adopted conditions, combined action of exposure to chlo-ride ions and carbonation has influence on the carbonation front progress and also on the characteristics of chloride profiles.
For OPC mortar, combined action seems to difficult chloride penetration. This behaviour is related to the changes in capillary pores caused by carbonation. It is likely that the action of densification of pores caused by carbonation, and consequent reduction of matrix porosity, has been responsible for the decrease of chloride penetration in mortar subjected to CO2 environment. On the other hand, for FA mortar (and deeper carbonation depth), the combined action seems to increase the amount of total chloride along chloride profile. This behaviour is related to the changes in capillary pores too. In this case, there is a reduction in medium capillary pores and an important increase in large capillary pores. This behaviour also can be related to the release of chemically fixed chlorides that contribute for the increase in chloride ingress.
Thus, for many practical situations in which blended cements are used to restrict rates of chloride in-gress into concrete structures with a view to extending the corrosion-initiation times of embedded reinforcing steel, the FA use should be considered with care. It is important to say that, in strongly polluted environ-ments, with very high concentrations of CO2 and chloride ions, the presence of FA, due to its chemical inter-action, may affect the chloride penetration, accelerating it.
inside the mortar, may hinder the development carbonation front.
6. ACKNOWLEDGMENTS
The authors thank the Foundation for Science and Technology (FCT) for supporting this research. The au-thors also thank the SECIL for making available cement used in this research and the CIMENTEIRA DO LOURO for providing the aggregates used.
This work is co-financed by FEDER funds through the Competitively Factors Operational Programme - COMPETE and by national funds through FCT within the scope of the project POCI-01-0145-FEDER-007136.
7. BIBLIOGRAPHY
[1] LIU, R., JIANG, L., XU, J., et al., “Influence of carbonation on chloride-induced reinforcement corrosion
in simulated concrete pore solutions”, Construction and Building Materials, v. 56, pp. 16-20, Apr. 2014.
[2] AMERICA SOCIETY OF CIVIL ENGINEERS, INFRASTRUCTURE REPORT CARD, http://www.infrastructurereportcard.org/. Accessed in May 2017.
[3] CHINDAPRASIRT, P., RUKZON, S., SIRIVIVATNANON, V., "Effect of carbon dioxide on chloride penetration and chloride ion diffusion coefficient of blended Portland cement mortar", Construction and Building Materials, v.22, pp. 1701-1707, Aug. 2008.
[4] FEDERATION INTERNATIONALE DU BETON, FIB, Bulletin nº 34, Model code for service life de-sign, Switzerland, 2006.
[5] NATIONAL CIVIL ENGINEERING LABORATORY, LNEC E 465, Concrete - Methodology for esti-mating the concrete performance properties allowing to comply with the design working life of the reinforced or prestressed concrete structures under the environmental exposures XC and XS (in Portuguese), Lisbon, 2007.
[6] LEE, M. K., JUNG, S. H., OH, B. H., “Effects of carbonation on chloride penetration in concrete”, ACI Material Journal, v. 110, pp. 559-566, Nov. 2013.
[7] KUOSA, H., FERREIRA, R.M., HOLT, E., et al., “Effect of coupled deterioration by freeze–thaw,
car-bonation and chlorides on concrete service life”, Cement and Concrete Composites, v. 47, pp. 32–40, Mar.
2014.
[8] BACKUS, J., McPOLIN, D., HOLMES, N., LONG, A., “Combined chloride and carbon dioxide ingres-sion in concrete exposed to cyclic wetting and drying”, In: CERI - Civil Engineering Research Association of Ireland, 1-6, Belfast, United Kingdom, Aug. 2014.
[9] COSTA, A., APPLETON, J., “Concrete carbonation and chloride penetration in a marine environment”,
Concrete Science and Engineering, v. 3, pp. 242-249, Dec. 2001.
[10] ZIVICA, V., “Corrosion of reinforcement induced by environment containing chloride and carbon diox-ide”, Bulletin of Materials Science, v. 6, pp. 605-608, Oct. 2003.
[11] CHENGFANG, Y., DITAO, N., DAMING, L., “Effect of carbonation on chloride diffusion in fly ash concrete”, Disaster Advances, v. 5, pp. 433-436, Oct. 2012.
[12] MALHEIRO, R., CAMÕES, A., FERREIRA, R.M., et al., “Effect of carbonation on the chloride
diffu-sion of mortar specimens exposed to cyclic wetting and drying”, In: Proceedings ofXII International Confer-ence on Durability of Building, Materials and Components, 482-489, São Paulo, Brazil, Sep. 2014.
[13] RAMEZANIANPOUR, A. A., GHAHARI, S. A., ESMAEILI, M., “Effect of combined carbonation and chloride ion ingress by an accelerated test method on microscopic and mechanical properties of concrete”,
Construction and Building Materials, v. 58, pp. 138-146, May 2014.
[14] POULSEN, E., MEJLBRO, L., Diffusion of chloride in concrete - theory and application, 1ª ed., United
Kingdom, Taylor & Francis, 2006.
[15] NGALA, V. T., PAGE, C. L., “Effect of carbonation on pore strucure and diffusional properties of hy-drated cement pastes”, Cement and Concrete Research, v. 27, pp. 995-1007, Jul. 1997.
[16] DIAS, W.P.S., “Reduction of cement sorptivity with age through carbonation”, Cement and Concrete Research, v. 30, pp. 1255-1261, Aug. 2000.
[18] IHEKWAHA, N. M., HOPE, B.B., HANSSON, C.M., “Carbonation and Electrochemical Chloride Ex-traction from Concrete”, Cement and Concrete Research, v. 26, pp. 1095-1107, Jul. 1996.
[19] WAN, X., WITTMANN, F. H., ZHAO, T., et al., “Chloride content and pH value in the pore solution of
concrete under carbonation”, Journal Zhejiang University-SCIENCE A, v. 14, pp. 71-78, Jan. 2013.
[20] GONI, S., GUERRERO, A., “Accelerated carbonation of Friedel´s salt in calcium aluminate cemente paste”, Cement and Concrete Research, v. 33, pp. 21-26, Jan. 2003.
[21] SRYAVANSHI, A. K., SWAMY, R. N., “Stability of Friedel´s Salt in Carbonated Concrete Structural Elements”, Cement and Concrete Research, v. 26, pp. 729-741, May 1996.
[22] JUNG, S., CHOI, Y., LEE, B., “Influence of carbonation on the chloride diffusion in concrete”, In: In-ternational Conference on Sustainable Building, 1191-1196, Seoul, Korea, Jun. 2007.
[23] DITAO,N., CONGTAO, S., “Study on Interaction of Concrete Carbonation and Chloride Corrosion”,
Journal of the Chinese Ceramic Society, v. 41, pp. 1094-1099, 2013.
[24] ALONSO, C., ACHA, M., ANDRADE, C., et al., “Incidence of the addition of fly ash on durability of
reinforced concrete structures, concrete and steel”, (in Spanish), Hormigón y Acero, v. 194, pp. 43-52, 1994.
[25] MONTEMOR, M.F., CUNHA, M.P., FERREIRA, M.G., et al., “Corrosion behaviour of rebars in fly
ash mortar exposed to carbon dioxide and chlorides”, Cement and Concrete Composites, v. 24, pp. 45-53,
Fev. 2002.
[26] LEIVO, M., SISTONEN, E., AL-NESHAWY, F., et al., Effect of interacted deterioration parameters on service life of concrete structures in cold environments: Laboratory test results 2009 - 2011, In: DuraInt
Project, Finland, 2011.
[27] REIS, R., MALHEIRO, R., CAMÕES, A., et al., “Carbonation Resistance of High Volume Fly Ash
Concrete”, Key Engineering Materials, v. 634, pp. 288-299, 2015.
[28] FLOREA, M. V. A., BROUWERS, H. J. H., “Chloride Binding related to Hydration Products - Part I: Ordinary Portland Cement”, Cement and Concrete Research, v. 42, pp. 282-290, Feb. 2012.
[29] EUROPEAN COMMITTEE FOR STANDARDIZATION, Final Draft CEN/TS 12390-12, Testing hardened concrete - Part 12: Determination of the potential carbonation resistance of concrete: Accelerated carbonation method, Brussels, 2010.
[30] RILEM COMMITTEE TC 178-TMC, “Testing and modelling chloride penetration in concrete: Methods for obtaining dust samples by means of grinding concrete in order to determine the chloride concentration profile”, Materials and Structures,, v. 46, pp. 337-344, Mar. 2013.
[31] RILEM Committee TC 178-TMC, “Testing and modelling chloride penetration in concrete: Analysis of total chloride content in concrete”, Materials and Structures,, v. 35, pp. 583-585, Nov. 2002.
[32] RILEM Committee CPC-18, “Measurement of hardened concrete carbonation depth”, Materials and Structures, v. 21, pp. 453-455, Nov. 1988.
[33] NATIONAL CIVIL ENGINEERING LABORATORY, LNEC E 393, Concrete - Determination of the absorption of water through capillarity (in Portuguese), Lisbon, 1993.
[34] CABRERA, J.G., “Design and Production of High Performance Concrete”, In: Proceedings of Interna-tional Conference Infrastructure Regeneration and Rehabilitation Improving the Quality of Life Through Better Construction, 1-14, Sheffield, United Kingdom, Jun. 1999.
[35] WASHBURN, E.W., “Note on a method of determining the distribution of pore sizes in a porous mate-rial”, Proceedings of the National Academy of Sciences of the United States of America, v. 7, pp. 115–116,
Apr. 1921.
[36] COUTINHO, J. S., Improving the durability of concrete formwork for treatment (in Portuguese), Ph.D.
Thesis, University of Porto, Portugal, 1998.
[37] MORANDEAU, A., THIÉRY, M., DANGLA, P., “Impact of accelerated carbonation on OPC cement paste blended with fly ash”, Cement and Concrete Research, v. 67, pp. 226-236, Jan. 2015.
[38] ZHANG, M.H. , ISLAM, J., “Use of nano-silica to reduce setting time and increase early strength of concretes with high volume fly ash or slag”, Construction and Building Materials, v.29, pp. 573–580, Apr.
2012.
[40] MARTÍN-PÉREZ, B., Service life modelling of RC highway structures exposed to chlorides, Ph.D.
The-sis, University of Toronto, Canada, 1999.
[41] ANDRADE, C., ALONSO, C., “Modelling of skin effects on diffusion process in concrete”, In: Pro-ceedings of International RILEM Workshop on Chloride Penetration Into Concrete, 182-194,
Saint-Rémy-lès-Chevreuse, France, Oct. 1995.
[42] MALHEIRO, R., CAMÕES, A., FERREIRA, R.M., et al., “Carbonation front progress in mortars
con-taining fly ash considering the presence of chloride ions”, Key Engineering Materials, v. 634, pp. 214-221,
2015.
[43] BASHEER, L., KROPPB, U., CLELANDC, D., “Assessment of the durability of concrete from its per-meation properties: a review”, Construction and Building Materials, v. 15, pp. 93-103, Mar. 2001.
![Figure 1: SEM fly ash images 100m (x300) (a) 30m (x1500) (b) (REIS et al. [27]).](https://thumb-eu.123doks.com/thumbv2/123dok_br/16315918.718820/4.892.174.735.143.359/figure-sem-fly-ash-images-reis-et-al.webp)