Rui Dalla Valle Epiphanio(1), Antonio Roberto Formaggio(2), Bernardo Friedrich Theodor Rudorff(2), Eduardo Eiji Maeda(3) and Alfredo José Barreto Luiz(4)
(1)Louis Dreyfus Commodities Brasil S.A., Avenida Brigadeiro Faria Lima, no 1.355, 13o andar, CEP 01452-919 São Paulo, SP, Brazil. E-mail: rui.epiphanio@ldcommodities.com (2)Instituto Nacional de Pesquisas Espaciais, Caixa Postal 515, CEP 12245-970 São José dos Campos, SP, Brazil. E-mail: formag@dsr.inpe.br, bernardo@dsr.inpe.br (3)University of Helsinki, Department of Geosciences and Geography, Gustaf Hällströmin katu 2, Kumpula, FI-00014, Helsinki, Finland. E-mail: eduardo.maeda@helsinki.• (4)Embrapa Meio Ambiente, Caixa Postal 69, CEP 13820-000 Jaguariúna, SP, Brazil. E-mail: alfredo@cnpma.embrapa.br
Abstract – The objective of this work was to evaluate the application of the spectral-temporal response surface (STRS) classi! cation method on Moderate Resolution Imaging Spectroradiometer (MODIS, 250 m) sensor images in order to estimate soybean areas in Mato Grosso state, Brazil. The classi! cation was carried out using the maximum likelihood algorithm (MLA) adapted to the STRS method. Thirty segments of 30x30 km were chosen along the main agricultural regions of Mato Grosso state, using data from the summer season of 2005/2006 (from October to March), and were mapped based on ! eldwork data, TM/Landsat-5 and CCD/ CBERS-2 images. Five thematic classes were considered: Soybean, Forest, Cerrado, Pasture and Bare Soil. The classi! cation by the STRS method was done over an area intersected with a subset of 30x30-km segments. In regions with soybean predominance, STRS classi! cation overestimated in 21.31% of the reference values. In regions where soybean ! elds were less prevalent, the classi! er overestimated 132.37% in the acreage of the reference. The overall classi! cation accuracy was 80%. MODIS sensor images and the STRS algorithm showed to be promising for the classi! cation of soybean areas in regions with the predominance of large farms. However, the results for fragmented areas and smaller farms were less ef! cient, overestimating soybean areas.
Index terms: Glycine max, accuracy, agricultural statistics, classi! cation, remote sensing, thematic map.
Estimativa de áreas de soja usando superfícies espectro-temporais
derivadas de imagens MODIS em Mato Grosso, Brasil
Resumo – O objetivo deste trabalho foi avaliar a aplicação do método de classi! cação por superfícies de resposta espectro-temporal (STRS) em imagens do sensor Moderate Resolution Imaging Spectroradiometer (MODIS, 250 m) para estimar áreas de plantio de soja no Estado de Mato Grosso, Brasil. A classi! cação foi realizada usando o algoritmo de máxima verossimilhança (MLA) adaptado ao algoritmo STRS. Trinta segmentos de 30x30 km foram escolhidos ao longo das principais regiões agrícolas do estado, com dados da safra de verão de 2005/2006 (outubro a março), e mapeados com base em dados de campo e de imagens orbitais TM/Landsat-5 e CCD/CBERS-2. Cinco classes temáticas foram consideradas: Soja, Floresta, Cerrado, Pastagem e Solos Expostos. A classi! cação pelo método das STRS foi feita com base em uma área interseccionada por um subconjunto de segmentos de 30x30 km. O STRS superestimou os valores de referência em 21,31% em regiões com predomínio da cultura da soja e em 132,37% em regiões nas quais a soja era menos predominante. A exatidão global da classi! cação foi de 80%. As imagens MODIS e o algoritmo STRS mostraram-se promissores para a classi! cação da soja em regiões com predominância de grandes fazendas. Entretanto, os resultados para áreas fragmentadas em fazendas menores foram menos e! cientes, superestimando as áreas de soja.
Termos para indexação: Glycine max, acurácia, estatísticas agrícolas, classi! cação, sensoriamento remoto, mapa temático.
Introduction
The availability of reliable information of the agricultural production is increasingly a fundamental demand in the decision making process, both in
of important crops. The operational methodology currently applied to perform crop forecasting in Brazil is made with extensive, prolonged, expensive and subjective surveys based on the opinion of technical agents involved in the agricultural segment (Instituto Brasileiro de Geogra! a e Estatística, 2002); thus, the analysis of the errors and uncertainties involved in this methodology is not practicable. Therefore, an increasing demand is observed for crop forecasts derived from remote sensing data, which allow faster results, with higher accuracy and lower costs than the traditional techniques (Food and Agriculture Organization of the United Nations, 1998; Prasad, 2006).
Previous works, carried out with the TM-Landsat and the CCD-CBERS sensors, with a spatial resolution of approximately 30 and 20 m respectively, showed that these sensors are appropriate for the quanti! cation of crop areas from the point of view of its spatial resolution (Chen, 1990; Sanches, 2004; Soares et al., 2008). However, the temporal resolution of such satellites, which ranges around 16 days or more, is still a problem in the operational use of this kind of data for crop forecasting, given the high probability of cloud cover along the summer season (Ippoliti-Ramilo, 1999), especially in non-irrigated crops at tropical regions. In this context, the MODIS sensor, launched in 1999 and 2002 on board of the Terra and Aqua satellites respectively, represents a great opportunity for monitoring medium and large agricultural properties (Doraiswamy et al., 2004), offering almost daily images, increasing the probability of cloud free data, with a spatial resolution of up to 250 m (Justice et al., 2002).
Mapping of crop areas must take into account the high dynamics of the agricultural activities, and it is indicated that techniques using the spectral-temporal pro! les of the crops should be considered (Badhwar et al., 1982). Among the multi-spectral-temporal analyses, the classi! cation using the spectral-temporal response surface (STRS), developed by Vieira (2000), can be highlighted. A STRS is a model that describes the pixel pattern of multispectral images acquired in different dates. Instead of using re" ectance values, this methodology uses parameterized polynomial coef! cients of each STRS, for each pixel of a spectral-temporal data series. Each pixel is represented in a tridimensional space with control points spatially distributed in the spectral, temporal and re" ectance
components disposed in the X, Y and Z axes respectively, and each class of the studied area has a speci! c STRS (Vieira et al., 2002).
The objective of the present work was to evaluate the application of the STRS method on MODIS images in order to identify soybean areas in Mato Grosso state, Brazil.
Material and Methods
The study area is located in the Mato Grosso state (6o00'S to 19o45'S and 50o06'W to 62o44'W), in the
Brazilian central region.
The following orbital data were used: 1, ten scenes of Thematic Mapper (TM) sensor onboard satellite Landsat-5, acquired between October 1st, 2005 and
March 31, 2006 (crop year 2005/2006), from Landsat World Reference System’s (WRS) orbits/points 224/70, 224/71, 224/72, 225/70, 225/72, 227/68, 227/69, 227/70, 228/69, 228/70; 2, scenes of charge coupled device (CCD) camera onboard satellite CBERS-2, acquired in the same TM/Landsat data time period; and 3, MOD13Q1 product (Justice et al., 2002), which provides enhanced vegetation index (EVI) of 16-day composite images from the Terra/MODIS sensor (acquired in the same time period as TM/Landsat), tile H12V10, which encompass nearly 90% of the Mato Grosso state territory and practically its entire agricultural area.
comparable to the MODIS error in areas of ! at relief when post-processing of satellite ephemeris is used (Lee et al., 2004). The Landsat/TM acquisitions were " rst compared visually at each site to ensure that they were co-registered correctly in the UTM coordinate system, and when a misregister was veri" ed in both the X and Y axes, that acquisition was adequately translated. This way, the Landsat acquisitions at each case were judged to be co-registered within one 30-m TM pixel. This procedure was the same used by Roy et al. (2008), with Landsat Enhanced Thematic Mapper Plus (ETM+) and MODIS/Terra multi-temporal data.
The present work used images from the MODIS sensor, tile H12V10, product MOD13Q1, taking into account seven dates from periods considered ideal for differentiation of crops, from October to March (late spring and summer in the southern hemisphere), as recommended by Van Niel & McVicar (2004). The chosen dates were 10/16/2005, 11/1/2005, 12/3/2005, 12/19/2005, 1/17/2006, 2/18/2006 and 3/6/2006. These dates indicate the beginning of each 16-day MOD13Q1 composite image used. The spectral bands used were the red (band 1, centered at 645 nm), the near-infrared (band 2, centered at 858.5 nm), the medium-infrared (band 6, centered at 1,640 nm) and the enhanced vegetation index (EVI) (Justice et al., 2002), which are better to differentiate the soybean areas from the other types of targets of the scene (Rudorff et al., 2007).
The " eldwork was carried out from January 22 to 30, 2006. The collected checkpoints supported the selection of a set of 30x30-km segments, which were used to evaluate the methods of identi" cation and quanti" cation of the area with the soybean crop in the Mato Grosso state. Two routes were established for the collection of checkpoints. The " rst route explored the agricultural areas of the municipalities of Nova Mutum, Lucas do Rio Verde, Sorriso, Tapurah, Sapezal, Campo Novo do Parecis and Diamantino, located in the central and western regions of the state. The second route went through the agricultural areas of the municipalities of Campo Verde, Primavera do Leste, Santo Antonio do Leste, Novo São Joaquim, Canarana, Querência and Paranatinga, located in the southern and eastern regions of the state. In the " eldwork, 2,076 checkpoints were collected spatially distributed along the main agricultural areas in Mato Grosso state. The acquisition of these points occurred along the main roads, with the aid of a global positioning system (GPS) unit attached
to a notebook with Global Mapper 7.0 installed. At each point, " ve classes of land use/cover were recorded: Cerrado, Forest, Pasture, Soybean and Bare Soil.
The spectral-temporal response surface (STRS) of each pixel was created using a polynomial function parameterized for the 28 control points (MODIS 7 dates and 4 bands), using the “collocation” interpolation method (Watson, 1992; Vieira et al., 2002), which allows an accurate representation of the surface adherence to the control points (Rudorff et al., 2007). All procedures of " tting surfaces were done using an executable algorithm developed by Vieira (2000).
The interpolation of the spectral-temporal variation of different targets results in surfaces with coef" cients of varying magnitudes. Then, coef" cients were arranged in a scale from 0 to 1 in relation to their minimum and maximum values respectively. The classi" cation was carried out using the maximum likelihood algorithm (MLA) adapted to the STRS method (Vieira, 2000). The MLA performs a supervised classi" cation, and needs a priori knowledge of the number of land use or land cover classes in the scene. Therefore, the land use/ cover information collected along the " eldwork was used to provide the training samples to the classi" er. According to the predominant land use/cover veri" ed in the " eldwork, " ve thematic classes were attributed: Soybean, Forest, Cerrado, Pasture and Bare Soil. To support the supervised classi" cation, pixels representing each of the land cover classes prede" ned during the " eldwork were selected. For each training pixel, an analytical surface was generated and a training surface feature was then created for each thematic class. In this study, 200 training surfaces were used for each class. After the training process, an analytical surface was created for each pixel of the image, producing a polynomial function for each pixel. The classi" cation of the pixel is made by comparing the coef" cients of its function with the coef" cients of the polynomial functions of the training surfaces and attributing to the pixel the class with the most similar coef" cients.
was mapped using supervised classi! cation supported by the ! eldwork.
As the operational procedure of the STRS classi! cation method is time and computer consuming, its application over the entire area of the MODIS tile H12V10 was considered impracticable. Thus, to test the method, an area with high concentration of soybean and covered by cloud-free Landsat scenes was selected. In this test area (13o40’S to 14o50’S and 56o00’W to
57o50’W), four reference segments of 30x30 km, all
belonging to the WRS 227/70 scene of TM/Landsat-5, were completely contained with 343 checkpoints inside. At the end of the STRS classi! cation, a thematic map was obtained for this test area, and its accuracy was evaluated by a confusion matrix and by the Kappa index analysis (Congalton & Green, 1999).
Results and Discussion
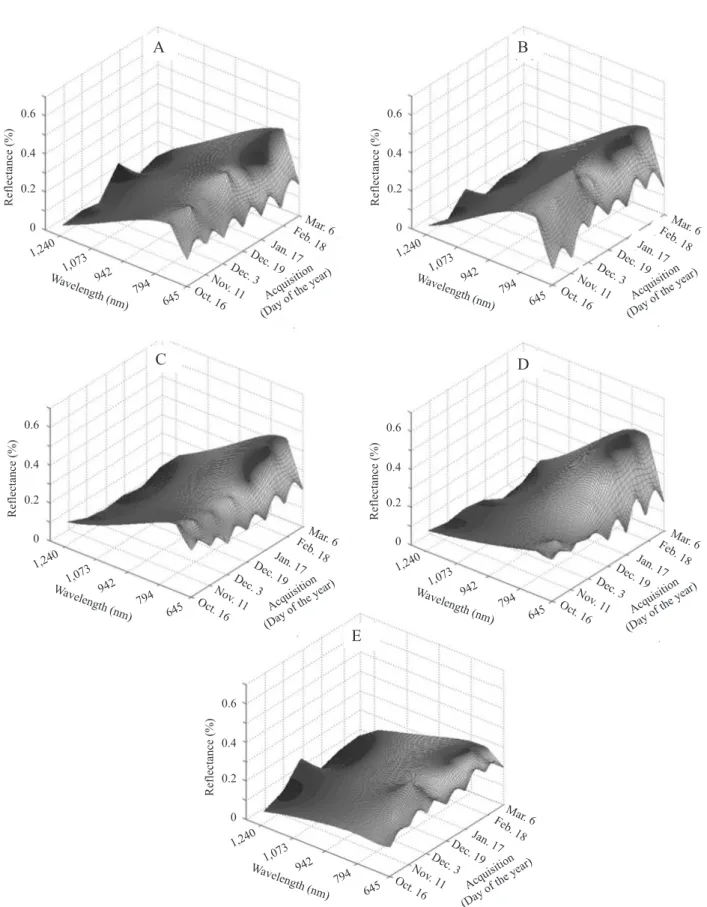
The surface of each land cover class showed distinct behaviors (Figure 1). However, a slightly similar behavior is observed between Cerrado (Figure 1 A), Forest (Figure 1 B) and Pasture (Figure 1 C). Bare Soil presents a distinct surface because the classes with vegetation show higher re" ectance values in the near-infrared wavelength (Figure 1 E). The temporal spectral pro! le of the soybean show slow re" ectance values in the infrared band from October to December (Figure 1 D), in the beginning of the phenological cycle, since the bare soil response is predominant due to the low soil cover. This behavior changes from December onward, with the vegetative growth of the soybean increasing the soil cover. In the period of maximum vegetative development, the soybean areas showed the highest re" ectance values in the infrared wavelength and the minimum values in the red wavelength, due to the leaves’ structure and to the high chlorophyll absorption, respectively. However, with the senescence of the cultures (end of February), a decrease in the infrared re" ectance and an increase in the red re" ectance is noticed. These descriptions agree with several works that analyzed the spectral-temporal behavior of the soybean (Batista et al., 1989; Antunes, 1999; Ferri, 2002; Luiz, 2003).
The soybean EVI temporal pro! le showed a distinct behavior when compared with the other land cover classes considered (Figure 2). With the use of this vegetation index in the STRS method, the discrimination
of the thematic classes became much more ef! cient in comparison with individual MODIS infrared or red bands. Although a certain similarity is noted in the Forest and Pasture EVI temporal pro! le, the pasture sometimes showed lower EVI values, especially in November 1st and December 3rd, probably due to soil
exposure or to the drier vegetation in that period. At other times, EVI was slightly greater in pasture samples than in forest ones (Figure 2). Albeit unexpected, these results were also found by Huete et al. (2006), and are related with forest phenology, climatic conditions and pasture management. For the Bare Soil class, EVI was kept constantly low along the summer season, because of the absence of vegetation cover.
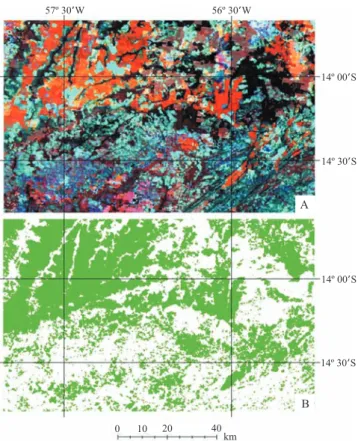
The MODIS sensor’s (MOD13Q1 product) 16-day composite image acquired in January 17, 2006 is showed in Figure 3 A, while Figure 3 B presents the ! nal results of the soybean areas’ classi! cation using the STRS method. The ! rst evaluation of the classi! cation was made by the confusion matrix derived from crossing the 343 checkpoints collected in the ! eld and the resulting STRS map. The overall accuracy of the soybean crop areas classi! cation using the STRS method was 80%, with 94% of “producer accuracy” and 83% of “user accuracy” (Table 1). However, the method showed an overestimation tendency in soybean acreage, since from 73 non-soybean checkpoints 53 were in fact identi! ed as soybean, what took the producer accuracy to only 27% for the non-soybean class. This tendency can also be observed in the user accuracy of the non-soybean class, in which, from 36 points classi! ed as non-soybean, 20 points were correct, resulting in a user accuracy of 56%. The Kappa statistic value was 0.26, which indicates a low level of agreement with the checkpoints found in the ! eldwork. However, this result can be explained by the small number of checkpoints collected to evaluate the non-soybean class (73 from 343) (Table 1).
in segments 3 and 4, con! rmed the overestimation of soybean areas by the method. It is also interesting to notice that these two segments, which had the smaller global accuracy values, were the segments with less soybean acreage.
Segments 1 and 2 showed the highest values of global accuracy and user accuracy (Table 2). A high agreement between the STRS classi! cation method and the reference maps for the four segments is noticeable (Figure 4), despite the overestimation of soybean areas. The total area cultivated with soybean in those reference segments was of 124,490 ha, while the STRS thematic
Figure 2. Enhanced vegetation index (EVI) temporal pro! le for the ! ve mapped land cover classes.
Figure 3. Moderate Resolution Imaging Spectroradiometer (MODIS) colored composition 2R6G1B 16-day composite
image of the test area (MOD13Q1 product) from January 17, 2006 (A); thematic map produced by classi! cation using the spectral-temporal response surface (STRS) method over image 3A, with soybean areas in green and no-soybean areas in white (B).
Table 2. Soybean areas classi! cation using the spectral-temporal response surface (STRS) method. Accuracy assessment in four 30x30-km reference segments of TM/Landsat-5 scene (WRS 227/70): STRS x TM/CCD Reference Map.
Table 1. Soybean areas classi! cation using the spectral-temporal response surface (STRS) method. Confusion matrix: STRS x Field checkpoint data (343 reference data from ! eldwork).
(1)Error of inclusion: occurs when an area is included in an incorrect class; (2)Error of exclusion: occurs when an area is excluded from the class to which it
belongs; (3)Correct estimation: how much of an area classi! ed as a certain class really belongs to it; (4)Correct classi! cation: how much of an area that really
map resulted in 151,015 ha, that is, 21% more. This fact is attributed to the inclusion, by the classi! er, of Forest and Cerrado areas as belonging to the soybean class.
This confusion can be explained by the pixel aggregation effect in spatial resolutions of 250 m, as described by Soares et al. (2008). In fact, these authors, when working with sensors of different spatial resolutions, found that pixels from more fragmented classes, characterized by small polygons, were aggregated by less fragmented classes. Mladinich et al. (2006), in comparison, when working with better resolution images (30 m) from TM/ Landsat and using an unsupervised clustering approach to map leafy spurge, reached only 63% in overall classi! cation accuracies.
The results of the classi! cation in segments 3 (Figures 4 E and F) and 4 (Figures 4 G and H) showed a 40,969-ha soybean area. However, the STRS classi! cation resulted in 95,198 ha, that is, 132% more. Again, the most confused classes here were the Forest and Cerrado areas. The reasons for this overestimation can be explained by the same arguments provided before for segments 1 and 2.
Thus, it may be said that the classi! cation method based on the STRS from multispectral and multitemporal MODIS sensor images is promising for the classi! cation of soybean areas in regions with predominance of large farms, which concentrate the highest production volumes in Mato Grosso state. However, the results for fragmented areas and smaller farms should be carefully analyzed, since the classi! er was less ef! cient and overestimated soybean areas.
Conclusions
1. The classi! cation methodology using the spectral-temporal response surface (STRS) presents a relatively promising result when applied in regions with predominant, large and contiguous soybean areas.
2. The soybean acreage is overestimated using the spectral-temporal response surface (STRS) classi! cation method.
3. Moderate Resolution Imaging Spectroradiometer (MODIS) data (250 m, quasi-daily repeatability) are promising for estimating soybean acreage in regions characterized by large and concentrated ! elds, like the Mato Grosso state’s agricultural conditions.
Acknowledgements
To Fundação de Amparo à Pesquisa do Estado de São Paulo, for grants; and to Conselho Nacional de Desenvolvimento Cientí! co e Tecnológico, for scholarships to the authors.
References
ANTUNES, M.A.H. Avaliação dos modelos SUITS e SAIL no estudo da re! ectância da soja (Glycine max (L.) Merril). 1999. 140p. Dissertação (Mestrado) – Instituto Nacional de Pesquisas Espaciais, São José dos Campos.
BADHWAR, G.D.; AUSTIN, W.W.; CARNES, J.G. A semi-automatic technique for multitemporal classi! cation of a given crop within a Landsat scene. Pattern Recognition, v.15, p.217-230, 1982.
BATISTA, G.T.; RUDORFF, B.F.T.; OVIEDO, A.F.P. Resposta espectral da soja e sua relação com parâmetros agronômicos. In: SIMPÓSIO BRASILEIRO DE SENSORIAMENTO REMOTO, 5., 1988, Natal. Anais. São José dos Campos: Instituto Nacional de Pesquisas Espaciais, 1989. p.406-413.
CÂMARA, G.; SOUZA, R.C.M.; FREITAS, U.M.; GARRIDO, J. Spring: integrating remote sensing and gis by object-oriented data modeling. Computers & Graphics, v.20, p.395-403, 1996.
CASTILLEJO-GONZÁLEZ, I.L.; LÓPEZ-GRANADOS, F.; GARCÍA-FERRER, A.; PEÑA-BARRAGÁN, J.M.; JURADO-EXPÓSITO, M.; SÁNCHEZ DE LA ORDEN, M.; GONZÁLEZ-AUDICANA, M. Object- and pixel-based analysis for mapping crops and their agro-environmental associated measures using QuickBird imagery. Computers and Electronics in Agriculture, v.68, p.207-215, 2009.
CHEN, S.C. Contribuição de dados de satélite no sistema de previsão de safras. São José dos Campos: Instituto Nacional de Pesquisas Espaciais, 1990. 7p.
CONGALTON, R.G.; GREEN, K. Assessing the accuracy of remotely sensed data: principles and practices. Boca Raton: CRC Lewis Press, 1999. 137p.
DORAISWAMY, P.C.; HATFIELD, J.L.; JACKSON, T.J.; AKHMEDOV, B.; PRUEGER, J.; STERN, A. Crop condition and yield simulations using Landsat and MODIS. Remote Sensing of Environment, v.92, p.548-559, 2004.
DRONIN, N.M.; BELLINGER, E.G. Climate dependence and food problems in Russia, 1900-1990: the interaction of climate and agricultural policy and their effect on food problems. Budapest: Central European University Press, 2005. 366p.
EPIPHANIO, J.C.N.; LUIZ, A.J.B.; FORMAGGIO, A.R. Estimativa de áreas agrícolas municipais, utilizando sistema de amostragem simples sobre imagens de satélite. Bragantia, v.61, p.187-197, 2002.
EPIPHANIO, R.D.V. Avaliação da potencialidade das imagens MODIS na estimação da área de soja no Estado do Mato Grosso. 2007. 89p. Dissertação (Mestrado) - Instituto Nacional de Pesquisas Espaciais, São José dos Campos.
FERRI, C.P. Utilização da re! ectância espectral para a estimativa de pigmentos fotossintéticos em dosséis de soja [Glycine max
(L.), Merril]. 2002. 173p. Tese (Doutorado) - Instituto Nacional de Pesquisas Espaciais, São José dos Campos.
FOOD AND AGRICULTURE ORGANIZATION OF THE UNITED NATIONS. Multiple frame agricultural surveys: agricultural survey programs based on area frame or dual frame
(area and list) sample design. Rome: FAO, 1998. v.2, 242p. (FAO. Statistical development series, 10).
HUETE, A.R.; DIDAN, K.; SHIMABUKURO, Y.E.; RATANA, P.; SALESKA, S.R.; HUTYRA, L.R.; YANG, W.; NEMANI, R.R.; MYNENI, R. Amazon rainforests Green-up with sunlight in dry season. Geophysical Research Letters, v.33, 2006. Doi: 10.1029/2005GL025583.
INSTITUTO BRASILEIRO DE GEOGRAFIA E ESTATÍSTICA.
Pesquisas agropecuárias. Rio de Janeiro: IBGE, 2002. v.6, 96p. (Série relatórios metodológicos).
IPPOLITI-RAMILO, G.A. Imagens TM/Landsat-5 da época de pré-plantio para a previsão da área de culturas de verão. 1999. 183p. Dissertação (Mestrado) - Instituto Nacional de Pesquisas Espaciais, São José dos Campos.
JUSTICE, C.O.; TOWNSHEND, J.R.G.; VERMOTE, E.F.; MASUOKA, E.; WOLFE, R.E.; SALEOUS, N.; ROY, D.P.; MORISETTE, J.T. An overview of MODIS land data processing and product status. Remote Sensing of Environment, v.83, p.3-15, 2002.
LEE, D.S.; STOREY, J.C.; CHOATE, M.J.; HAYES, R. Four years of Landsat-7 on-orbit geometric calibration and performance.
IEEE Transactions on Geoscience and Remote Sensing, v.42, p.2786-2795, 2004.
LUIZ, A.J.B. Estatísticas agrícolas por amostragem auxiliadas pelo sensoriamento remoto. 2003. 112p. Tese (Doutorado) - Instituto Nacional de Pesquisas Espaciais, São José dos Campos. MLADINICH, C.S.; BUSTOS, M.R.; STITT, S.; ROOT, R.; BROWN, K.; ANDERSON, G. L.; HAGER, S. The use of Landsat 7 Enhanced Thematic Mapper plus for mapping leafy spurge. Rangeland Ecology & Management, v.59, p.500-506, 2006.
NASA. Applied sciences directorate. Available at: <http://zulu. ssc.nasa.gov/mrsid/>. Accessed on: 08 Aug. 2007.
NASA. Land Processes Distributed Active Archive Center.
MODIS reprojection tool. Available at: <http://lpdaac.usgs.gov>. Accessed on: 02 Sept. 2005.
PINO, F.A. Estatísticas agrícolas para o século XXI. Agricultura em São Paulo, v.46, p.71-105, 1999.
PRASAD, A.K.; CHAI, L.; SINGH, R.P.; KAFATOS, M. Crop yield estimation model for Iowa using remote sensing and surface parameters. International Journal of Applied Earth Observation and Geoinformation, v.8, p.26-33, 2006.
ROY, D.P.; JU, J.; LEWIS, P.; SCHAAF, C.; GAO, F.; HANSEN, M.; LINDQUIST, E. Multi-temporal MODIS-Landsat data fusion for relative radiometric normalization, gap ! lling, and prediction of Landsat data. Remote Sensing of Environment, v.112, p.3112-3120, 2008.
RUDORFF, C. de M.; RIZZI, R.; RUDORFF, B.F.T.; SUGAWARA, L.M.; VIEIRA, C.A.O. Superfícies de resposta espectro-temporal de imagens do sensor MODIS para classi! cação de área de soja no Estado do Rio Grande do Sul. Ciência Rural, v.37, p.118-125, 2007.
SOARES, D. de M.; GALVÃO, L.S.; FORMAGGIO, A.R. Crop area estimate from original and simulated spatial resolution data and landscape metrics. Scientia Agricola, v.65, p.459-467, 2008.
VAN NIEL, T.G.; MCVICAR, T.R. Determining temporal windows of crop discrimination with remote sensing: a case study in south-eastern Australia. Computers and Electronics in Agriculture, v.45, p.91-108, 2004.
VIEIRA, C.A.O. Accuracy of remotely sensing classi! cation
of agricultural crops: a comparative study. 2000. 352p. Thesis
(Doctor) - University of Nottingham, Nottingham.
Received on August 31, 2009 and accepted on November 24, 2009
VIEIRA, C.A.O.; MATHER, P.M.; APLIN, P. Multitemporal classi! cation of agricultural crops using the spectral-temporal response surface. In: BRUZZONE, L.; SMITS, P. (Org.). Analysis
of multi-temporal remote sensing images. London: World
Scienti! c, 2002. p.290-297.
WATSON, D.F. Contouring: a guide to the analysis and display of spatial data. Oxford: Pergamon Press, 1992. 321p.
WOLFE, R.E.; NISHIHAMA, M.; FLEIG, A.J.; KUYPER, J.A.; ROY, D.P.; STOREY, J.C.; PATT, F.S. Achieving sub-pixel geolocation accuracy in support of MODIS land science. Remote