Article
Printed in Brazil - ©2017 Sociedade Brasileira de Química 0103 - 5053 $6.00+0.00
*e-mail: [email protected], [email protected]
Development of a Dissolution Test for Fenbendazole-Praziquantel Capsules Using
UV-PLS Method
Silvana E. Vignaduzzo,a,b María A. Opertoa and Patricia M. Castellano*,a,b
aÁrea Análisis de Medicamentos and bInstituto de Química Rosario (IQUIR-CONICET),
Facultad de Ciencias Bioquímicas y Farmacéuticas, Universidad Nacional de Rosario, Suipacha 531, S2002LRK Rosario, Argentina
A dissolution test for capsules containing 50 mg of praziquantel and 500 mg of fenbendazole was developed and validated. The optimal conditions were an USP apparatus 2 with paddles rotating at 75 rpm, 900 mL dissolution medium (a mixture of 300 mL of ethanol and 600 mL 0.5 mol L-1 HCl), at 37.0 ± 0.5 °C. Both analytes achieved with sink conditions. A published high-performance liquid chromatography (HPLC) method was used to monitoring dissolution test during the optimization. Additionally, a chemometrics method based on UV-VIS spectrophotometry and partial least-squares (PLS) was developed and validated for the simultaneous determination of both analytes in the dissolution media. The coefficients of determination were 0.9986 and 0.9959 for fenbendazole and praziquantel, respectively, and the elliptical joint confidence region (EJRC) test concluded that constant and proportional biases were absent. The optimized model was applied to build dissolution profile and its results did not show statistical differences with HPLC method.
Keywords: fenbendazole, praziquantel, dissolution test, partial least squares
Introduction
Fenbendazole (FEN), methyl N -(6-phenylsulfanyl-1H-benzimidazol-2-yl)carbamate, is shown in Figure 1. FEN is a broad spectrum benzimidazole anthelmintic prescribed worldwide in the treatment and prevention of several endoparasitic veterinary diseases.1-5 However, in rare cases was used for humans.6
Praziquantel (PRA), [2-(cyclohexylcarbonyl)-1,2,3,6,7,11b-hexahydro-4H-pyrazino (2,1-a) isoquinolin-4-one], Figure 1, is a pyrazinoisoquinolone derivative which has been shown to be highly effective against a broad spectrum of cestode and trematode parasites in humans and animals.7
Both drugs possess high permeability and low aqueous solubility and are, therefore, classified as a Class II drug according to the Biopharmaceutics Classification System (BCS).
Fenbendazole has been determined in parasite materials,8 in milk,9 in veterinary formulations10 and bulk drugs using high-performance liquid chromatography (HPLC).11 Moreover, it has been determined by liquid chromatography-tandem mass spectrometry (LC-MS/MS) in environmental samples,12 in eggs using capillary electrophoresis-mass spectrometry (CE-MS),13 in surface water using ultra-high performance liquid chromatography coupled to quadrupole linear ion trap mass spectrometry (UHPLC-QqLIT-MS),14 in swine tissues by ultra-high performance liquid chromatography time-of-flight mass spectrometry (UHPLC-TOF/MS)15 and in chicken by UHPLC-MS/MS.16 An LC-Orbitrap-HRMS was used for the determination of some anthelmintic drug residues (including fenbendazole) in distillers grains.17
Praziquantel has been determined by LC-MS/MS,9,10 HPLC,11 cathodic adsorptive stripping differential-pulse voltammetry,13 UPLC-MS14 methods in milk and human plasma.
The association of FEN and PRA is used in the veterinary treatment of parasitic diseases. However,
S N
H N
NH OCH3
O
Fenbendazole
N N
O O
Praziquantel
methods for the simultaneous determination of both drugs in pharmaceutical dosage forms are scarce. This association has been determined in dog plasma by the HPLC method18 and UHPLC-QqLIT-MS19-21 and there is not dissolution test conditions developed to evaluate formulations containing both.
The dissolution test is an important physicochemical quality control test to assess drugs during development. It has the potential to evaluate the in vivo performance of solid oral dosage forms since it assesses the release of the active substance into the dissolution medium over time.22-26
It is well known that as a tool for the quality control of pharmaceutical products, a dissolution method should be able to discriminate products made from different materials and/or processes.27 Moreover, the dissolution test can serve not only as a quality control for the manufacturing process but also as an indicator of how the formulation will perform in vivo. So, the difficulty lies in finding an in vitro dissolution test that is capable of evaluating the improvement of the drug’s oral bioavailability. The use of sink conditions is recommended in this regard, in both the United States Pharmacopoeia (USP)26 and in the European Pharmacopoeia (EP).28 However, for compounds with poor aqueous solubility, maintaining sink conditions can be problematic. In order to provide sink conditions, several solubility modifiers, such as surfactants and organic co-solvents are often added to aqueous dissolution media.29
Chemometrics enable the chemists to resolve the constituents of a complex system without the need for prior separation step.30 Partial least squares (PLS) is the most widely used first order quantitative method and hold the name “first order advantage”.31,32 This advantage consists to model interferents in unknown samples as long as these interferents were present in samples used at the calibration’s step [as another active pharmaceutical ingredient (API) or excipient].
First, we focus on the development of a dissolution test for FEN-PRA association. For this purpose, in a screening phase, different dissolution media employing different proportions of hydrochloric acid, sodium lauryl sulfate and ethanol were tested. After determining the factors affecting the dissolution test, an experimental design was used to determine optimum test conditions. At this stage of development, the analytes were quantified using the HPLC method already published.18
In a second step we set out to develop a simple and rapid method that does not require previous separation of the analytes and could replace the HPLC method in the quantification of analytes, i.e., PLS regression.
This paper describes the optimization of a test solution for FEN-PRA association and the development of an UV-PLS chemometric method for their quantification in order to provide a simple, rapid and eco-friendly method.
Experimental
Equipment
The dissolution tests were carried out with a Hanson SR8-Plus dissolution Test Station (Hanson Research, Chatsworth, USA), configured with paddles (USP apparatus 2). The dissolutions were performed in a mixture of 300 mL of ethanol and 600 mL 0.5 mol L-1 HCl as dissolution medium, thermostatized at 37 °C, at a paddle rotation rate of 75 rpm.
A Shimadzu UV-1601PC double beam spectrophotometer (Kyoto, Japan) with a fixed slit width of 2 nm, and a Shimadzu’s UV-Probe software were employed. Spectra were acquired in 1-cm quartz cells, at 2 nm intervals for PLS, against a blank of solvent and individually saved as ASCII files.
Chromatographic separations were performed with an Agilent Technologies 1200 Series chromatograph (Santa Clara, USA) equipped with four pumps, an automatic injector fitted with a 20 µL loop and a diode array detector. Analysis of aqueous solutions of FEN and PRA were performed on a Luna C18 column (250 × 4.6 mm i.d., 5 µm particule size) provided by Phenomenex (Torrance, USA), thermostatized at 30 °C with a mobile phase containing 33% acetonitrile (ACN) and 67% phosphate buffer solution (50 mmol L-1, pH 3.0), pumped at a flow rate of 1.0 mL min-1 with UV detection at 220 nm.
Chemicals and reagents
Experiments were performed with pharmaceutical grade FEN (99.48%) and PRA (99.92%) (Saporiti, Buenos Aires, Argentina) and analytical grade reagents (Merck, Darmstadt, Germany). HPLC-grade solvents (J. T. Baker, Xalostoc, Mexico) and Milli-Q water (Millipore Direct-Q UV3, Maryland, USA) were employed for HPLC analyses.
Capsules containing 500 mg of FEN and 50 mg of PRA, without excipients, were prepared in our laboratory in order to develop a dissolution test as a reference formulation.
PLS samples
The stock standard solution of PRA (744 mg L-1) was prepared in a 25 mL volumetric flask by dissolving an accurately weighed amount of PRA (18.6 mg) in acetonitrile (ACN, 5 mL) and completing to the mark with water. Then, 1.0 mL was transferred to a 250 mL volumetric flask and completing to the mark with water, giving a final concentration of 3 mg L-1. Stock standard solutions were stored at 4 °C in light-resistant containers and left to attain room temperature before use.
A calibration set of 9 samples was prepared, applying a central composite design (CCD) where five levels of concentrations of FEN and PRA were introduced by dilution of the respective stock solutions. The concentration levels were in the range of 3.6-13.5 mg L-1 for FEN and 0.36-1.34 mg L-1 for PRA. The electronic absorption spectra for these samples were collected every 2 nm in the range of 200-400 nm.
For the validation set, four equally spaced samples in the calibration interval with no collinear concentrations were prepared in triplicate. Their concentrations were in the range 4.5-12.6 mg L-1 and 0.45-1.25 mg L-1 for FEN and PRA, respectively.
HPLC validation samples
The stock standard solution of FEN (682 mg L-1) was prepared in a 100 mL volumetric flask by dissolving an accurately weighed amount of FEN in a mixture of MeOH (80 mL) and 1 mol L-1 HCl (0.3 mL) and completing to the mark with MeOH. The stock standard solution of PRA (69 mg L-1) was prepared in a 25 mL volumetric flask by dissolving an accurately weighed amount of the drug in MeOH (25 mL), completing to the mark with the same solvent and then, transferring 1.0 mL to 100 mL volumetric flask and completing to volume with MeOH. Stock standard solutions were stored at 4 °C in light-resistant containers and left to attain room temperature before use.
Aliquots of these solutions were transferred to 10 mL volumetric flasks and completed to the mark with MeOH to obtain final concentrations of 20.5, 47.8, 68.2, 115.9, 163.7, 211.4, 238.7, 259.2 and 306.9 mg L-1 of FEN and 2.1, 4.8, 6.8, 11.7, 16.5, 21.3, 24.0, 26.1 and 30.9 mg L-1 of PRA. Triplicate injections were made for each solution. For quantification of analytes, the published HPLC method18 was revalidated according to ICH guidelines.33 Linearity was evaluated at nine different concentration levels by diluting the standard solutions with MeOH to obtain solutions over the range of 10-130% for FEN (20.5-306.9 mg L-1) and PRA (2.1-30.9 mg L-1). In order to verify repeatability a solution containing a mixture of standards of both analytes at a 100% level was prepared.
For intermediate accuracy, three samples of mixed standard solutions prepared by three different analysts at 100% level were employed. For each analyte, the value of limit of detection and quantification (LOD and LOQ, respectively) were calculated as the lowest concentration which give rise to a signal-to-noise ratio of 3 and 10, respectively.
Dissolution test
Under the optimized conditions, a single capsule was added to each vessels of the dissolution test-station just before starting the test. An aliquot of 10 mL was withdrawn from the vessels, without solvent replacement at pre-established times (5, 10, 15, 20, 30 and 45 min for dissolution profiles and at 45 min for dissolution testing). Samples were filtered through 0.2 µm nylon membrane filters, and initial portion was discarded. Further dilutions were carried out with a mixture of 0.1 mol L-1 HCl and ethanol or with the mobile phase for UV-PLS or HPLC method, respectively.
Data analysis and graphics
PLS data analysis was performed using MVC1 routines34 in Matlab 7.5 (Mathworks, Natwick, USA). A variable-size moving window across the spectra was employed for selection of the appropriate regions of interest. PLS was run on mean-centered data.
Experimental designs were carried out using Design Expert v.7 trial version (Stat-Ease, Inc., Minneapolis, MN); statistical analyses and data plots were performed with OrigingPro 8 SR0 (OriginLab, Northampton, MA, USA) and SPSS v.9 (SPSS, Inc., Chicago, IL).
Results and Discussion
Dissolution testing development
In order to find a dissolution media able to challenge both APIs, several conditions were tried on capsules containing 500 mg of FEN and 50 mg of PRA prepared in our laboratory. The pharmacopoeial conditions26 for PRA tablets were tested on FEN-PRA capsules, but unsatisfactory results were found for FEN dissolution. Official guidelines recommend that dissolution testing should be carried out under physiological conditions, if possible. This allows interpretation of dissolution data with regard to in vivo performance of the product. However, strict adherence to the gastrointestinal environment need not be used in routine dissolution testing.36
Therefore, based on the literature for poorly soluble drugs, hydroalcoholic mixtures were employed.37 Then, mixtures containing HCl, sodium lauryl sulfate and ethanol, were assayed, applying a Plackett-Burman design. It was observed that the addition of sodium lauryl sulfate had not influenced the dissolution of the analytes.
A 32 factorial design was used to optimize the composition of dissolution media, and the factors to be considered were: HCl concentration (0.5, 0.75 and 1.0 mol L-1) and ethanol (0, 150 and 300 mL) with two replicates of the central point. As recommended by Official guidelines in case of associations,36 USP apparatus 2 and 75 rpm were used. The bath temperature was set at 37.0 ± 0.5 °C. According to generic dissolution specification for conventional-release oral dosage forms of the British Pharmacopoeia (BP)35 (“no less than 75% of the labeled amount in 45 min”) samples were collected at 60 minutes and the amount of dissolved drug was taken as a response to the optimization. The dissolution of APIs was analyzed by HPLC method published. This method was
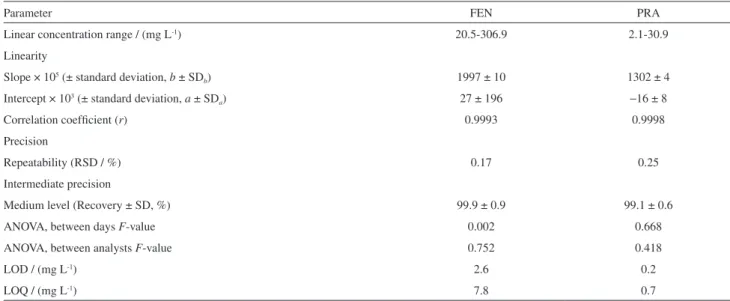
validated because it was used in another matrix different to the published. The revalidation of the method was performed in agreement with ICH guidelines with respect to accuracy, precision (repeatability and intermediate precision), linearity and range (Table 1).
The experimental data of the two responses, recovery percentages of both analytes, were fitted by polynomial models in which coefficients were computed by stepwise backward multiple regression and validated by analysis of variance (ANOVA) tests. The responses were fitted by quadratic models. In order to reach a compromise among the responses which could better satisfy the objectives, the fitted responses were simultaneously optimized employing Derringer’s desirability function. This is a response surface methodology which allows mapping the degree of compliance of a system’s response with user-defined conditions, and to predict its responses within the experimental domain.38 This approach to the simultaneous optimization of multiple responses involves creating a partial desirability function (di) for each of the n individual responses, in which values range between 0 for a fully undesirable response and 1 for a completely desirable response. The partial desirabilities are then combined into a global desirability function D, computed as the geometric mean of the partial desirabilities (D = n-1 [Π (di = 1,…,n)]1/n), the maximum of which should yield the conditions of the designed variables for an optimum response.
The goals set were to maximize the recovery percentages for two analytes. Under these optimization criteria, a maximum of the desirability function (D = 0.96) was found at 600 mL of 0.5 mol L-1 HCl and 300 mL of ethanol.
Table 1. Validation of the HPLC method
Parameter FEN PRA
Linear concentration range / (mg L-1) 20.5-306.9 2.1-30.9
Linearity
Slope × 105 (± standard deviation, b ± SD
b) 1997 ± 10 1302 ± 4
Intercept × 103 (± standard deviation, a ± SD
a) 27 ± 196 −16 ± 8
Correlation coefficient (r) 0.9993 0.9998
Precision
Repeatability (RSD / %) 0.17 0.25
Intermediate precision
Medium level (Recovery ± SD, %) 99.9 ± 0.9 99.1 ± 0.6
ANOVA, between days F-value 0.002 0.668
ANOVA, between analysts F-value 0.752 0.418
LOD / (mg L-1) 2.6 0.2
LOQ / (mg L-1) 7.8 0.7
Sink conditions were determined in dissolution medium using amounts of FEN and PRA equivalent to three times the corresponding doses found in the combined pharmaceutical formulation and the percentage of drugs released was successful.
Development of UV-PLS method
The electronic absorption spectra of PRA (1.2 mg L-1) and FEN (5.1 mg L-1) and the mixture of both drugs are shown in Figure 2. The analysis of spectral data anticipated that could seriously hinder the resolution of the mixture by conventional spectrophotometry due to the severe spectral
overlapping observed coupled to the high FEN/PRA ratio present in the pharmaceutical preparations. As can be seen in Figure 2, FEN is more than 10 times of PRA.
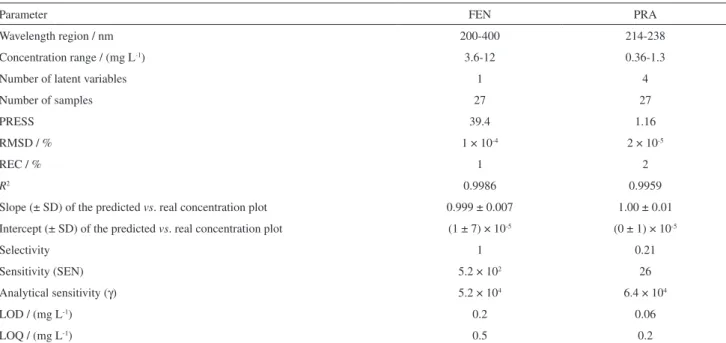
That is why we assumed that a chemometrics strategy such as PLS could be a good alternative for the simultaneous quantification of FEN and PRA. Thus, PLS modeling was carried out on the mean centered ultraviolet spectra of 9 calibration samples of FEN and PRA conforming to a five level central composite design, recorded in triplicate in the range of 200-400 nm. Table 2 reports the results regarding statistical summary and figures of merit of the model.
Low values were obtained for RMSD (root mean square deviation) and REC% (percentage of relative error in calibration), which measure the average error in the analysis and evaluate the goodness of fit of the calibration data to the models developed during calibration, respectively. LODs (limits of detection) under linear minimum calibration concentration were found, indicating that the linear range is able to quantification. R2, which describes the goodness-of-fit of the predicted concentrations to their actual values, was higher than 0.90 for both analytes. The figures of merit demonstrated the quality of the models and the suitability of the method for the proposed determinations.
During the external validation, parameters such as accuracy and precision were studied. For the validation set, four equally spaced samples in the calibration interval with no collinear concentrations were prepared in triplicate. The results, showed in Table 3, indicated that almost Figure 2. Ultraviolet spectra of PRA (1.2 mg L-1), FEN (5.1 mg L-1) and
mixture of FEN-PRA in the 200-400 nm range.
Table 2. Statistical parameters for the calibration models for the UV-PLS in the simultaneous analysis of FEN and PRA
Parameter FEN PRA
Wavelength region / nm 200-400 214-238
Concentration range / (mg L-1) 3.6-12 0.36-1.3
Number of latent variables 1 4
Number of samples 27 27
PRESS 39.4 1.16
RMSD / % 1 × 10⁻⁴ 2 × 10⁻⁵
REC / % 1 2
R2 0.9986 0.9959
Slope (± SD) of the predicted vs. real concentration plot 0.999 ± 0.007 1.00 ± 0.01
Intercept (± SD) of the predicted vs. real concentration plot (1 ± 7) × 10-5 (0 ± 1) × 10-5
Selectivity 1 0.21
Sensitivity (SEN) 5.2 × 10² 26
Analytical sensitivity (γ) 5.2 × 10⁴ 6.4 × 10⁴
LOD / (mg L-1) 0.2 0.06
LOQ / (mg L-1) 0.5 0.2
quantitative recoveries of the analytes were achieved over the range of concentrations tested, satisfying acceptance criteria for this study.
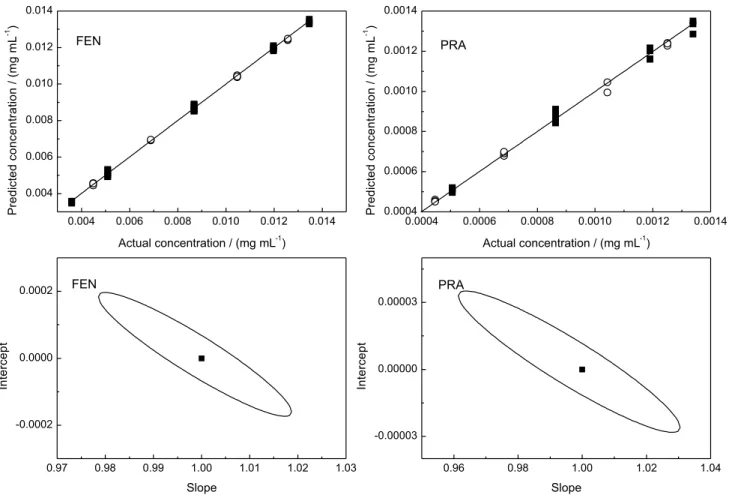
The Figure 3 shows the actual versus predicted concentrations curves for calibration and validation samples obtained by PLS for FEN and PRA, respectively. The dispersions show a good agreement between the actual and predicted concentrations for both calibrations and validations samples. In accordance with the values of slope and intercept of the regression, exhibit in Table 2, there are no systematic, constant or proportional errors in FEN and
PRA prediction.
The estimated intercept and slope were compared with their ideal values of 0 and 1 using the elliptical joint confidence region (EJCR) test. If the point (1, 0) is inside the EJCR, it can be concluded that constant and proportional biases are absent.39
UV-PLS method application
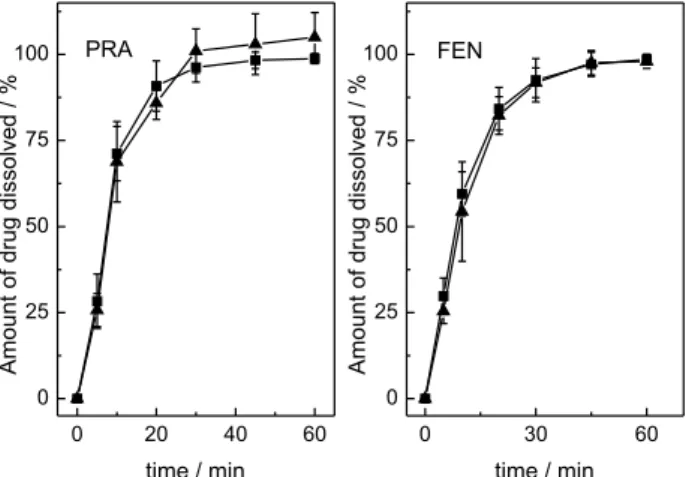
The UV-PLS method was used by building the dissolution profiles of capsules, used as a reference, for both analytes.
In order to evaluate the results of the proposed UV-PLS for dissolution profiles of FEN and PRA, a published18 HPLC method was employed (Figure 4).
The recovery values obtained by PLS at each point of the dissolution profile were plotted against the recovery values obtained by HPLC on the same point. In an ideal case, these types of plots must give a straight line with respective slope and intercept equal to 1 and zero. The Figure 5 shows a good agreement between the predicted values of concentrations by PLS and HPLC methods. The results allow us to conclude that there are no statistically
Figure 3. (Left) Actual versus predict concentration for FEN, () calibration samples, () validation samples and joint confidence ellipse test; (Right) actual versus predict concentration for PRA, () calibration samples, () validation samples and joint confidence ellipse test.
Table 3. Accuracy and precision for the UV-PLS simultaneous determination of FEN and PRA
Parameter FEN PRA
Number of samples 11 11
Recovery / % 99.9 99.6
RSD 1.1 2.2
R2 0.999 0.998
Intercept 1.5 ± 0.5 0.3 ± 0.1
Slope 0.979 ± 0.005 0.96 ± 0.01
significant differences in the application of both methods for the quantification of FEN and PRA in the dissolution test. However, the UV-PLS method proved to be less time consuming, simpler and more eco-friendly, taking into account that chromatograms required as much as 25 min to develop.
Conclusions
A novel dissolution test were developed and validated to evaluate performance of FEN and PRA association for veterinary use. Complete dissolution of capsules could be achieved at 60 min using USP apparatus 2 at 75 rpm in 900 mL of dissolution medium containing a mixture of 600 mL of 0.5 mol L-1 HCl and 300 mL of ethanol. Therefore, an alternative method for the simultaneous determination of FEN and PRA in combined pharmaceutical formulations has been developed. The method, which is based on the PLS analysis of spectral information in the ultraviolet region, was found to be adequately sensitive and robust, and
provides reproducible results. The preparation time of the sample by the method developed is reduced by 25% as well as the amounts of solvent used and the waste generated. Its application to the elaboration of drug dissolution profiles was also assessed by performing a statistical comparison with the results obtained using HPLC. The method was shown to provide results that were not statistically different from those obtained with the HPLC methodology used as reference. The simplicity and high sample throughput of this method make it suitable for routine quality control.
Acknowledgments
The authors acknowledge Consejo Nacional de Investigaciones Científicas y Técnicas (CONICET), Agencia Nacional de Ciencia y Tecnología and Secretaría de Ciencia y Técnica (SECyT-UNR) for financial support.
References
1. Iosifidou, E. G.; Haagsma, N.; Tanck, M. W. T.; Boon, J. H.; Olling, M.; Aquaculture1997, 154, 191.
2. Praslička, J.; Bjørn, H.; Várady, M.; Nansen, P.; Hennessy, D. R.; Talvik, H.; Int. J. Parasitol.1997, 27, 403.
3. Garossino, K. C.; Ralston, B. J.; Olson, M. E.; McAllister, T. A.; Milligan, D. N.; Genswein, B. M. A.; Vet. Parasitol.2005,
129, 35.
4. Ghazaei, C.; Small Ruminant Res.2007, 71, 48.
5. Willesen, J. L.; Kristensen, A. T.; Jensen, A. L.; Heine, J.; Koch, J.; Vet. Parasitol.2007, 147, 258.
6. Koehler, A. V.; Jex, A. R.; Haydon, S. R.; Stevens, M. A.; Gasser, R. B.; Biotechnol. Adv.2014, 32, 280.
7. Cioli, D.; Picamattocia, L.; Parasitol. Res.2003, 90, S3.
8. Mottier, L.; Alvarez, L.; Lanusse, C.; J. Chromatogr. B: Anal. Technol. Biomed. Life Sci.2003, 798, 117.
9. De Ruyck, H.; Van Renterghem, R.; De Ridder, H.; De Brabander, D.; Food Control2000, 11, 165.
10. Van Tonder, E. C.; Villiers, M. M.; Handford, J. S.; Malan, C. E. P.; Preez, J. P.; J.Chromatogr. A 1996, 729, 267.
11. Gomes, A. R.; Nagaraju, V.; J. Pharm. Biomed. Anal. 2001, 26, 919.
12. Wagil, M.; Maszkowska, J.; Białk-Bielinska, A.; Stepnowski, P.; Kumirska, J.; Chemosphere2015, 119, S35.
13. Dominguez-Alvarez, J.; Mateos-Vivas, M.; Garcia-Gomez, D.; Rodriguez-Gonzalo, E.; Carabias-Martinez, R.; J. Chromatogr. A2013, 1278, 166.
14. Zrnčic, M.; Gros, M.; Babic, S.; Kaštelan-Macan, M.; Damia Barcelo, D.; Petrovic, M.; Chemosphere2014, 99, 224. 15. Xia, X.; Wanga, Y.; Wang, X.; Li, Y.; Zhong, F.; Li, X.; Huang,
Y.; Ding, S.; Shen, J.; J. Chromatogr. A2013, 1292, 96.
Figure 5. Plot of the predicted concentrations by PLS procedures against
those predicted by HPLC.
Figure 4. Dissolution profiles of FEN-PRA capsule containing 500 mg
16. Pereira Lopes, R.; Cazorla Reyes, R.; Romero-González, R.; Garrido Frenicha, A.; Martínez Vidal, J. L.; Talanta2012, 89, 201.
17. Kaklamanos, G.; Vincent, U.; Von Holst, C.; J. Chromatogr. A 2013, 1322, 38.
18. Morovján, G.; Csokán, P.; Makranszki, L.; Abdellah-Nagy, E. A.; Tóth, K.; J. Chromatogr. A1998, 797, 237.
19. Klausz, G.; Keller, É.; Sára, Z.; Székely-Körmöczy, P.; Laczay, P.; Ary, K.; Sótonyi, P.; Róna, K.; Biomed. Chromatogr.2015, 29, 1859.
20. Havlíková,L.; Brabcová, I.; Šatínský, D.; Matysová, L.; Luskačová, A.; Osička, Z.; Solich, P.; Anal. Methods2012, 4, 1592.
21. Soto, C.; Otipka, R.; Contreras, D.; Yáñez, J.; Toral, M. I.;
J. Chil. Chem. Soc.2013, 58, 1824.
22. Amidon, G. L.; Lennernäs, H.; Shah, V. P.; Crison, J. R.; Pharm. Res. 1995, 12, 413.
23. Dressman, J. B.; Amidon, G. L.; Reppas, C.; Shah, V. P.; Pharm. Res.1998, 15, 11.
24. Siewert, M.; Dressman, J.; Brown, C. K.; Shah, V. P.; AAPS
PharmSciTech2003, Article 7.
25. Azarmi, S.; Roac, W.; Lobenberg, R.; Int. J. Pharm.2007, 328, 12.
26. The United States Pharmacopeia, USP 35, ch. 1092; United States Pharmacopeial Convention, Inc.: Rockville, USA, 2012. 27. Long, M.; Chen, Y. In Developing Solid Oral Dosage Forms
Pharmaceutical Theory and Practice; Qiu, Y.; Chen, Y.; Zhang,
G. G. Z.; Liu, L.; Porter, W. R., eds.; Elsevier: Oxford, 2009, ch. 14, p. 319.
28. European Pharmacopoeia, 8th ed.; Council of Europe: Strasbourg, France, 2014.
29. Phillips, D. J.; Pygall, S. R.; Cooper, V. B.; Mann, J. C.;
J. Pharm. Pharmacol. 2012, 64, 1549
30. Brereton, R. G.; Chemometrics: Data Analysis for the Laboratory and Chemical Plant; John Wiley & Sons Ltd.: City, England, 2003.
31. Martens, H.; Naes, T.; Multivariate Calibration; John Wiley & Sons: Chichester, UK, 1989.
32. Thomas, E. V.; Anal. Chem.1994, 66, 795A.
33. International Conference on Harmonization of Technical Requirements for the Registration of Pharmaceuticals for Human Use (ICH); Guideline Q2 (R1) - Validation of Analytical
Procedures: Text and Methodology; ICH Secretariat, c/o
IFPMA: Geneva, 2005.
34. Olivieri, A. C.; Goicoechea, H. C.; Iñón, F. A.; Chemom. Intell. Lab. Syst.2004, 73, 189.
35. The British Pharmacopoeia, British Pharmacopoeia Commission, Her Majesty’s Stationery Office: London, UK, 2007.
36. U.S. Department of Health and Human Services, Food and Drug Administration, Center for Drug Evaluation and Research (CDER); Dissolution Testing of Immediate Release Solid Oral
Dosage Forms; Guidance for Industry; U.S. Government
Printing Office: Washington, DC, 1997. Available at http://www. fda.gov/Drugs/GuidanceComplianceRegulatoryInformation/ Guidances/ucm200707.htm, accessed in September 2016. 37. Claro de Souza, M.; Maldonado Marchetti, J.; Adv. Powder
Technol.2012, 23, 801.
38. Del Castillo, E.; Process Optimization:A Statistical Approach; Springer: Heidelberg, 2007, p. 99.
39. Culzoni, M. J.; De Zan, M. M.; Robles, J. C.; Mantovani, V. E.; Goicoechea, H. C.; J. Pharm. Biomed. Anal.2005, 39, 1068.