of
resveratrol and quercetin in red wines
Letícia Flores da Silva(1), Celito Crivellaro Guerra(1),
Ana Beatriz Costa Czermainski(1), Leonardo Ferrari(2) and Ana Maria Bergold(3)
(1)Embrapa Uva e Vinho, Rua Livramento, no 515, CEP 95700-000 Bento Gonçalves, RS, Brazil. E-mail: [email protected],
[email protected], [email protected] (2)Instituto Federal de Educação, Ciência e Tecnologia do Rio Grande do Sul, Campus
Bento Gonçalves, Avenida Osvaldo Aranha, no 540, CEP 95700-000 Bento Gonçalves, RS, Brazil. E-mail: [email protected] (3)Universidade Federal do Rio Grande do Sul, Faculdade de Farmácia, Laboratório de Química Farmacêutica, Avenida Ipiranga, no 2.752,
CEP 90610-000 Porto Alegre, RS, Brazil. E-mail: [email protected]
Abstract – The objective of this work was to validate a fast method with low-solvent use, for the analysis of trans-resveratrol and quercetin in red wines. The wines were prepared, using a classical method, from the grape (Vitis vinifera) cultivars Cabernet Franc, Cabernet Sauvignon, Malbec, Merlot, Petit Verdot, Pinot Noir, Ruby Cabernet, Syrah, Tannat, and Tempranillo. Samples were filtered and analyzed by high-pressure liquid chromatography (HPLC) with a diode array detector (DAD), at 306 and 371 nm, for trans-resveratrol and quercetin, respectively. An octylsilane column was used, and the mobile phase was composed by a gradient of methanol, water, and formic acid. The method was validated according to the following figures of merit: specificity, linearity, limit of detection, limit of quantification, precision, accuracy, and robustness. The proposed HPLC-DAD method may be established for the analysis of trans-resveratrol and quercetin in red wines.
Index terms: Vitis vinifera, high-pressure liquid chromatography, polyphenol, quantification.
Validação de método cromatográfico para análises de rotina
de
trans
-resveratrol e quercetina em vinhos tintos
Resumo – O objetivo deste trabalho foi validar um método rápido, com baixo consumo de solventes, para a análise de trans-resveratrol e quercetina em vinhos tintos. Os vinhos foram elaborados por método clássico, a partir das cultivares de uva (Vitis vinifera) Cabernet Franc, Cabernet Sauvignon, Malbec, Merlot, Petit Verdot, Pinot Noir, Ruby Cabernet, Syrah, Tannat e Tempranillo. As amostras foram filtradas e analisadas por cromatografia líquida de alta eficiência (CLAE) com detector de arranjo de diodos (DAD), em 306 e 371 nm, quanto ao trans-resveratrol e à quercetina, respectivamente. Utilizou-se uma coluna octilsilano, e a fase móvel foi composta por um gradiente de metanol, água e ácido fórmico. O método foi validado de acordo com as seguintes figuras de mérito: especificidade, linearidade, limite de detecção, limite de quantificação, precisão, exatidão e robustez. O método CLAE-DAD proposto pode ser implantado para análises de trans -resveratrol e quercetina em vinhos tintos.
Termos para indexação: Vitis vinifera, cromatografia líquida de alta eficiência, polifenol, quantificação.
Introduction
Polyphenols from grapes and wines, such as
trans-resveratrol and quercetin, show a great biological activity and are of interest to medicine, nutrition, and
related fields (Ribéreau-Gayon, 2006; Flamini et al.,
2013). For this reason, both polyphenols are the most researched ones in viticulture and enology, which involves different wine cultivars, edaphoclimatic factors, production regions or technologies for wine
elaboration (Baptista et al., 2001; Malovaná et al., 2001;
Careri et al., 2003; Monagas et al., 2005; Pereira et al., 2010; Aznar et al., 2011; Fontana & Bottini, 2014).
A great limitation of chemical analysis for the
detection and quantification of these compounds is
that wines are complex samples, mainly due to the diversity and the high levels of organic compounds
(Guerra, 2010; Delcambre & Saucier, 2013).
Considering these factors, the selective instrumental methods, like the high-performance liquid chromatography (HPLC), are basic to perform
polyphenols in wines (Baptista et al., 2001; Malovaná et al., 2001; Careri et al., 2003; Monagas et al., 2005; Ribéreau-Gayon, 2006; Pereira et al., 2010; Aznar et al., 2011; Fontana & Bottini, 2014). Besides this
technique, there is a more advanced technology in this equipment line, which is the ultra-performance liquid chromatography (UPLC) that may be associated to a diode array detector (DAD) (Silva et al., 2011) or to
mass spectrometry (Ignat et al., 2011; Vrhovsek et al.,
2012). However, the UPLC equipment is not available in many laboratories worldwide (Pereira et al., 2010),
including those related to enology in Brazil, as this is an expansion field in this country.
The scarcity of publications with specific assays for polyphenols in Brazilian wines indicates that most of
the evaluations have been performed by generic and nonselective techniques, such as the determination of total polyphenols in ultraviolet-absorption
spectrophotometers (UV) (Ribéreau-Gayon, 2006;
Ignat et al., 2011). Hence, the use of HPLC-DAD, which is a more accessible technique than UPLC, and more reliable than UV, would enable the development of
strategies to advance the quality of Brazilian products.
One of the drawbacks of HPLC-DAD is that most of the methods for simultaneous analysis of trans -resveratrol and quercetin are time consuming, taking longer than 30 min to promote the separation of a variety of compounds with high-chemical similarity (Baptista
et al., 2001; Malovaná et al., 2001; Careri et al., 2003; Monagas et al., 2005; Pereira et al., 2010; Fontana &
Bottini, 2014). The possible reason for this high-time taking is the simultaneous analysis of trans-resveratrol, quercetin, and other bioactive polyphenol markers in red wines. In many of these cases, even the sample preparation requires a laborious and costly procedure
(Baptista et al., 2001; Malovaná et al., 2001; Monagas et al., 2005; Ignat et al., 2011; Fontana & Bottini, 2014;
Silva et al., 2017b). However, it has been observed that when the goal is the exclusive determination of trans -resveratrol and quercetin, the time of analysis can be greatly reduced, and the sample manipulation can be
simplified, maintaining the results trustable.
Besides the practicality, these optimizations in the
technique of analysis allow of the reduction of the mobile phase (MF) volume, the costs, and the generation of
chemical residues (Tobiszewski & Namiésnik, 2012).
The HPLC-DAD methods published to date do not simultaneously consider the ideal characteristics of
trans-resveratrol and quercetin analysis in Brazilian
oenological laboratories, such as: speed of analysis, practicality in the preparation of samples, validation according to Anvisa (2003) requirements, and the
application in red wine samples (Baptista et al., 2001; Malovaná et al., 2001; Careri et al., 2003; Monagas et al., 2005; Ribéreau-Gayon, 2006; Pereira et al., 2010; Aznar et al., 2011; Fontana & Bottini, 2014).
The objective of this work was to validate a fast method with low-solvent use, for the analysis of trans -resveratrol and quercetin in red wines.
Materials and Methods
Analytical standards (purity ≥ 90.0%) of
trans-resveratrol, quercetin, and their possible
interferences present in wines (trans
-resveratrol-3-b-D-glucopyranoside, myricetin, kaempferol, and quercetin-3-O-glycoside) were purchased from Sigma-Aldrich (St. Louis, MO, USA). Stock solutions of each standard (200 mg L-1) were prepared using 50% v/v
methyl alcohol (MeOH) as diluent. Cis-resveratrol was obtained by exposing trans-resveratrol (200 mg L-1) to
direct sunlight (Baptista et al., 2001; Castellari et al., 2002; Monagas et al., 2005) for 48 hours. The solutions
for the method validation were prepared from the stock
solution, as described in the following merit figures.
As a diluent of these solutions, a synthetic wine was adapted from Malovaná et al. (2001), which was
composed of: ethyl alcohol 12% v/v, 5.5 g L-1L-tartaric
acid, and pH 3.5 adjusted with 1 mol L-1 sodium
hydroxide.
Acetonitrile (ACN), MeOH, formic acid (FA), and
L-tartaric acid were suitable for HPLC (Sigma-Aldrich,
St. Louis, MO, USA). Ethyl alcohol, sodium hydroxide,
and hydrochloric acid were analytical grade (Merck,
Darmstadt, Germany). The solutions were prepared
with ultrapure water Milli-Q (Millipore, Billerica, MA, USA). All MF were previously degassed for 10 min, using a T50 ultrasound (Thornton, Porto Alegre,
RS, Brazil), a CL vacuum pump (Fanem, São Paulo, SP, Brazil), and manual agitation.
The preparation of each solution for analysis in
HPLC-DAD (Shimadzu, Kyoto, Japan) consisted of 2 mL filtration through a polyvinylidene fluoride (PVDF) membrane with 0.45 μm pores (Millipore).
LC-10AD pumps, and hand-held injector (Rheodyne,
Bensheim, Germany).
Data were obtained and analyzed using the Class-VP application, version 6.12 (Shimadzu, Kyoto, Japan). The methods of Kerem et al. (2004) and Malovaná et al.
(2001) were references for the selection of organic MF
(MeOH or ACN, and 0.1% v/v FA as additive), column (octylsilane “C8”, or octadecylsilane “C18” stationary
phases), and organic MF gradient (starting in 0, 30,
and 50%, with a maximum of 70% v/v). The tested columns were: C8 – 4.6 x 150 mm, 5 μm particles, 100
Å pores (VertiSep UPS, Vertical, Muang, Nonthaburi,
Thailand); C8 – 4.6 x 150 mm, 5 μm particles, 100 Å pores, 5 C8 (ACE, Aberdeen, Craibstone, Scotland); and C18 – 4.6 x 150 mm, 5 μm particles, 120 Å pores
(ODS Hypersil, Thermo, Waltham, MA, USA).
The appropriate merit figures for the validation
of analytical methods were evaluated according to the following technical descriptions and acceptance
limits of Anvisa (2003): specificity, linearity, limits of detection, quantification, precision, accuracy, and
robustness. The 'Merlot' samples 1 and 2, from the 2012
harvest in the state of Rio Grande do Sul, were used
as a matrix model for validation. SAS/STAT software was applied for data analyses and for the obtention of
estimates of these merit figures (SAS Institute Inc.,
Cary, NC, USA).
Specificity was assessed by analyzing the
polyphenols that could interfere with the method, including cis-resveratrol. In addition, the trans -resveratrol and quercetin standards were subjected to stress condition by acid hydrolysis, in order to obtain possible degradation products (Anvisa, 2003).
Solutions were analyzed in triplicate. To this end, the
standard solution (20 mg L-1 of each) was mixed with
an equal volume of 0.1% v/v hydrochloric acid (pH 1.8)
and exposed to 30 min ultrasound. For each of these
specificity assays, the chromatograms were evaluated
by DAD (Anvisa, 2003), and the results were compared to an integral standard solution.
An additional specificity assay was performed by analyzing the stability of the analytes against the
storage conditions of the 'Merlot' samples (1 and 2), which were stored in microtubes at -20 °C for 21 months. Besides, an attempt was made to concentrate the analytes in the sample by heating, adapting the method proposed by Monagas et al. (2005), by using a rotary evaporator at 30 °C. For this, the thermolability
was investigated by evaporation of 5 mL of each sample until dryness in a water bath (50°C), followed by reconstitution of the residue in 1 mL of the same diluent used for the analytical standards.
Variance analysis of the obtained area integrations to construct the standard curves in three different days was used to evaluate the linearity of the method. Standard curves were constructed with solutions containing 2.0, 10.0, 15.0, 25.0, and 35.0 mg L-1 of each
analyte. The correlation coefficient (r) and the equation
of the line for each standard were determined by linear regression using the method of least squares. In addition, the standard curves were determined over two years by control charts, in order to monitor the intercept and slope values corresponding to each analyte.
The acceptance limit was the mean±2σ (standard
deviation) of the obtained values.
Limits of detection and quantification were estimated
from linearity data, such as the mean standard deviation of the intercept of three standard curves and the linear
correlation coefficient (Anvisa, 2003).
For the precision and accuracy tests, three levels of
trans-resveratrol and quercetin standards were added
to the 'Merlot' 2 sample: low (10 mg L-1), medium
(15 mg L-1), and high (25 mg L-1). The precision,
expressed in terms of coefficient of variation (CV%), was calculated based on the quantifications of six injections of these samples fortified with standards in
HPLC-DAD. To evaluate the accuracy, the effect of the
matrix in each fortified wine was verified by means of recovery calculations (%) of the added standard.
Robustness was investigated by the evaluation of small variations in the chromatographic conditions most susceptible to changes (Anvisa, 2003). Thus, the
MF composition of 0.10% v/v was modified to 0.09 and 0.11% v/v of FA. Another tested modification was in the mark of the reverse phase column C8 used in the
validation, that is, the Vertical column was changed by
the ACE one.
After validation, the method was evaluated by the analysis of 12 experimental wine samples, which were
elaborated by the classical method (Guerra, 2010) from
grapes (Vitis vinifera L.) of red wine grape cultivars – Cabernet Franc, Cabernet Sauvignon, Malbec, Merlot, Petit Verdot, Pinot Noir, Ruby Cabernet, Syrah, Tannat, and Tempranillo – of the 2012 harvest, in the state of
were 'Merlot' (1 and 2), two were 'Petit Verdot' (1 and 2), and one sample of each of the other cultivars.
Peaks of trans-resveratrol and quercetin were
identified in the chromatograms of the samples, by
comparing the retention times (RT) and spectra in the
ultraviolet (UV) region with the respective standards.
Quantification was performed by determining the
peak areas of the analytes.
Results and Discussion
In the development phase of the HPLC-DAD method, a MF composed by MeOH showed suitable values (FDA, 1994) for resolution (> 2.0), and peak
asymmetry (≤ 2.0), while the use of ACN resulted in asymmetry higher than 2.0. The C8 phase columns provided a shorter elution time than the C18 column,
without affecting the resolution and the asymmetry.
The organic MF starting at 50% provided the shortest analysis time (10 min), in comparison to 0 and 30% v/v
(15 min). Therefore, the most suitable chromatographic parameters according to resolution and peak asymmetry, associated to the shortest analysis time, were obtained with the chromatographic conditions for the developed method (Table 1). The proposed HPLC-DAD method is fast, with the chromatogram obtained in only ten minutes, while others previously established for analysis of polyphenols take times longer than 30
min (Baptista et al., 2001; Malovaná et al., 2001; Careri et al., 2003; Monagas et al., 2005; Pereira et al., 2010; Fontana & Bottini, 2014). This time reduction of the
analysis was due to the exchange of the traditionally
used column C18 by another with a somewhat more polar (C8) stationary phase, as well as by the use of a
gradient with a high proportion of organic MF at the
beginning of the method (MeOH 50% v/v).
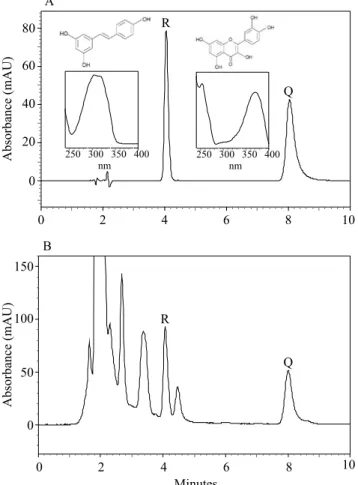
The wavelengths (nm) for the detection of each analyte (10 mg L-1) were set according to the maximum
wavelengths (λmax) obtained for each standard
individually, without interferences of the neighboring peaks and the standard diluent (Figure 1 A). Thus,
the λmax of 306 and 371 nm were established for the
quantifications of trans-resveratrol and quercetin, respectively.
The RT were about 4.1 (trans-resveratrol) and 8 min
(quercetin), which are lower than those reported in the
literature (Baptista et al., 2001; Malovaná et al., 2001; Careri et al., 2003; Monagas et al., 2005; Pereira et al., 2010; Aznar et al., 2011; Fontana & Bottini, 2014; Silva
et al., 2017a). Peaks of trans-resveratrol and quercetin of the 'Merlot' 2 sample showed an adequate separation, allowing of the integration of their areas (Figure 1 B). The red wines showed several more intense peaks which are probably from other polyphenols at high
concentration, such as anthocyanins (Ribéreau-Gayon et al., 2006; Guerra, 2010).
Polyphenols with chemical characteristics similar to
trans-resveratrol (cis-resveratrol and trans
-resveratrol-3-b-D-glucopyranoside) and quercetin (myricetin, kaempferol, and quercetin-3-O-glycoside), as well as the degradation products did not interfere with the peaks of interest (Table 2). The elution order of the analytes and interfering compounds was the same as that obtained
by other authors (Baptista et al., 2001; Castellari et al., 2002; Wang et al., 2002). The acid hydrolysis products
had lower RT than the analytes, therefore, they are more
polar than their precursors and did not interfere in their analysis (Table 2). The chemical stability of analytes in acid medium was not determined in previous studies
(Baptista et al., 2001; Malovaná et al., 2001; Careri et al., 2003; Monagas et al., 2005; Pereira et al., 2010; Fontana & Bottini, 2014).
Table 1. Analytical conditions adopted for the determination of trans-resveratrol and quercetin in red wines.
Condition Description
Precolumn C8 (Phenomenex)
Column C8 VertiSep UPS (Vertical), 4.6 x 150 mm, 5 mm particle and 100 Å pores Mobile phase A Formic acid 0.10% v/v, diluted in ultrapure water
Mobile phase B Formic acid 0.10% v/v, diluted in MeOH
Gradient Linear, with mobile phase A concentrations: 50% v/v from 0 to 5 min; 30% v/v from 7 to 8 min; 50% v/v from 9 to 10 min
Injection volume 20 mL
Flow rate 1.0 mL min-1
In the evaluation of the analyte stabilities at -20°C,
the chromatographic profile was not altered and the analytes were reduced to acceptable levels of ±15%
(Table 3) (Anvisa, 2003). These results indicate that
the storage of samples in freezer is adequate within the
evaluated period. However, another study investigated the stability of trans-resveratrol in MeOH solution at
-20°C, and it determined a maximum time of five days
for stock under these conditions (Wang et al., 2002). Ideally, each laboratory should carry out the stability tests, in order to establish the best conditions for storage and preparation of the samples.
The samples showed low values of recovery when subjected to 50ºC (Table 3). This indicates that this method for concentrating samples through heating
is not adequate. In addition, a high CV% was found, justified by the excessive handling of the samples
and by the need to reconstitute the obtained residues in the diluent. Monagas et al. (2005) carried out the concentration of polyphenols in wines by a rotary evaporator at 30ºC. Considering that rotary evaporator is not always available in laboratories, and complying with the purpose of providing a simple possible method, this method was disregarded in this study.
The method showed linearity in the range from 2.0 to 35.0 mg L-1 for each analyte, with correlation
coefficients above 0.99 (Table 3). The analysis of variance showed the high significance of the
linear regression effect (p<0.01), and that there was
no significant deviation from linearity (p>0.10).
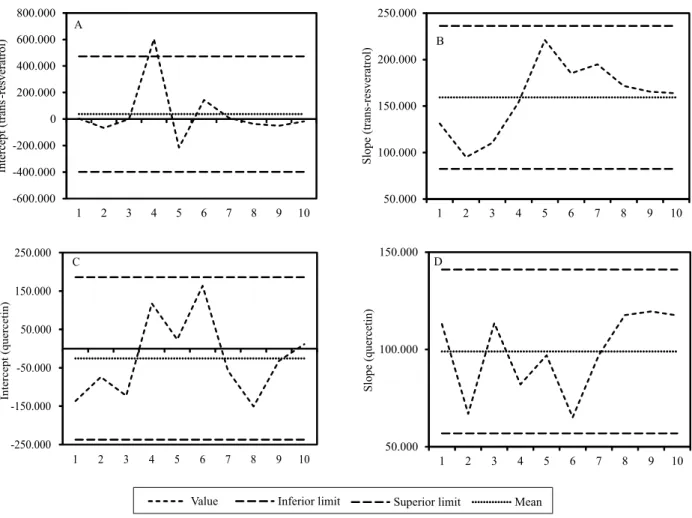
Regression residual analysis indicated that there was no transgression to the simple linear model. For most of the standard curves used in the control chart (1 to 10), the slope and intercept values corresponding to the equation of the line of each analyte were kept within
normal limits, mean±2σ (Figure 2). Only one point
was out of limits, which can be observed in the trans -resveratrol intercept (curve 4, Figure 2 A). For this reason, laboratories can use tools like control charts to follow the standard curves, especially in exchange cases of equipment, analysts, and chemicals. In this way, it is possible to identify possible laboratory errors related to the standard curve. The control chart data can be used as research aid, in case of results from
areas outside the specification, as indicated by the FDA (2006) and Kuselman et al. (2012).
The limits of detection and quantification were
determined and were lower than the levels usually found (0 to 6.5 mg L-1 for trans-resveratrol, and 0
to 8.84 mg L-1 for quercetin), mainly for red wines
(Baptista et al., 2001; Malovaná et al., 2001; Careri et al., 2003; Monagas et al., 2005; Guerra et al., 2008;
Figure 1. Chromatograms at 340 nm, obtained by HPLC-DAD method for: standard solution of trans-resveratrol (R) and quercetin (Q), at 10 mg L-1 concentration, with their respective chemical structures and UV spectra (A), and 'Merlot' 2 red wine (B). mAU, milli-absorbance units.
Table 2. Evaluation of possible interferers in the
HPLC-DAD method for the analysis of trans-resveratrol and quercetin in red wines.
Possible interferer RT
(min)
λmax
(nm) Stilbenes
Trans-resveratrol-3-β-D-Glucopyranoside 2.6 306
Cis-resveratrol 8.6 285
Flavonols
Myricetin 4.5 374
Kaempferol 9.3 365
Quercetin-3-O-glucoside 3.5 354
Acid hydrolysis - trans-resveratrol 3.6 306
Pereira et al., 2010; Silva et al., 2011; Vrhovsek et al., 2012; Fontana & Bottini, 2014).
According to CV% values (less than 15%), the
method was considered accurate (Table 3). Accuracy
was shown by recoveries between 85 and 115%,
indicating that the matrix does not interfere with the developed methodology.
The method was also robust as for the changes in the concentration of FA in the MF and in the column
mark, since the peaks did not change significantly (CV <5.0%) for their RT and areas (Table 3). The pH of
the original MF (0.1% v/v FA) was 3.19, and underwent a slight variation in the concentrations of 0.09% v/v (pH = 3.30) and 0.11% v/v (3.10).
The results obtained for the merit figures evaluated
for this HPLC-DAD method were in agreement with the acceptable limits (Anvisa, 2003). Most of the previous studies did not show or perform a partial validation
(Malovaná et al., 2001; Castellari et al., 2002; Kerem et al., 2004; Monagas et al., 2005; Pereira et al., 2010; Aznar et al., 2011). Baptista et al. (2001), Careri et al.
(2003), and Silva et al. (2017a) validated a method by
HPLC-DAD; however, these authors applied it for 60, 35, and 30 min, respectively. Fontana & Bottini (2014)
and Silva et al. (2017b) validated a method by HPLC-DAD which requires a complex sample preparation. Silva et al. (2011), Silva et al. (2017b), and Vrhovsek
et al. (2012) validated methods for assaying various polyphenols in wines using the UPLC equipment.
For each analyte peak of most red wines, a purity
greater than 95% was found, which reduces the
possibility of coelution with other compounds. An exception was observed for wines of the cultivars Syrah, Tempranillo, and Petit Verdot, with a peak purity of
90–95% for trans-resveratrol. Therefore, if purity peaks
less than 90% are observed, it is advisable to use a longer
run-time method to promote a better separation between
the analyte and interferers (Kazakevich & Lobrutto,
2007). It is possible, then, to ensure compliance with the selectivity requirements recommended by regulatory agencies (Anvisa, 2003). The twelve red wines showed variations for the contents of the polyphenolic compounds (Figure 2). The values varied according to the expected
ones for the analyzed cultivars (Guerra et al., 2008).
For wines, the levels of trans-resveratrol varied from
2.46 to 15.88 mg L-1, and those of quercetin from 3.85
to 26.51 mg L-1 (Figure 3). These results were similar
or superior to those obtained in previous studies on red wines from several regions worldwide (Baptista et al.,
2001; Careri et al., 2003; Monagas et al., 2005; Pereira et al., 2010; Silva et al., 2011; Vrhovsek et al., 2012; Fontana & Bottini, 2014). A higher concentration of quercetin (38.55 mg L-1) was found in samples of wines from the
Canary Islands (Malovaná et al., 2001). The samples of 'Pinot Noir' and 'Merlot' 2 showed high values of the two
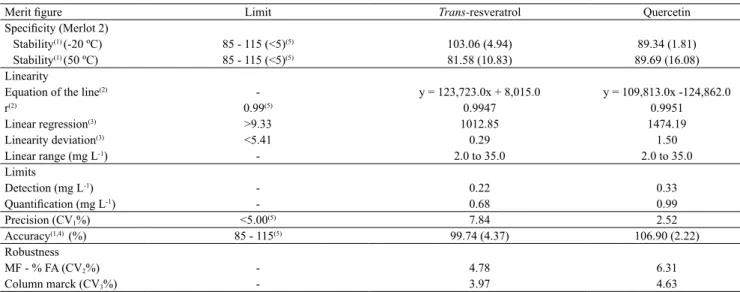
Table 3. Merit figures of the chromatographic method (HPLC-DAD) for analysis of trans-resveratrol and quercetin in red wines.
Merit figure Limit Trans-resveratrol Quercetin
Specificity (Merlot 2)
Stability(1) (-20 ºC) 85 - 115 (<5)(5) 103.06 (4.94) 89.34 (1.81)
Stability(1) (50 ºC) 85 - 115 (<5)(5) 81.58 (10.83) 89.69 (16.08)
Linearity
Equation of the line(2) - y = 123,723.0x + 8,015.0 y = 109,813.0x -124,862.0
r(2) 0.99(5) 0.9947 0.9951
Linear regression(3) >9.33 1012.85 1474.19
Linearity deviation(3) <5.41 0.29 1.50
Linear range (mg L-1) - 2.0 to 35.0 2.0 to 35.0
Limits
Detection (mg L-1) - 0.22 0.33
Quantification (mg L-1) - 0.68 0.99
Precision (CV1%) <5.00(5) 7.84 2.52
Accuracy(1,4) (%) 85 - 115(5) 99.74 (4.37) 106.90 (2.22)
Robustness
MF - % FA (CV2%) - 4.78 6.31
Column marck (CV3%) - 3.97 4.63
(1)Average (%) and CV% calculated for recovery (n = 3). (2)Calculated from standard solutions analyzed over the same sample period (curves 1, 2, and 3
of Figure 3). (3)Analysis of variance (p = 0.01). (4)Calculated for 'Merlot' 2 wine at low (10 mg L-1), medium (15 mg L-1) and high (25 mg L-1) concentration
Figure 3. Mean and standard veviation of trans-resveratrol and quercetin contents for samples of red wines made with grapes from the 2012 harvest in the state of Rio Grande do Sul.
-600.000 -400.000 -200.000 0 200.000 400.000 600.000 800.000
1 2 3 4 5 6 7 8 9 10
Intercept (trans
-resveratrol)
A
-250.000 -150.000 -50.000 50.000 150.000 250.000
1 2 3 4 5 6 7 8 9 10
Intercept (quercetin)
C
50.000 100.000 150.000
1 2 3 4 5 6 7 8 9 10
Slope (quercetin)
D 50.000 100.000 150.000 200.000 250.000
1 2 3 4 5 6 7 8 9 10
Slope (trans
-resveratrol)
B
Value Inferior limit Superior limit Mean
analytes, in contrast to 'Malbec' (Figure 3). Analyses of a greater number of samples of these cultivars are required to verify if these contents are typical of the region under study.
Conclusions
1. The method developed by HPLC-DAD is suitable for the analysis of trans-resveratrol and quercetin in red wines.
2. This HPLC-DAD method is faster and generates less volume of chemical residues than those available
in the scientific literature.
Acknowledgments
To our colleagues Magda Beatris Gatto Salvador and Celso Guarani Ruiz de Oliveira, for their support in the management of Lacem-Embrapa; to Gisele Eliane Perissutti, from the Laboratório de Enoquímica Laeno-Embrapa, for the classical analyses; and to Raul Luiz Ben and to Anevir Marin, for the experimental vinifications.
References
ANVISA. Agência Nacional de Vigilância Sanitária. Resolução-RE nº 899, de 29 de maio de 2003. [Guia para validação de métodos analíticos e bioanalíticos]. Diário Oficial da União, 2 jun. 2003. Seção 1, p.56-59.
AZNAR, O.; CHECA, A.; OLIVER, R.; HERNÁNDEZ-CASSOU, S.; SAURINA, J. Determination of polyphenols in wines by liquid chromatography with UV spectrophotometric detection. Journal of Separation Science, v.34, p.527-535, 2011. DOI: 10.1002/jssc.201000816.
BAPTISTA, J.A.B.; TAVARES, J.F. da P.; CARVALHO, R.C.B. Comparison of polyphenols and aroma in red wines from Portuguese mainland versus Azores Islands. Food Research
International, v.34, p.345-355, 2001. DOI:
10.1016/S0963-9969(00)00174-5.
CARERI, M.; CORRADINI, C.; ELVIRI, L.; NICOLETTI, I.; ZAGNONI, I. Direct HPLC analysis of quercetin and trans-resveratrol in red wine, grape, and winemaking byproducts.
Journal of Agricultural and Food Chemistry, v.51,
p.5226-5231, 2003. DOI: 10.1021/jf034149g.
CASTELLARI, M.; SARTINI, E.; FABIANI, A.; ARFELLI, G.; AMATI, A. Analysis of wine phenolics by high-performance liquid chromatography using a monolithic type column. Journal
of Chromatography A, v.973, p.221-227, 2002. DOI: 10.1016/
S0021-9673(02)01195-0.
DELCAMBRE, A.; SAUCIER, C. High-throughput oenomics: shotgun polyphenomics of wines. Analytical Chemistry, v.85,
p.9736-9741, 2013. DOI: 10.1021/ac4021402.
FDA. Food and Drug Administration. Guidance for
industry: bioanalytical method validation. 2001. Available
at: ˂http://www.fda.gov/downloads/Drugs/Guidance ComplianceRegulatoryInformation/Guidances/ucm070107.pdf˃. Accessed on: Jan. 5 2016.
FDA. Food and Drug Administration. Guidance for industry: investigating out-of-specification (OOS) test results for pharmaceutical production. 2006. Available at: ˂http://www.fda. gov/downloads/Drugs/.../Guidances/ucm070287.pdf˃. Accessed on: Sept. 24 2015.
FDA. Food and Drug Administration. Reviewer guidance: validation of chromatographic methods. 1994. Available at: ˂http://www.fda.gov/downloads/Drugs/Guidances/ UCM134409. pdf˃. Accessed on: Sept. 9 2016.
FLAMINI, R.; MATTIVI, F.; DE ROSSO, M.; ARAPITSAS, P.; BAVARESCO, L. Advanced knowledge of three important classes of grape phenolics: anthocyanins, stilbenes and flavonols.
International Journal of Molecular Sciences, v.14,
p.19651-19669, 2013. DOI: 10.3390/ijms141019651.
FONTANA, A.R.; BOTTINI, R. High-throughput method based on quick, easy, cheap, effective, rugged and safe followed by liquid chromatography-multi-wavelength detection for the quantification of multiclass polyphenols in wines. Journal of Chromatography A, v.1342, p.44-53, 2014. DOI: 10.1016/j.chroma.2014.03.044. GUERRA, C.C. Vinho tinto. In: VENTURINI FILHO, W.G. (Coord.). Bebidas alcoólicas: ciência e tecnologia. São Paulo:
Blucher, 2010. v.1, p.209-233. (Série Bebidas).
GUERRA, C.C.; ZUCOLOTTO, M.; TONIETTO, J. Profil chimique et sensoriel de vins rouges brésiliens selon le cépage et l’origine géographique des vignobles. In: CONGRÈS INTERNATIONAL DES TERROIRS VITICOLES, 7., 2008, Nyon, Suisse. Comptes rendus. Pully: Agroscope Changins Wädenswill, 2008. p.493-499.
IGNAT, I.; VOLF, I.; POPA, V.I. A critical review of methods for characterisation of polyphenolic compounds in fruits and vegetables. Food Chemistry, v.126, p.1821-1835, 2011. DOI:
10.1016/j.foodchem.2010.12.026.
KAZAKEVICH, Y.; LOBRUTTO, R. (Ed.). HPLC for pharmaceutical scientists. New Jersey: J. Wiley & Sons, 2007.
1140p. DOI: 10.1002/0470087951.
KEREM, Z.; BRAVDO, B.; SHOSEYOV, O.; TUGENDHAFT, Y. Rapid liquid chromatography-ultraviolet determination of organic acids and phenolic compounds in red wine and must. Journal of
Chromatography A, v.1052, p.211-215, 2004. DOI: 10.1016/j.
chroma.2004.08.105.
KUSELMAN, I.; PENNECCHI, F.; BURNS, C.; FAJGELJ, A.; ZORZI, P. IUPAC/CITAC Guide: investigating out-of-specification test results of chemical composition based on metrological concepts (IUPAC Technical Report). Pure Applied
Chemistry, v.84, p.1939-1971, 2012. DOI:
MALOVANÁ, S.; MONTELONGO, F.J.G.; PÉREZ, J.P.; RODRÍGUEZ-DELGADO, M.A. Optimisation of sample preparation for the determination of trans-resveratrol and other polyphenolic compounds in wines by high performance liquid chromatography. Analytica Chimica Acta, v.428, p.245-253,
2001. DOI: 10.1016/S0003-2670(00)01231-9.
MONAGAS, M.; SUÁREZ, R.; GÓMEZ-CORDOVÉS, C.; BARTOLOMÉ, B. Simultaneous determination of nonanthocyanin phenolic compounds in red wines by HPLC-DAD/ESI-MS. American Journal of Enology and Viticulture, v.56, p.139-147, 2005.
PEREIRA, V.; CÂMARA, J.S.; CACHO, J.; MARQUES, J.C. HPLC-DAD methodology for the quantification of organic acids, furans and polyphenols by direct injection of wine samples.
Journal of Separation Science, v.33, p.1204-1215, 2010. DOI:
10.1002/jssc.200900784.
RIBÉREAU-GAYON, P.; GLORIES, Y.; MAUJEAN, A.; DUBOURDIEU. D. Handbook of enology: the chemistry of wine stabilization and treatments. 2nd ed. Chichester: J. Wiley & Sons,
2006. v.2, 441p. DOI: 10.1002/0470010398.fmatter.
SILVA, C.L.; PEREIRA, J.; WOUTER, V.G.; GIRÓ, C.; CÂMARA, J.S. A fast method using a new hydrophilic–lipophilic balanced sorbent in combination with ultra-high performance liquid chromatography for quantification of significant bioactive metabolites in wines. Talanta, v.86, p.82-90, 2011. DOI: 10.1016/j.
talanta.2011.08.007.
SILVA, L.F. da; GUERRA, C.C.; FORESTI, A.; BERGOLD, A.M. Verification of the selectivity of a liquid chromatography method for determination of stilbenes and flavonols in red wines by mass spectrometry. Chemical Papers, v.71, p.661-672, 2017a. DOI: 10.1007/s11696-016-0066-7.
SILVA, L.F. da; GUERRA, C.C; KLEIN, D.; BERGOLD, A.M. Solid cation exchange phase to remove interfering anthocyanins in the analysis of other bioactive phenols in red wine. Food Chemistry, v.227, p.158-165, 2017b. DOI: 10.1016/j.
foodchem.2017.01.087.
TOBISZEWSKI, M.; NAMIÉSNIK, J. Direct chromatographic methods in the context of green analytical chemistry. Trends
in Analytical Chemistry, v.35, p.67-73, 2012. DOI: 10.1016/j.
trac.2012.02.006.
VRHOVSEK, U.; MASUERO, D.; GASPEROTTI, M.; FRANCESCHI, P.; CAPUTI, L.; VIOLA, R.; MATTIVI, F. A versatile targeted metabolomics method for the rapid quantification of multiple classes of phenolics in fruits and beverages. Journal
of Agricultural and Food Chemistry, v.60, p.8831-8840, 2012.
DOI: 10.1021/jf2051569.
WANG, Y.; CATANA, F.; YANG, Y.; RODERICK, R.; BREEMEN, R.B. van. An LC-MS method for analyzing total resveratrol in grape juice, cranberry juice, and in wine. Journal
of Agricultural and Food Chemistry, v.50, p.431-435, 2002.
DOI: 10.1021/jf010812u.