Brazilian Journal of Poultry Science Revista Brasileira de Ciência Avícola
ISSN 1516-635X Oct - Dec 2013 / v.15 / n.4 / 339-346
Effect of Different Dietary Concentrations of
Amino Acids on the Performance of Two Different
Broiler Strains
Author(s)
Ebling PDI
Ribeiro AMLI
Trevizan LI
Silva ICM daI
Kessler A de MI
Rubin LLI
I Universidade Federal do Rio Grande do Sul
Mail Adress
Corresponding author e-mail address Department of Animal Science and Animal
Science Graduate Program, Universidade Federal do Rio Grande do Sul, Bento Gonçalves Ave., 7712, Porto Alegre-RS. Email: [email protected]
Keywords
Economic evaluation, Brazilian nutritional programs, carcass yield.
Submitted: July/2012 Approved: July/2013
ABSTRACT
Four Nutritional Programs (NP) used in the Brazilian poultry industry were tested in two broiler strains (Cobb 500 and Ross 308). NP varied in the concentrations of their main essential amino acids (AA) and were classified as Low, Regular, High and Mixed (high AA concentrations up to 21 days and regular concentrations after that). Minimum digestible Met+Cys/Lys, Thr/Lys, Arg/Lys, Ile/Lys, and Val/Lys ratios were 0.74, 0.64, 1.05, 0.65 and 0.75, respectively, in all NP, and no minimum amount of CP was fixed. There were no interactions between strain and NP for any of the evaluated responses. From 1 to 47 days of age, birds fed the Low NP presented lower average body weight and body weight gain (BWG). The high NP allowed for better feed conversion ratio (FCR), followed by the Regular and the Mixed NP. Ross 308 broilers were heavier, presenting worse FCR due to higher FI. Birds fed the High NP had lower carcass yield than those fed the Low NP. The Low and Regular NP had lower costs per WG when compared with the High NP. Low and Regular NP presented higher gross margin returns compared with the High NP. The Regular and Mixed NP are the most recommended, presenting intermediate performance and higher economic returns.
INTRODUCTION
The accuracy in meeting broiler nutritional protein requirement, as well as the search for an ideal profile of amino acids (AA) to obtain the maximum protein utilization of protein has guided the research in this area. New formulation approaches started to be applied when measuring AA in feeds became feasible, allowing the transition from using crude protein values to the use of total AA. Subsequently, feed formulations for poultry and pigs recommended of digestible (dig) AA values, based on the ideal protein concept; this was aided by the development and availability of synthetic AA. On the other hand, the genetic progress of broilers, including gender and strain, can influence the ideal AA ratio needed; any alteration in the proportion of body protein, feathers and maintenance requirements may result in changes in the ideal AA ratios (Hackenhaar & Lemme, 2005).
During the last decades, broiler average daily weight gain increased from 20 to more than 50 g/day, and the market age was reduced from 12 to six weeks (Silva Junior et al., 2002). The improvement of the genetic potential, the demand for further-processed poultry products and the concern on food quality and safety stimulated the interest on the composition and quality of poultry carcasses, particularly on performance traits and low fat (Araújo et al., 2002). In addition
practically satisfies the daily AA demands of human beings (Leeson, 1993).
Due to the contributions that genetic improvements have made to the evolution of the performance of
broilers over the years, it is necessary to keep making adjustments or corrections of the recommended nutritional plans (Gous, 2010). Amino acids must be balanced in the diet to avoid energy loss, which can be
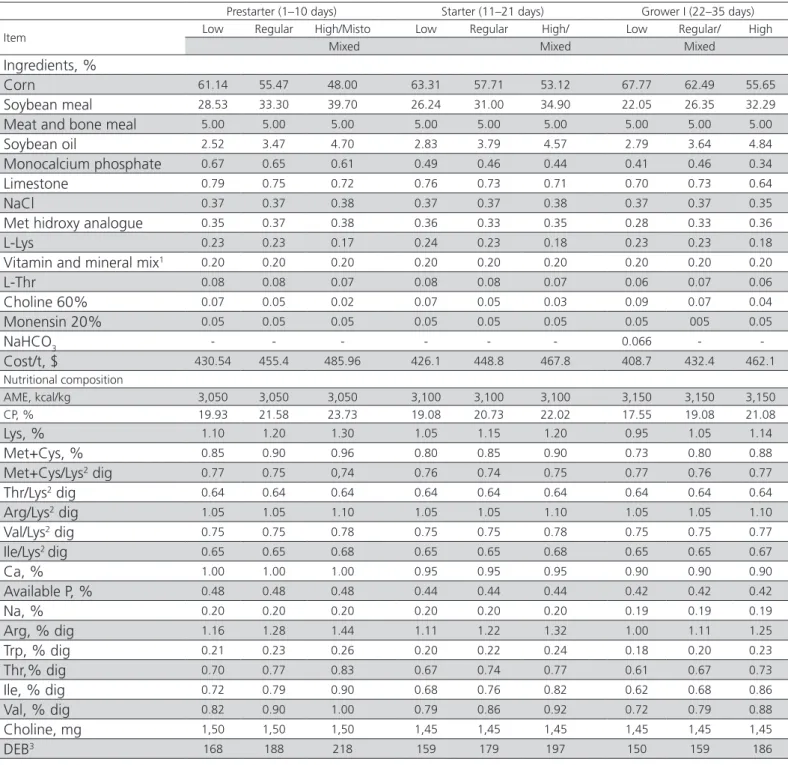
Table 1 – Nutritional composition and ingredients of NP in the prestarter, starter and grower I phases.
Prestarter (1–10 days) Starter (11–21 days) Grower I (22–35 days)
Item Low Regular High/Misto Low Regular High/ Low Regular/ High
Mixed Mixed Mixed
Ingredients, %
Corn 61.14 55.47 48.00 63.31 57.71 53.12 67.77 62.49 55.65
Soybean meal 28.53 33.30 39.70 26.24 31.00 34.90 22.05 26.35 32.29
Meat and bone meal 5.00 5.00 5.00 5.00 5.00 5.00 5.00 5.00 5.00
Soybean oil 2.52 3.47 4.70 2.83 3.79 4.57 2.79 3.64 4.84
Monocalcium phosphate 0.67 0.65 0.61 0.49 0.46 0.44 0.41 0.46 0.34
Limestone 0.79 0.75 0.72 0.76 0.73 0.71 0.70 0.73 0.64
NaCl 0.37 0.37 0.38 0.37 0.37 0.38 0.37 0.37 0.35
Met hidroxy analogue 0.35 0.37 0.38 0.36 0.33 0.35 0.28 0.33 0.36
L-Lys 0.23 0.23 0.17 0.24 0.23 0.18 0.23 0.23 0.18
Vitamin and mineral mix1 0.20 0.20 0.20 0.20 0.20 0.20 0.20 0.20 0.20
L-Thr 0.08 0.08 0.07 0.08 0.08 0.07 0.06 0.07 0.06
Choline 60% 0.07 0.05 0.02 0.07 0.05 0.03 0.09 0.07 0.04
Monensin 20% 0.05 0.05 0.05 0.05 0.05 0.05 0.05 005 0.05
NaHCO3 - - - 0.066 -
-Cost/t, $ 430.54 455.4 485.96 426.1 448.8 467.8 408.7 432.4 462.1
Nutritional composition
AME, kcal/kg 3,050 3,050 3,050 3,100 3,100 3,100 3,150 3,150 3,150
CP, % 19.93 21.58 23.73 19.08 20.73 22.02 17.55 19.08 21.08
Lys, % 1.10 1.20 1.30 1.05 1.15 1.20 0.95 1.05 1.14
Met+Cys, % 0.85 0.90 0.96 0.80 0.85 0.90 0.73 0.80 0.88
Met+Cys/Lys2 dig 0.77 0.75 0,74 0.76 0.74 0.75 0.77 0.76 0.77
Thr/Lys2 dig 0.64 0.64 0.64 0.64 0.64 0.64 0.64 0.64 0.64
Arg/Lys2 dig 1.05 1.05 1.10 1.05 1.05 1.10 1.05 1.05 1.10
Val/Lys2 dig 0.75 0.75 0.78 0.75 0.75 0.78 0.75 0.75 0.77
Ile/Lys2 dig 0.65 0.65 0.68 0.65 0.65 0.68 0.65 0.65 0.67
Ca, % 1.00 1.00 1.00 0.95 0.95 0.95 0.90 0.90 0.90
Available P, % 0.48 0.48 0.48 0.44 0.44 0.44 0.42 0.42 0.42
Na, % 0.20 0.20 0.20 0.20 0.20 0.20 0.19 0.19 0.19
Arg, % dig 1.16 1.28 1.44 1.11 1.22 1.32 1.00 1.11 1.25
Trp, % dig 0.21 0.23 0.26 0.20 0.22 0.24 0.18 0.20 0.23
Thr,% dig 0.70 0.77 0.83 0.67 0.74 0.77 0.61 0.67 0.73
Ile, % dig 0.72 0.79 0.90 0.68 0.76 0.82 0.62 0.68 0.86
Val, % dig 0.82 0.90 1.00 0.79 0.86 0.92 0.72 0.79 0.88
Choline, mg 1,50 1,50 1,50 1,45 1,45 1,45 1,45 1,45 1,45
DEB3 168 188 218 159 179 197 150 159 186
1Mineral mix: 40 mg Fe, 80 mg Zn, 80 mg Mn, 10 mg Cu, 0.7 mg I and 0.3 mg Se per kg of diet. Pre-starter and starter vitamin mix: 10,000 IU vit. A, 3,000 IU vit. D3, 30 mg vit. E, 3
mg vit. K, 3 mg vit. B1, 8 mg vit. B2, 4 mg vit. B6, 0.014 mg vit. 12, 20 mg pantothenic acid, 50 mg niacin, 2 mg folic acid and 0.15 mg biotin per kg of diet. Growing and finishing vitamin mix: 8,000 IU vit. A, 2,000 IU vit. D3, 20 mg vit. E, 2 mg vit. K, 2 mg vit. B1, 6 mg vit. B2, 2.5 mg vit. B6, 0.012 mg vit. B12, 15 mg pantothenic acid, 35 mg niacin, 1 mg folic acid and 0 mg biotin per kg of diet.
2The AA/Lys ratio in the table should be understood as “minimal”.
Ebling PD, Ribeiro AML, Trevizan L, Silva ICM da, Kessler A de M, Rubin LL
Effect of Different Dietary Concentrations of Amino Acids on the Performance of Two Different Broiler Strains
diverted to the synthesis of fat (Leeson et al., 1996). In addition, proper protein balance of diets reduces costs due to higher efficiency of protein utilization, and it also reduces nitrogen excretion in the environment.
Therefore, the aim of this study was to evaluate the effects of four nutritional programs used by the Brazilian poultry industry by varying the concentration of the main essential AA on live performance, carcass yield, and economic parameters of two strains of broilers.
MATERIALS AND METHODS
Birds were reared according to the Brazilian
Federal Law Nº
11794
(2008, October 8th) and the protocols
were approved by
the
Committee Animal Care and Use of Universidade Federal do Rio Grande do Sul.The experiment was conducted in an experimental house, where average minimum and maximum temperatures were 19 and 25 ºC, respectively. A total of 1,344 one-day-old male chicks of two strains Table 2 – Nutritional composition and ingredients of NP in the grower II and finisher phases.
Grower II (35–42 days) Finisher (43–47 days)
Item Low Regular/Mixed High Low Regular/Mixed High
Ingredients, %
Corn 69.60 67.14 60.44 74.63 69.73 63.48
Soybean meal 20.10 22.12 27.78 15.88 20.03 25.30
Meat and bone meal 5.00 5.00 5.00 5.00 5.00 5.00
Soybean oil 3.18 3.55 4.71 2.33 3.13 4.16
Monocalcium phosphate 0.28 0.26 0.23 0.25 0.23 0.20
Limestone 0.65 0.64 0.61 0.65 0.62 0.60
NaCl 0.23 0.28 0.32 0.13 0.23 0.32
Methionine hidroxy analogue 0.27 0.31 0.35 0.25 0.27 0.35
L-Lys 0.22 0.23 0.19 0.21 0,22 0.20
Vitamin and mineral mix1 0.20 0.20 0.20 0.20 0.20 0.20
L-Thr 0.06 0.06 0.06 0.04 0.06 0.06
Choline 60% 0.10 0.09 0.06 0.11 0.10 0.07
Monensin 20% 0.05 0.05 0.05 0.05 0.05 0.05
NaHCO3 0.14 0.06 - 0.27 0.13
-Cost/t, $ 405.8 416.8 446.0 382.9 404.7 433.0
Nutritional composition
AME, kcal/kg 3,200 3,200 3,200 3,200 3,200 3,200
CP, % 16.80 17.55 19.49 15.30 16.80 18.65
Lys, % dig 0.90 0.95 1.05 0.80 0.90 1.00
Met+Cys, % dig 0.70 0.75 0.84 0.65 0.70 0.82
Met+Cys/Lys2 dig 0.78 0.79 0.80 0.81 0.78 0.82
Thr/Lys2, dig 0.64 0.64 0.64 0.64 0.64 0.64
Arg/Lys2, dig 1.05 1.05 1.08 1.05 1.05 1.08
Val/Lys2, dig 0.75 0.75 0.77 0.75 0.75 0.76
Ile/Lys2, dig 0.65 0.65 0.67 0.65 0,65 0.66
Ca, % 0.85 0.85 0.85 0.83 0,83 0.83
Available P, % 0.39 0.39 0.39 0.38 0.38 0.38
Na, % 0.18 0.18 0.18 0.18 0.18 0.18
Arg,% dig 0.95 1.00 1.14 0.85 0.95 1.08
Trp, % dig 0.16 0.17 0.20 0.14 0.16 0.19
Thr, % dig 0.58 0.60 0.67 0.51 0.58 0.64
Ile, % dig 0.58 0.62 0.71 0.52 0.58 0.67
Val, % dig 0.69 0.72 0.81 0.62 0.69 0.77
Choline, mg 1,450 1,450 1,450 1,450 1,450 1,450
DEB3 150 150 167 150 150 157
1Mineral mix: 40 mg Fe, 80 mg Zn, 80 mg Mn, 10 mg Cu, 0.7 mg I and 0.3 mg Se per kg of diet. Grower and finishing vitamin mix: 8,000 IU vit. A, 2,000 IU vit. D3, 20 mg vit. E, 2
mg vit. K, 2 mg vit. B1, 6 mg vit. B2, 2.5 mg vit. B6, 0.012 mg vit. B12, 15 mg pantothenic acid, 35 mg niacin, 1 mg folic acid and 0.08 mg biotin per kg of diet.
2The AA/Lys ratio in the table should be understood as “minimal”.
(Cobb 500 and Ross 308), with 48 and 44 g of initial weight, respectively, were reared in 48 pens (28 birds/ pen) at a density of 11 birds/m2. Chicks derived from
broiler breeders of similar age. Mash feed and water were offered ad libitum, and chicks were submitted
to a 23-h light regimen during the entire experimental period.
Treatments consisted of four Nutritional Programs (NP), in which diets were isocaloric with no minimal fixed CP value; however, they contained different concentrations of essential AA. The NP contained Low, Medium, High, or Mixed concentrations of AA. Mixed NP had high AA concentrations until birds were 21 days, followed by regular concentrations (Tables 1 and 2) until the end of the rearing period. The minimum digestible Met+Cys/Lys, Thr/Lys, Arg/Lys, Ile/Lys, and Val/Lys ratios in all NP were 0.74, 0.64, 1.05, 0.65 and 0.75, respectively. These are the ratios typically used by
the Brazilian poultry industry.
A multiphase feeding regime was applied for all NP, and it was split in five periods: pre-starter (1 to 10 days), starter (11 to 20 days), grower I (21 to 35 days), grower II (36 to 42 days), and finishing (43 to 47 days). Prior to diet formulation, feedstuff AA profile (by high performance liquid chromatography), crude energy and protein were analyzed (AOAC, 2002). The formulated diets were also submitted to the same analyses. Chicken performance was evaluated per period and for the total experimental period relative to body weight (BW), body weight gain (BWG), feed intake (FI) and feed conversion ratio (FCR).On day 47, three average birds from each replicate were slaughtered to measure carcass, breast, and thigh + drumstick yields. Yield was understood as
parts weight or carcass weight without head and feet relative to live weight. Birds were sacrificed by cervical dislocation, followed by scalding, defeathering and evisceration. Carcass parts were cut by a single specialized professional in order to achieve uniformity and precision in the process.
The economic analysis was performed considering feedstuff costs per period multiplied by feed intake during the respective period (feeding cost). This value was divided by 47 days of WG, resulting in cost per kg of BWG. Birds’ BW at 47 days was multiplied by live bird price at the time of calculation, feeding cost was subtracted, resulting in gross margin return, considering all other costs as fixed.
Experimental data were submitted analysis of variance (ANOVA). Means were compared by LS
means using the GLM procedure of
SAS statistical
program (Stat Version, 2009). Data were analyzed
according to a
completely randomized design in a factorial arrangement (4 x 2), resulting in eight treatments with six replicates of 28 birds each. Initial weight, which was used as a covariable in the analysis, was removed from the final model because it was not significant. The statistical model included the effects of NP (Low, Regular, High or Mixed), strain (Cobb 500 or Ross 308) and their interactions on the performance, carcass and parts (breast, thigh + drumstick) yields, and gross margin return.RESULTS AND DISCUSSION
One-day-old Ross 308 chicks were statistically heavier (48 vs. 44 g; p < 0.05) than Cobb 500 chicks, although breeders were about the same age. None of Table 3 – Performance of broiler chickens at 1 to 10 and 11 to 20 days of age in accordance with each NP(1).
Item
BW 1–10, kg
BWG 1–10, kg
FCR 1–10, kg/
kg FI 1–10, kg BW 11–20, kg
BWG 11–20, kg
FCR 11–20,
kg/kg FI 11–20, kg NP
Low 0.294 c 0.248 c 1.25 a 0.310 a 0.920 b 0.626 b 1.630 a 1.02
Regular 0.306 b 0.260 b 1.21 b 0.314 a 0.977 a 0.671 a 1.475 b 0.99
High/Mixed 0.317 a 0.271 a 1.13 c 0.307 b 0.987 a 0.670 a 1.478 b 0.99
P-value 0.0001 0.0001 0.0001 0.0157 0.0001 0.0001 0.0001 0.1312
SEM 0.003 0.002 0.010 0.002 0.006 0.006 0.021 0.012
Strain
Ross 308 0.314 0.266 1.21 0.322 0.992 0.678 1.55 1.05
Cobb 500 0.303 0.259 1.15 0.298 0.943 0.641 1.48 0.95
P-value 0.0001 0.0045 0.0001 0.0001 0.0001 0.0001 0.0101 0.0001
SEM 0.002 0.002 0.008 0.001 0.005 0.005 0.017 0.01
NP x Strain 0.2835 0.285 0.7567 0.4427 0.0978 0.1726 0.2564 0.8412
CV, % 2.84 3.33 3.34 2.15 2.51 3.71 5.24 4.60
Ebling PD, Ribeiro AML, Trevizan L, Silva ICM da, Kessler A de M, Rubin LL
Effect of Different Dietary Concentrations of Amino Acids on the Performance of Two Different Broiler Strains
the responses showed any interactions between strain and NP in any experimental phase. Therefore, only the main effects will be discussed.
During the pre-starter period, the High/Mixed NP promoted better BW, BWG, and FCR than the other programs (Table 3). As nutrient concentrations decreased, BW, BWG and FCR progressively worsened. During this period, birds consumed more feed when fed Low and Regular AA concentrations (p < 0.05) were fed, probably in an attempt to supply AA deficiencies. Broiler chickens offered free choice between two diets with different CP and AA levels presented similar performance as the control group (22% CP), by choosing diets with less protein, but rich in essential AA (Kolling et al., 2005). These results indicate that
the birds regulated their feed intake according to their protein requirements.
During the starter period, BW, BWG and FCR of the birds fed the Regular NP were similar to those fed the High/Mixed NP, but differed from the birds under Low NP, which promoted the worst results (p < 0.001; Table 3). On the other hand, FI was not different (p > 0.05) among NP, indicating that, during this phase, nutrient differences were not sufficient to increase FI in the birds fed the less concentrated NP.
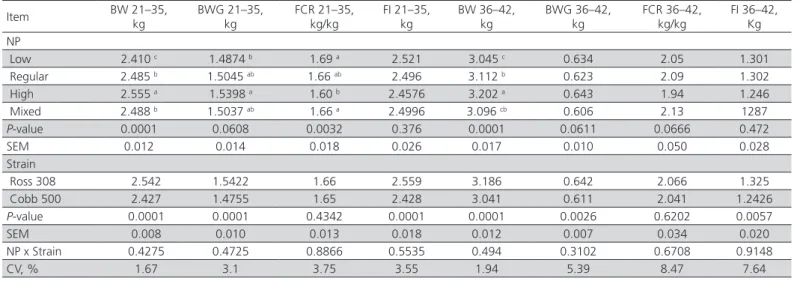
Between 21 and 35 days, the four NP were applied. The birds fed the High NP presented higher BW and BWG, although BWG was similar to that of birds under the Regular and Mixed programs (Table 4). When Low NP was fed, broilers had lower BW (p < 0.001), but their BWG and FCR were similar (p > 0.05) to those fed the Regular and Mixed NP, in contrast to previous phases that recovered to a certain degree. Between 36 and 42
days, there were no differences in the performance of birds fed the Regular and the Mixed NP. Only BW was statistically different: at 42 days, the broilers fed the High NP were the heaviest (Table 4).
Between 43 and 47 days, broilers from all treatments had the same BW, except for those fed the Low NP (p < 0.001). However, these broilers presented similar BWG and FCR as the High NP birds (p > 0.05; Table 5). The best BWG and FCR during this phase were achieved by the Regular and Mixed NP broilers, possibly indicating AA excess in the High NP.
Evaluating the total period (1 to 47 days), the NP with a low AA concentration was the only one that was different (p < 0.001) and worse than the others for BW and BWG (Table 5). On the other hand, better FCR was recorded for the High NP group (p < 0.001), followed by the Regular and the Mixed NP birds. During the total period, FI was similar among NP (p > 0.05).
During the entire experimental period and in all phases, Ross 308 broilers were heavier (p < 0.001), with higher BWG during the study due to their high FI, and had worse FCR than Cobb 500 broilers (p < 0.01). The lack of significant associations between strains and NP observed in this study differs from previous studies that used 17% CP and 0.6, 0.7 and 0.85% of Lys and two strains. In this study, Cobb chicks had higher BWG and better FCR when fed the lower Lys levels in comparison to Ross 308 chicks, but with high Lys levels, the results were similar (Sterling et al., 2006). Otherwise, no interactions were observed in one experiment when Cobb 500 broilers had higher BW at 21 days and better FCR until the end of the
Table 4 – Performance of broiler chickens at 21 to 35 and 36 to 42 days of age in accordance with each NP(1).
Item BW 21–35, kg
BWG 21–35, kg
FCR 21–35, kg/kg
FI 21–35, kg
BW 36–42, kg
BWG 36–42, kg
FCR 36–42, kg/kg
FI 36–42, Kg NP
Low 2.410 c 1.4874 b 1.69 a 2.521 3.045 c 0.634 2.05 1.301
Regular 2.485 b 1.5045 ab 1.66 ab 2.496 3.112 b 0.623 2.09 1.302
High 2.555 a 1.5398 a 1.60 b 2.4576 3.202 a 0.643 1.94 1.246
Mixed 2.488 b 1.5037 ab 1.66 a 2.4996 3.096 cb 0.606 2.13 1287
P-value 0.0001 0.0608 0.0032 0.376 0.0001 0.0611 0.0666 0.472
SEM 0.012 0.014 0.018 0.026 0.017 0.010 0.050 0.028
Strain
Ross 308 2.542 1.5422 1.66 2.559 3.186 0.642 2.066 1.325
Cobb 500 2.427 1.4755 1.65 2.428 3.041 0.611 2.041 1.2426
P-value 0.0001 0.0001 0.4342 0.0001 0.0001 0.0026 0.6202 0.0057
SEM 0.008 0.010 0.013 0.018 0.012 0.007 0.034 0.020
NP x Strain 0.4275 0.4725 0.8866 0.5535 0.494 0.3102 0.6708 0.9148
CV, % 1.67 3.1 3.75 3.55 1.94 5.39 8.47 7.64
experiment (37 days) while Ross 308 broilers had the highest FI (Vieira et al., 2007).
Results obtained from the present experiment agree with other studies that found that the performance of broilers worsens when low-protein diets are offered (Sklan & Noy, 2005; Lilly et al., 2011). Using data of six experiments, a reduction of more than 3% CP, even when corrected for the main limiting AA, resulted in worse performance (Dean, 2006). Reducing CP (20.8, 19.7 and 17.5%) of diets supplemented with synthetic AA had a negative effect on broiler WG and FCR between 21 and 28 days, indicating that, at this age, protein requirement may be higher than usual (20% CP) due to a higher rate of lean tissue accretion (Viola et al., 2008). It was clear that the increase in
AA concentrations in the starter and growing periods improved performance. However, in the present study, the best performance was observed when the High NP was fed during the entire rearing period. Under practical field conditions, where challenges are always stronger than under experimental conditions, the advantages of High NP could last longer.
Some studies show the importance of nutrition immediately after hatching (Halevy et al., 2000; Pophal
et al., 2004). In one study, broilers fed CP-deficient
diets presented better BWG and FCR when 1% Lys and 0.5% Met were supplemented to the diet containing 15% CP. On the other hand, no FI difference was found when low-protein diets, with or without AA supplementation, were compared (Khan et al., 2011). Cobb 500 broilers fed alternated diets with different AA concentrations (Low-High-High and Medium-High-High) from 1 to 14, 15 to 28 and 29 to 42 days
of age, showed the same FI and BWG at 42 d than those fed High-High-High AA concentrations (Corzo et al., 2010). In a similar study, broiler performance was
evaluated by feeding three protein profiles, including Medium (similar to those used in the Brazilian industry), High (15% higher) and Low (15% lower), from 1 to 21 and 22 to 42 days (Coneglian et al., 2010). Body weight was similar between Low-High and High-Low programs.
In the present study, broilers fed the Mixed NP with high AA concentrations during the starter phase and regular AA concentrations after it did not present any performance differences compared with those fed the Regular and High NP. The Mixed NP is an intermeditate program that prevents excessive dietary AA supply during the finishing phase, when broilers become less efficient and excessive nitrogen may have a negative effect (Kolling et al., 2005). The deamination of AA excess increases nitrogen excretion (Faria Filho et al., 2007) and the carbon chain is stored as fat (Leeson
et al., 1996), which is unhealthy for human nutrition
(Appel et al., 2005).
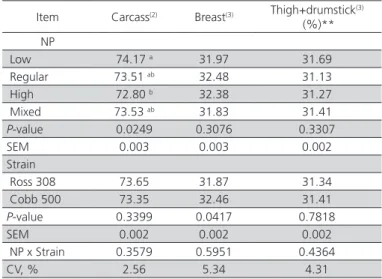
Carcass weight was not different between the strains (p > 0.05), but Cobb 500 birds presented higher breast yield than Ross 308 broilers (p < 0.05; Table 6). Birds fed the High NP had lower carcass yields compared with the Low NP (p < 0.05). The other NP showed intermediate values. Breast and thigh + drumstick yields were not different between NP (p > 0.05; Table 6). The higher carcass yield obtained with the Low NP suggests that birds fed this NP maximized body fat deposition, consequently increasing carcass weight. Studies have shown that birds fed diets with low AA concentrations Table 5 – Performance of broiler chickens at 43 to 47 days of age and the total experimental period (1–47 days) according to each NP(1).
Item BW 43–47,
kg
BWG 43–47, kg
FCR 43–47, kg/kg
FI 43–47, kg
BW 1–47, kg
BWG 1–47, kg
FCR 1–47, kg/kg
FI 1–47, kg NP
Low 3.513 b 0.464 b 2.35 a 1.088 3.513 b 3.459 b 1.789 a 6.190
Regular 3.619 a 0.503 a 2.19 b 1.1 3.619 a 3.562 a 1.729 b 6.159
High 3.676 a 0.469 ab 2.29 ab 1.075 3.676 a 3.606 a 1.674 c 6.037
Mixed 3.599 a 0.501 a 2.19 b 1.095 3.599 a 3.540 a 1.733 b 6.136
P-value 0.0001 0.0077 0.0094 0.4011 0.0001 0.0001 0.0001 0.1582
SEM 0.022 0.010 0.037 0.012 0.022 0.021 0.013 0.050
Strain
Ross 308 3.69 0.501 2.29 1.141 3.69 3.631 1.754 6.365
Cobb 500 3.514 0.467 2.23 1.038 3.514 3.453 1.708 5.897
P-value 0.0001 0.0011 0.1328 0.0001 0.0001 0.0001 0.001 0.0001
SEM 0.016 0.007 0.026 0.080 0.016 0.015 0.010 0.035
NP x Strain 0.5741 0.9883 0.8221 0.7452 0.5741 0.7731 0.9835 0.96
CV, % 2.12 6.91 5.70 3.69 2.12 2.02 2.56 2.77
Ebling PD, Ribeiro AML, Trevizan L, Silva ICM da, Kessler A de M, Rubin LL
Effect of Different Dietary Concentrations of Amino Acids on the Performance of Two Different Broiler Strains
had a higher percentage of abdominal fat compared with those that consuming high AA concentrations (Corzo et al., 2010). Determining AA requirements also aims at reducing body fat deposition, because AA deficiency or excess may cause imbalances that limit the growth of the lean tissues, increasing fat deposition, as energy can be obtained by AA deamination (Leeson
et al., 1996). These results contradict previous findings
that showed that broilers fed diets containing higher AA concentrations had higher carcass (Nasr, 2011) and breast (Corzo et al., 2010) yields. However, other
studies did not observe any influence on carcass yields when dietary CP was reduced (Coneglian et al., 2010;
Khan et al., 2011). The same effect was observed when
increasing Lys levels were offered (Si et al., 2001).
Table 6 – Yield (%) carcass and parts of broiler chickens according to NP(1).
Item Carcass(2) Breast(3) Thigh+drumstick(3)
(%)** NP
Low 74.17 a 31.97 31.69
Regular 73.51 ab 32.48 31.13
High 72.80 b 32.38 31.27
Mixed 73.53 ab 31.83 31.41
P-value 0.0249 0.3076 0.3307
SEM 0.003 0.003 0.002
Strain
Ross 308 73.65 31.87 31.34
Cobb 500 73.35 32.46 31.41
P-value 0.3399 0.0417 0.7818
SEM 0.002 0.002 0.002
NP x Strain 0.3579 0.5951 0.4364
CV, % 2.56 5.34 4.31
(1)Value within a column with no common superscript differs significantly by “LS
means” at 5% probability.
(2)Carcass weight / live weight.
(3)Part weight / carcass weight without head or feet.
Recent research study show that increasing protein levels above American industry practice (17% CP, 0.75% dig Lys, 0.66% dig sulfur AA, 0.53% dig Thr) improves FCR and breast yield in different strains (Kidd
et al., 2004; Kidd et al., 2005; Dozier III et al., 2006).
The pressure to reduce costs often limits industrial AA inclusion in finishing diets, a strategy that usually negatively affects breast growth (Vieira & Angel, 2012). In the present study, independently of the strains used, neither breast yield nor leg + thigh yield were influenced by NP. Because experimental diets formulation was based on the ideal protein concept (Parsons & Baker, 1994), no differences were observed in parts yields when high AA levels were included in the diet, probably because the diets were not unbalanced between the first and others limiting AA.
In the economic evaluation, the Low NP showed lower costs for BWG (p < 0.05) than the High and Mixed NP (Table 7). The Low and Regular NP resulted in greater economic returns (gross margin) compared with the High NP (p < 0.05), which, however, was not different from the Mixed NP. Due to their worse FCR observed throughout the experiment, Ross 308 birds had a higher feed cost per kg of BWG (p < 0.01) and lower gross margin return relative to Cobb 500 birds (p < 0.05), despite their better performance. Increasing dietary AA density during the starter phase may improve economic returns (Kidd et al., 2004), as proposed by High and Mixed NP in this trial. However, it should be remembered that there are many economic variables influencing the results, such as the type of product desired (whole carcass or special parts), and especially the price of ingredients and synthetic AA. The results found in the economic analysis of this study are attributed especially to the high price of ingredients and synthetic AA used in 2012. This confirms that the economic analysis should be taken into account when choosing NP because expensive diets, which promote the best performance, do not always bring the expected economic return.
Table 7 – Economic evaluation of the NP(1).
Item Cost per kg of BWG, $ Gross margin return, $ NP
Low 0.73c 0.76a
Regular 0.74bc 0.75a
High 0.76a 0.69b
Mixed 0.75ab 0.71ab
SEM 0.011 0.043
P-value 0.001 0.05
Strain
Ross 308 0.75 0.71
Cobb 500 0.73 0.75
SEM 0.008 0.01
P-value 0.001 0.030
NP x Strain 0.99 0.91
CV, % 2.58 9.98
(1)Value within a column with no common superscript differs significantly by LS means
at 5% probability.
CONCLUSIONS
2. The nutritional plan with high AA concentration is more recommended for the starter phase than for finisher phase.
3. Independently of NP, Ross 308 broilers were heavier from the first day and during the entire rearing period, but presented higher FI, worse FCR and lower economic returns when compared with Cobb 500 broilers.
REFERENCES
AOAC International. Official Method 994.12. 17th ed. Gaithersburg, MD, 2002. (Official Methods of Analysis of AOAC International, 17).
Appel LJ, SACKS FM, Carey VJ, Obarzanek E, Swain JF, Miller ER, Conlin PR, Erlinger TP, Rosner BA, Laranjo NM, Charleston J, McCarron P, Bishop LM. Effects of protein, monounsaturated fat, and carbohydrate intake on blood pressure and serum lipids. Journalof the American Medical Association 2005;294(19):2455–2464.
Araújo CSS da, Artoni SMB, Araújo LF, Junqueira OM, Borges SA. Diferentes perfis de aminoácidos para frangos de corte no período de 43 a 56 dias de idade. Revista Brasileira de Zootecnia 2002;31(1):387–393.
Coneglian JLB,Vieira SL, Berres J, Freitas DM de. Responses of fast and slow growth broilers fed all vegetable diets with variable ideal protein profiles. Revista Brasileira de Zootecnia 2010;39(2):327–334.
Corzo A, Fritts CA, Kidd MT, Kerr BJ. Responses of Cobb × Cobb 500 broilers to dietary amino acid density regimens. Journal Applied Poultry Research 2010;19:227–236.
Dean DW, Bidner TD, Southern LL. Glycine supplementation to low protein, amino acid-supplemented diets supports optimal performance of broiler chicks. Poultry Science 2006; 85:288–296.
Dozier III WA, Kidd MT, Corzo A, Anderson J, Branton SL. Growth performance, meat yield, and economic responses of broilers provided diets varying in amino acid density from thirty-six to fifty-nine days of age. Journal Applied Poultry Research 2006;15:383–393.
Faria Filho DE de, Campos DMB, Afonso-Torres KA, Vieira BS, Rosa OS, Vaz AM, Macari M, Furlan RL. Protein levels for heat-exposed broilers: performance, nutrients digestibility, and energy and protein metabolism. Poultry Science 2007;6(3):187–194.
Gous, R.M. Nutritional Limitations on growth and development in poultry. Livestock Science 2010;130:25–32.
Hackenhaar L, Lemme A. Como reduzir o nível de proteína em dietas de frangos de corte, garantindo performance e reduzindo custos. Anais do 7º Simpósio Goiano de Avicultura; 2º Simpósio Goiano de Suinocultura; 2005; Goiânia, Goiás. Brasil. p. 85-95.
Halevy O, Geyra A, Barak M, Uni Z, Sklan D. Early posthatch starvation decreases satellite cell proliferation and skeletal muscle growth in chicks. Journal of Nutrition 2000;130:858-864.
Khan SA, Ujjan N, Ahmed G, Ring MI, Fazlani SA, Faraz S, Ahmed S, Asif M. Effect of low protein diet supplemented with or without amino acids on the production of broiler. African Journal of Biotechnology 2011;10(49):10058–10065.
Kidd MT, McDaniel CD, Brandton SL, Miller ER, Boren BB, Fancher BI. Increasing amino acid density improves live performance and carcass yields of commercial broilers. Journal Applied Poultry Research 2004;13:593–604.
Kidd MT, Corzo A, Hoehler D, Miller ER, Dozier III WA. Broiler responsiveness (Ross × 708) to diets varying in amino acid density. Poultry Science 2005;84:1389–1396.
Kolling AV, Kessler AM de M, Ribeiro AML. Desempenho e composição corporal de frangos de corte alimentados com diferentes níveis de proteína e de aminoácidos ou com livre escolha das dietas. Revista Brasileira de Zootecnia 2005;34(1):98–103.
Leeson, S. Potential of modifying poultry products. Journal Applied Poultry Research 1993; 2:380–384.
Leeson S, Caston L, Summers JD. Broiler response to energy and protein dilution in the finisher diet. Poultry Science 1996;75(4):522–528.
Lilly RA, Schilling MW, Silva JL, Martin JM, Corzo A. The effects of dietary amino acid density in broiler feed on carcass characteristics and meat quality. Journal Applied Poultry Research 2011;20:56–67.
Nasr J. Effect of different levels of amino acids on carcass composition and yield in broilers.Animal Production Science 2011;51:1123–1126.
Parson CM, Baker DH. The concept and use of ideal proteins in the feedings of non-ruminants. Simpósio Internacional de Produção de Não Ruminantes; 1994; Maringá, Paraná. Brasil. p.119–128.
Pophal S, Mozdziak PE, Vieira SL. Satellite cell mitotic activity of broilers fed differing levels of lysine. International Journal Poultry Sciences 2004;3:758–763.
Si J, Fritts CA, Burnham DJ, Waldroup PW. Relationship of dietary lysine level to the concentration of all essential amino acids in broiler diets. Poultry Science 2011;80:1472–1479.
Silva Junior RGC, Lana GRQ, Rabello CB-V, Barboza WA, Lana SRV. Exigências de metionina + cistina para frangos de corte machos de 1 a 21 e de 22 a 42 dias de idade, em clima tropical. Revista Brasileira de Zootecnia 2005;34(6):2399–2407.
Sklan D, Noy Y. Direct determination of optimal amino acid intake for maintenance and growth in broilers. Poultry Science 2005;84:412–418.
Sterling KG, Pesti GM, Bakalli RJ. Performance of different broiler genotypes fed diets with varying levels of dietary crud protein and lysine. Poultry Science 2006;85:1045–1054.
Vieira SL, Olmos AR, Berres J, Freitas DM de, Coneglian JLB, Peña JEM. Respostas de frangos de corte fêmeas de duas linhagens a dietas com diferentes perfis protéicos ideais. Ciência Rural 2007;37(6):1753–1759.
Vieira SL, Angel CR. Optimizing broiler performance using different amino acid density diets: what are the limits. Journal Applied Poultry Research 2012;21(1):149–155.