http://dx.doi.org/10.1590/1516-635x1704473-482
in the Prediction of Egg Components of Laying Hens
Using Stepwise and Ridge Regression Analysis
Author(s)
Shafey TMI
Hussein ESI
Mahmoud AHII
Abouheif MAI
Al-Batshan HAI
I Department of Animal Production, College
of Food and Agriculture Sciences, King Saud University, Riyadh, Saudi Arabia
II Department of Zoology, College of Science,
King Saud University, Riyadh, Saudi Arabia
Mail Address
Corresponding author e-mail address Prof. Tarek M. Shafey
Department of Animal Production, College of Food and Agriculture Sciences, King Saud University, Riyadh, Saudi Arabia Phone: +966 1 4678785
Fax: +966 1 4678474 Email: [email protected]
Keywords
Age of laying hens, morphological characters of eggs, predicting egg components, regression analysis.
Submitted: May/2014 Approved: August/2015
ABSTRACT
The relationships between egg measurements [egg weight (EGWT), egg width (EGWD), egg shape index (EGSI), egg volume (EGV) and egg density (EGD)], and egg components [eggshell (SWT), yolk (YWT) and albumen (AWT)] were investigated in laying hens with 32, 45, and 59 weeks of age with an objective of managing multicollinearity (MC), using stepwise regression (SR) and ridge regression (RR) analyses.
There were significant correlations among egg traits that led to MC problems in all eggs. Hen age influenced egg characteristics and the magnitude of the correlations among egg characteristics. Eggs produced at older age had significantly (p<0.01) higher EGWT, EGWD, EGV, YWT and AWT than those produced at younger age. The SR model alleviated MC problem in eggs produced at 32 weeks, with condition index greater than 30, and one predictor, EGWT had a model fit predicted egg components with R2 ranged from 60 to 99%.
The SR model of eggs produced at 45 and 59 weeks indicated MC problem with variance inflation factors (VIF) values greater than 10, and 4 predictors; EGWT, EGWD, EGV and EGD had a model fit that significantly predicted egg components with R2 % ranged from 76 to
99 %. The RR analysis provided lower VIF values than 10 and eliminated the MC problem for eggs produced at any age group.
It is concluded that the RR analysis provided an ideal solution for managing the MC problem and successfully predicting egg components of laying hens from egg measurements.
INTRODUCTION
The characteristics of chicken egg are important part of consumer acceptability (Bejaei et al., 2011). Most eggs marketed in Saudi Arabia are sold in their shell and a consumer’s first impression of any egg purchased is based on their perception of weight and shell quality (Attia et al., 2014). The market requirements for egg measurements encourage the industry to pay attention to egg weight and egg components. However, no defined grades have been developed for shell eggs sold in Saudi Arabia and little attention has been focused on the characteristics of egg and its components.
Scott, 2001; Zita et al., 2009). However, there is little detailed information on the prediction of the weight of egg components throughout the laying cycle. Much of the published information seems to predict only egg components from a set of egg measurements (Shafey et al., 2014). In addition, the interrelationships among egg characteristics and layer age have been investigated to an extent, but information on the problem of collinearityis still scarce.
Collinearity or multicollinearity (MC) occurs when a regression model includes two or more highly related predictors. The MC reduces the stability of the corresponding parameter estimates, increases standard errors, and decreases power to measure effects (Kreft & de Leeuw, 1998; Harrell, 2001; Cohen et al., 2003). Shafey et al. (2014) investigated the problem of MC in the estimation of egg components (eggshell weight, yolk weight, and albumen weight) of meat-type chicken eggs produced by 36-wk-old breeders. They found MC problems in egg weight, egg shape index and their interaction, as shown by variance inflation factor (VIF=>10), condition index (CI=>30) and high corresponding proportions of variance of egg weight, egg shape index and their interaction, respectively.
There are many statistical solutions to correct
the MC problem. These include stepwise regression
(Yakubu, 2009) and ridge regression analysis (Smith & Campbell, 1980; Schoeman et al., 2002; Pimentel
et al., 2007). Stepwise regression is based on building a model by successively adding or removing collinear predictors based solely on the t-statistics of their estimated coefficients. Ridge regression improves the accuracy of a regression model by reducing the apparent magnitude of the correlations (Hoerl & Kennard, 1970a, 1970b; Hoerl et al., 1975; Marquardt & Snee, 1975; Mahajan et al., 1977).
Therefore, the objectives of this study were to ascertain the existence of collinearity in the estimation of egg components based on the morphological traits (egg weight, egg width, egg shape index, egg volume, and egg density) of eggs laid by 32-, 45-, and 59-wk-old of laying hens and to correct the problem, if detected, using stepwise regression and ridge regression analysis.
MATERIALS AND METHODS
A total of 540 freshly-laid eggs produced by a meat-type breeder flock (Ross-Alwadi, Riyadh, Saudi Arabia) were collected when hens were 32, 45 and 59 weeks old, with 180 eggs from each age group. Eggs were candled to detect cracks, then numbered and
weighed (EGWT) individually in an electronic scale at ± 0.01 g precision. Egg length (EGL) and width (EGWD) were measured using a steel vernier caliper graduated to one tenth of a millimeter. Egg shape index (EGSI) was calculated using Equation 1, according to Carter (1968):
EGSI = (EGWD/EGL) x 100 (Eq. 1). Egg volume (EGV) was measured by the water displacement technique. The difference between the weight of an egg in the air and the weight in the water is equal to the weight of the water displaced by the egg (Archimedes’ principle). The weight of the water displaced in grams is equal to the volume of the egg in milliliters (Carr, 1939) and egg density (EGD) was calculated by dividing the EGWT by EGV.
Eggs were broken and albumen and yolk separated. The yolk was then carefully rolled on a paper towel to remove extra white and chalaza. When the chalaza was not removed by this process, a razor was used to remove it from the yolk and the clean yolk was weighed (YWT). Eggshell was washed, air dried overnight and weighed (SWT) on an electronic scale. Eggshell membrane was not separated from the egg shell, thus eggshell weight includes membrane weight. All weights were measured with accuracy to the nearest 0.1 g. Albumen weight (AWT) was calculated by subtracting the total of YWT and SWT from EGWT. Also, eggshell weight percentage (SWTP) was calculated using Equation 2:
SWTP=SWT*100/EGWT (Eq. 2), yolk weight percentage (YWTP) was calculated using Equation 3:
YWTP=YWT*100/EGWT (Eq. 3) and albumen weight percentage (AWTP) was calculated using Equation 4:
AWTP=AWT*100/EGWT (Eq. 4). Measurements were made of independent variables of EGWT, EGWD, EGSI, EGV and EGD, and dependent variables of YWT, SWT and AWT.
Statistical analysis
Data were analyzed for descriptive statistics (mean, coefficient of variation, minimum and maximum values and standard deviation). Stepwise regression analyses were used with the aim of predicting egg composition of SWT, YWT and AWT from a set of explanatory variables of egg characteristics (EGWT, EGWD, EGSI, EGV and EGD). The model that describes the regression analysis (Alexopoulos, 2010) is given in Equation 5:
where, Y = dependent variable (Y1, Y2 or Y3 for SWT, YWT or AWT); a = intercept; ß’s = regression coefficients; X’s = independent variables (X1, X2, X3, X4,and X5 for EGWT, EGWD, EGSI, EGV and EGD, respectively); and e = the error term. The level of 0.15 was chosen for the stepwise selection to place a restriction on the number of variables allowed into the regression model.
The correlation coefficients among the independent egg variables, VIF and CI were computed to investigate the existence or not of MC. The method of VIF of Rook
et al. (1990) was employed as in Equation 6:
VIF=1 / (1-Ri2) (Eq. 6)
where, R i2 = coefficient of determination.
The CI measurement was also computed following the procedures adopted by Pimentel et al. (2007). In ridge regression analysis, the cross-product matrix for the independent variables (X1 – X5) is centered and scaled to one on the diagonal elements. The ridge con-stant k is then added to each diagonal element of the cross-product matrix. The ridge regression estimates for each variable are the least squares estimates obtained by using the new cross-product matrix. Let X be an n ×p matrix of the independent variables after centering the data, and let Y be an n ×1 vector corresponding to the dependent variable (Y1, Y2 or Y3). Let D be a p ×p diagonal matrix with diagonal elements as in X`X. The ridge regression estimate corresponding to the ridge constant k can be computed as in Equation 7:
k = D-1/2(Z`Z + kI
p)
-1Z`Y (Eq. 7)
where Z=XD-1/2 and I
p is a pXp identity matrix.
SAS procedure
Egg parameter results were analyzed by one-way analysis of variance using the SAS PROC ANOVA. Pearson correlation coefficients were calculated between egg variables using the SAS PROC CORR procedure. Predictive regression models were constructed using the SAS PROC REG. To test for MC in predictor variables, VIF, CI and TOL for each predictor were calculated in the analysis (PROC REG with options VIF, CI and TOL). The egg parameter were submitted to a stepwise multiple regression procedure to determine the equation that best estimates egg components (PROC REG with option stepwise). Ridge regression analysis was performed using the ridge option in the PROC REG Procedure. All analyses were performed using the SAS statistical analysis system (SAS, 2006).
RESULTS AND DISCUSSION
Descriptive statistics of eggs laid by broiler breeders at 32, 45 and 59 weeks of age are shown in Table 1. Hen age is one of the main factors influencing egg characteristics (Van den Brand et al., 2004; Rizzi & Chiericato, 2005; Johnston & Gous, 2007; Zita et al., 2009). Eggs produced by older hens presented significantly (p<0.01) higher EGWT, EGWD, EGV, YWT, AWT, and SWT than those produced by younger hens(59>45>32, and 59>32>45 weeks of age, respectively). Eggs produced at 32 weeks of age had significantly (p<0.01) higher SWTP and AWTP and lower YWTP than those produced at older age (32>59>45 weeks of age). The EGD was significantly (p<0.01) lower at 45 weeks of age when compared with those produced at 32 and 59 weeks of age. EGSI was not influenced by hen age. These findings were in agreement with Van den Brand et al. (2004), Johnston & Gous (2007), and Zita et al. (2009), who reported that EGWT, YWT, AWT and YWTP increased with age of the hen, whereas AWTP and SWTP decreased with age (Rizzi & Chiericato, 2005; Zita et al., 2009).
Table 1 – Measurements of Ross strain eggs produced at 32, 45 and 59 weeks of age
Egg variable1
Age (week)
SEM2
32 45 59
EGWT 58.37c 61.12b 65.93a 0.230
EGWD 43.33c 44.37b 44.95a 0.074
EGSI 0.78 0.79 0.79 0.002
EGV 53.94c 58.09b 61.40a 0.216
EGD 10.07a 10.06b 10.07a 0.015
SWT 5.35b 5.28c 5.85a 0.022
YWT 17.08c 19.24b 19.91a 0.063
AWT 35.94c 36.60b 40.18a 0.160
SWTP 9.16a 8.64c 8.87b 0.012
YWTP 29.30c 31.49a 30.19b 0.053
AWTP 61.54a 59.88c 60.94b 0.055
1 EGWT=Egg weight (g); EGWD=Egg width (mm); EGSI=Egg shape index [egg width
(mm)/egg length (mm)]; EGV=Egg volume(cm3);EGD= Egg density(g cm -3); SWT=Shell
weight(g); YWT=Yolk weight(g); AWT=Albumen weight(g); SWTP=Shell weight percentage YWTP=Yolk weight percentage; AWTP=Albumen weight percentage.
2 Standard error of mean.
p<0.01-0.74, p<0.001) and between EGD and egg components of SWT and AWT (0.20, p<0.01- 0.28, p<0.001). The high positive correlations between egg components and EGWT or EGV would suggest that EGWT and EGV are good indicators and predictors of components of eggs produced at 32, 45 and 59 weeks of age. However, results indicated that there were dif-ferences in the correlations among eggs produced at the three different ages. The correlation coefficients between egg components and EGWD or EGD ranged from 0.20 (p<0.01) to 0.74 (p<0.001) and it seems that the correlation coefficient changes with the size of the egg. The correlations between egg measures
(EGWT and EGWD) and egg components (SWT, YWT and AWT) were in agreement with Olawumi & Ogun-lade (2008) and Shafey et al. (2014), who found that the EGWT and EGWD had positive significant correla-tions with egg components.
The EGWT, EGV, and EGWD of the eggs produced at 32 and 45 weeks of age were positively correlated with AWTP and negatively correlated with YWTP (r =0.23-0.91, p<0.01- p<0.001). The EGD of the eggs produced at 32 and 59 weeks of age was negatively correlated with YWTP (r =0.17, p<0.05, to 0.20, p<0.01), and positively correlated with YWT (r =0.15,
Table 2 – Coefficient of correlation of the measurements of Ross strain eggs produced at 32, 45 and 59 weeks of age.
Age (week) Egg variable1 EGWT EGWD EGSI EGV EGD
32 EGWD 0.262*** 1
EGSI -0.311*** 0.532*** 1
EGV 0.771*** 0.289*** -0.551*** 1
EGD 0.203** -0.727*** -0.194** -0.163* 1
SWT 0.999*** 0.263*** -0.310*** 0.773*** 0.203**
YWT 0.774*** 0.217*** -0.241** 0.601*** 0.134
AWT 0.995*** 0.258*** -0.310*** 0.766*** 0.206**
SWTP 0.708*** 0.200** -0.205** 0.593*** 0.149*
YWTP -0.911*** -0.228** 0.283*** -0.695*** -0.202**
AWTP 0.909*** 0.227** -0.283*** 0.693*** 0.201**
45 EGWD 0.741*** 1
EGSI 0.006 0.370*** 1
EGV 0.955*** 0.799*** 0.099 1
EGD 0.312*** -0.067 -0.293*** 0.016 1
SWT 0.988*** 0.734*** 0.010 0.957*** 0.264***
YWT 0.962*** 0.701*** -0.015 0.893*** 0.387***
AWT 0.996*** 0.742*** 0.015 0.960*** 0.280***
SWTP 0.128 0.110 0.026 0.208** -0.242**
YWTP -0.564*** -0.456*** -0.070 -0.619*** 0.088
AWTP 0.628*** 0.507*** 0.076 0.678*** -0.057
59 EGWD 0.745*** 1
EGSI 0.012 0.372*** 1
EGV 0.957*** 0.801*** 0.096 1
EGD 0.244** -0.111 -0.285*** -0.048 1
SWT 0.868*** 0.580*** -0.081 0.818*** 0.252***
YWT 0.929*** 0.673*** 0.007 0.911*** 0.151*
AWT 0.968*** 0.742*** 0.031 0.916*** 0.272***
SWTP 0.061 -0.092 -0.184* 0.031 0.103
YWTP 0.109 0.030 -0.015 0.162* -0.174*
AWTP -0.110 0.007 0.075 -0.144 0.107
p<0.05, to 0.39, p<0.001) in eggs produced at 45 and 59 weeks of age. These data demonstrate that eggs produced at 32, 45, and 59 weeks of age presented different characteristics and consequently the correlation coefficients varied among characteristics.
A summary of the regression analysis of egg mea-surements is shown in Table 3. Regression analysis in-dicated that the VIF values of EGWD and EGSI of the eggs produced at 45 and 59 weeks of age were be-tween 1.4 and 3.7. However, the strong correlations found among egg measures led to MC problems in the in all age groups. The VIF and CI values ranged from
62 to 5568 and 35 to 4698, respectively. The VIF and CI are two of the collinearity diagnostic measures that give information about the level of MC for a reliable statistical analysis in a multiple regression analysis. The upper limits for VIF and CI are considered to be 10 and 30, respectively (Belsley, 1982; Karakus et al., 2010).
The results of stepwise regression analysis are given in Table 4. Results from the stepwise regression model of eggs produced at 32 weeks of age indicated that the EGWT was the significant variable included in the model with R2 % ranged from 60 to 99 for egg components
(SWT, YWT and AWT). This finding suggests that 60 to
Table 3 – Summary of regression analysis of measurements of Ross strain eggs produced at 32, 45 and 59 weeks of age
Age (week) Egg variable1 SWT YWT AWT1 TOL2 VIF3 CI4
32 ß15 0.308 33.846 -34.154 . 0 1
EGWT 0.098 0.283 0.6183 0.003 321.8 34.6
EGWD -0.023 -0.936 0.9597 0.001 1552.7 36.2
EGSI 0.502 18.004 -18.506 0.001 655.6 103.0
EGV 0.003 0.067 -0.0707 0.016 62.4 201.3
EGD -0.218 -9.816 10.0338 0.001 682.0 4698.4
RMSE6 0.0079 0.2249 0.2240 - -
-SSE7 0.0107 8.7975 8.7345 - -
-RSQ8 0.9991 0.6049 0.9894 - -
-Adj. RSQ9 0.9990 0.5963 0.9891 - -
-45 ß15 12.1368 -51.2441 39.1073 . 0 1
EGWT 0.2737 -0.5444 1.2708 0.0002 4662.3 43.34
EGWD -0.0122 0.0579 -0.0457 0.271 3.69 80.1
EGSI 0.01974 -0.4258 0.4061 0.691 1.445 165.1
EGV -0.1915 0.8314 -0.6399 0.0002 4193.1 274.7
EGD -11.2731 50.2752 -39.0021 0.0024 410.8 203.8
RMSE6 0.0422 0.2270 0.1858 - -
-SSE7 0.3103 8.9659 6.0056 - -
-RSQ8 0.9800 0.9375 0.9927 - -
-Adj. RSQ9 0.9795 0.9357 0.9925 - -
-59 ß15 18.6347 86.2314 -104.861 . 0 1
EGWT 0.3568 1.4913 -0.8480 0.0002 5567.7 46.1
EGWD -0.0427 -0.1580 0.2007 0.2707 3.6944 82.0
EGSI -0.6514 0.5174 0.1340 0.6922 1.4446 177.7
EGV -0.2745 -1.2127 1.4871 0.0002 5229.9 280.7
EGD -15.849 -77.7525 93.5972 0.0021 470.0 406.4
RMSE6 0.1692 0.3993 0.4836 - -
-SSE7 4.9766 27.7483 40.9176 - -
-RSQ8 0.7667 0.8764 0.9423 - -
-Adj. RSQ9 0.7600 0.8729 0.9406 - -
-1 Egg variable=See Table 1; 2 TOL=Tolerance value; 3 VIF=Variation inflation factor; 4 CI=Condition index; 5 ß=Parameter estimate; 6 RMSE=Root Mean Square Error; 7 SSE=sum of
99% of the variations in components (SWT, YWT and AWT) of eggs produced at 32 weeks of age can be explained by EGWT. However, VIF and CI values were 1.0 and 44, respectively. The slightly high CI value indicated a moderate MC problem.
The stepwise regression models for the prediction of components of eggs produced at 45 weeks of age indicated MC problems with VIF and CI ranged from 2.84 to 4615, and 43 to 5640, respectively. The variables included in the model were EGWT, EGWD, EGV and EGD with R2 % ranged from 93 to 99%. This
finding suggested that 93 to 99% of the variations in components of the eggs produced at 45 weeks of age can be explained by EGWT, EGWD, EGV and EGD. On the other hand, the stepwise regression models for the prediction of components of the eggs produced at 59 weeks of age indicated MC problems with VIF and CI ranged from 1.02 to 5486, and 46 to 6719, respectively. The variables included in the model were EGWT and EGWD; EGWT, EGWD, EGV and EGD; and EGWT, ESI and EGD for the prediction of SWT, YWT and AWT, respectively. These variables explain about
Table 4 – Summary of stepwise regression analysis of measurements of Ross strain eggs produced at 32, 45 and 59 weeks of age.
Age (week)
Egg
variable1 SWT1 TOL2 VIF3 CI4 YWT1 TOL2 VIF3 CI4 AWT1 TOL2 VIF3 CI4
32 ß1
5 -0.175 - 0 1.00 11.095 - 0 1.00 -10.919 - 0 1.00
EGWT 0.095 1.00 1.00 44.0 0.102 1.00 1.00 44.0 0.803 1.00 1.00 44.0
RMSE6 0.0079 - - - 0.224 - - - 0.2234 - -
-SSE7 0.0112 - - - 8.939 - - - 8.881 - -
-RSQ8 0.9990 - - - 0.5985 - - - 0.9892 - -
-Adj. RSQ9 0.9990 - - - 0.5963 - - - 0.9892 - -
-45 ß15 12.091 - 0 1.00 -50.259 - 0 1.00 38.168 - 0 1.00
EGWT 0.273 2.2E-4 4615.13 43.50 -0.525 2.2E-4 4615.13 43.50 1.252 2.2E-4 4615.13 43.50
EGWD -0.012 0.35 2.84 116.99 - 0.353 2.84 116.99 -0.0367 0.3526 2.84 116.99
EGV -0.191 2.4E-4 4158.15 243.89 - 2.4E-4 4158.15 243.89 0.6220 2.4E-4 4158.15 243.89
EGD -11.229 2.4E-3 407.75 5640.27 - 2.4E-3 407.75 5640.27 -38.0907 2.4E-3 407.75 5640.27
RMSE6 0.0421 - - - 0.226 - - - 0.1855 - -
-SSE7 0.3103 - - - 8.9816 - - - 6.021 - -
-RSQ8 0.9800 - - - 0.9374 - - - 0.9927 - -
-Adj. RSQ9 0.9796 - - - 0.9359 - - - 0.9925 - -
-59 ß15 1.507 - 0 1.00 84.418 - 0 1.00 -48.820 - 0 1.00
EGWT 0.104 0.44 2.244 48.42 1.460 1.8E-4 5486.54 46.27 - 0.35 2.819 50.169
EGWD -0.055 0.44 2.244 159.18 -0.115 0.26 2.82 128.81 0.200 - -
-EGSI - - - 0.39 2.79 151.12
EGV - - - - -1.181 0.35 5164.21 250.40 0.577 - -
-EGD - - - - -76.023 1.9E-4 464.55 6719.14 41.524 0.98 1.02 251.91
RMSE6 0.1688 - - - 0.3984 - - - 0.4824 - -
-SSE7 5.0455 - - - 27.7715 - - - 40.9542 - -
-RSQ8 0.7636 - - - 0.8763 - - - 0.9419 - -
-Adj. RSQ9 0.7609 - - - 0.8735 - - - 0.9409 - -
-1 Egg variable=See Table 1; 2 TOL=Tolerance value; 3 Variation inflation factor; 4 Condition index; 5 ß=Parameter estimate; 6 RMSE=Root Mean Square Error; 7 SSE=sum of squared
76 to 94% of the variation in SWT, YWT and AWT of the eggs produced at 59 weeks of age.
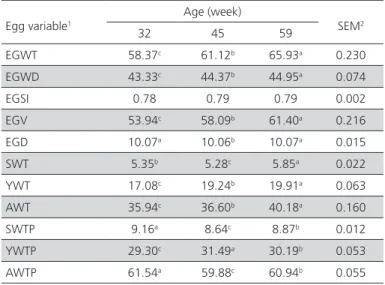
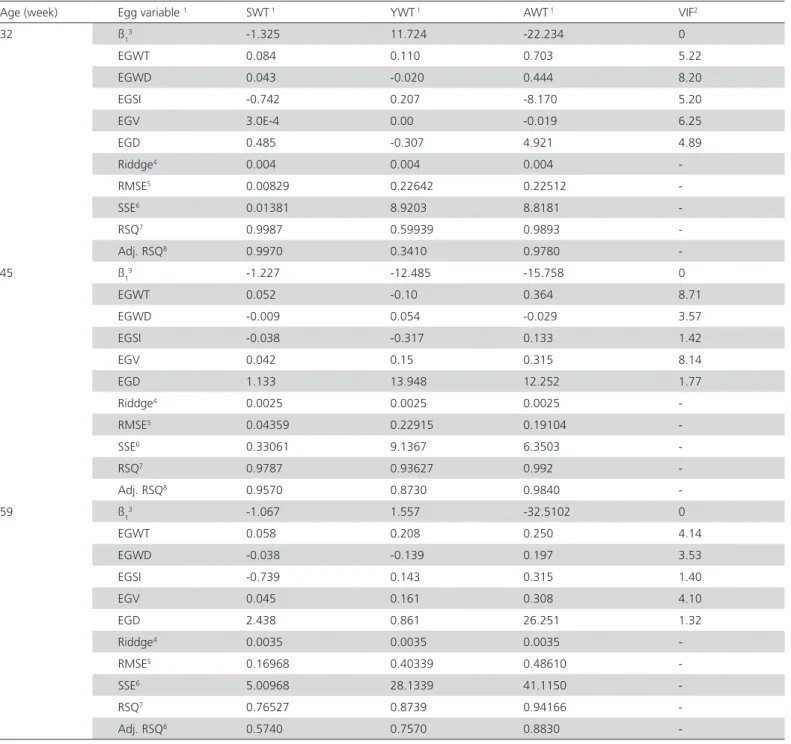
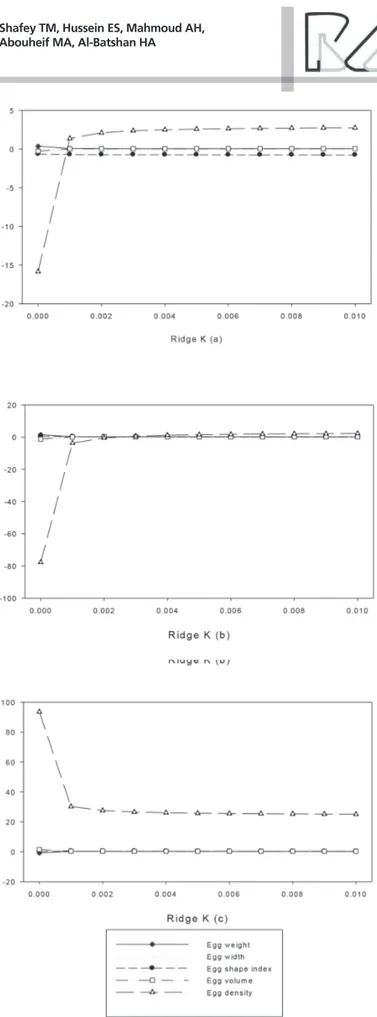
The results of ridge regression analysis are shown in Table 5 and Figures 1, 2, and 3 for eggs produced at 32, 45 and 59 weeks of age, respectively. The VIF values produced by ridge regression ranged from 4.9 to 8.2, 1.4 to 8.7 and 1.3 to 4.1 for eggs produced at 32, 45 and 59 weeks of age, respectively, all of which were lower than 10. These findings suggested that
ridge regression analysis provided an ideal solution for managing the moderate and severe MC problems and successfully predicting egg components (SWT, YWT and AWT) from measurements (EGWT, EGWD, EGSI, EGV and EGD) of eggs produced at 32, 45 and 59 weeks of age. This study is in agreement with earlier studies, which indicated that the use of ridge regression eliminated the problem of MC (Schoeman
et al., 2002; Pimentel et al., 2007).
Table 5 – Summary of Ridge regression analysis of measurements of Ross strain eggs produced at 32, 45 and 59 weeks of age
Age (week) Egg variable 1 SWT 1 YWT 1 AWT 1 VIF2
32 ß13 -1.325 11.724 -22.234 0
EGWT 0.084 0.110 0.703 5.22
EGWD 0.043 -0.020 0.444 8.20
EGSI -0.742 0.207 -8.170 5.20
EGV 3.0E-4 0.00 -0.019 6.25
EGD 0.485 -0.307 4.921 4.89
Riddge4 0.004 0.004 0.004
-RMSE5 0.00829 0.22642 0.22512
-SSE6 0.01381 8.9203 8.8181
-RSQ7 0.9987 0.59939 0.9893
-Adj. RSQ8 0.9970 0.3410 0.9780
-45 ß13 -1.227 -12.485 -15.758 0
EGWT 0.052 -0.10 0.364 8.71
EGWD -0.009 0.054 -0.029 3.57
EGSI -0.038 -0.317 0.133 1.42
EGV 0.042 0.15 0.315 8.14
EGD 1.133 13.948 12.252 1.77
Riddge4 0.0025 0.0025 0.0025
-RMSE5 0.04359 0.22915 0.19104
-SSE6 0.33061 9.1367 6.3503
-RSQ7 0.9787 0.93627 0.992
-Adj. RSQ8 0.9570 0.8730 0.9840
-59 ß13 -1.067 1.557 -32.5102 0
EGWT 0.058 0.208 0.250 4.14
EGWD -0.038 -0.139 0.197 3.53
EGSI -0.739 0.143 0.315 1.40
EGV 0.045 0.161 0.308 4.10
EGD 2.438 0.861 26.251 1.32
Riddge4 0.0035 0.0035 0.0035
-RMSE5 0.16968 0.40339 0.48610
-SSE6 5.00968 28.1339 41.1150
-RSQ7 0.76527 0.8739 0.94166
-Adj. RSQ8 0.5740 0.7570 0.8830
-1 Egg variable=See Table 1; 2 Variation inflation factor; 3 ß=Parameter estimate; 4 Ridge point; 5 RMSE=Root Mean Square Error; 6 SSE=sum of squared errors; 7 RSQ= R-squared; 8 Adj.
Figure 1 – Ridge trace plots of K value for eggshell weight (a), yolk weight and albumin weight (c) of eggs produced at 32 weeks age
Figure 3 – Ridge trace plots of K value for eggshell weight (a), yolk weight and albumin weight (c) of eggs produced at 59 weeks age
ACKNOWLEDGEMENTS
The Authors extend their appreciation to the Deanship of Scientific Research at King Saud University for funding the work through the research group project No-185.
CONCLUSIONS
The objectives of this study were to determine the presence of collinearity in the estimation of egg components from morphological characters of eggs and get the best model to describe the components of eggs produced by hens at 32, 45 and 59 weeks of age. In the present study, MC problems were found in the data collected from eggs produced by hens of the three age groups. The ridge regression analysis provided better solution of the MC problem than the stepwise regression when predicting components of SWT, YWT and AWT of eggs.
REFERENCES
Alexopoulos EC. Introduction to multivariate regression analysis. Hippokratia 2010;14(Suppl 1):23-28.
Attia YA, Al-Harthi M A, Shiboob MM. Evaluation of quality and nutrient contents of table eggs from different sources in the retail market. Italian Jorunal of Animal Science 2014;13:369-376.
Belsley DA. Assessing the presence of harmful collinearity and other forms of weak data through a test for signal-to-noise. Journal of Econometrics 1982;20:211-253.
Bejaei M, Wiseman K, Cheng KM. Influences of demographic characteristics, attitudes, and preferences of consumers on table egg consumption in British Columbia, Canada. Poultry Science 2011;90:1088-1095.
Carr RH. The measurement of freshness of unbroken eggs. Poultry Science 1939;18:225-231.
Carter TC. The hen egg. A mathematical model with three parameters. British Poultry Science 1968;9:165-171.
Cohen J, Cohen P, West SG, Aiken LS. Applied multiple regression/ correlation analysis for the behavioral sciences. 3rd ed. Mahwah: Lawrence Erlbaum Associates; 2003.
Harrell FE. Regression modeling strategies with applications to linear models, logistic regression, and survival analysis. New York: Springer-Verlag; 2001.
Hoerl AE, Kennard RW. Ridge regression: biased estimation for non -orthogonal problems. Technometrics 1970a;12:55-67.
Hoerl AE, Kennard RW. Ridge regression: applications to non-orthogonal problems. Technometrics 1970b;12:69-82.
Johnston SA, Gous RM. Modelling the changes in the proportions of the egg components during a laying cycle. British Poultry Science 2007;48:347-353.
KarakusKE, EyduranT, Aygun T, Javed K. Appropriate growth model describing some testicular characteristics in Norduz male lambs. Journal of Animal and Plant Sciences 2010;20:1-4.
Kreft I, Leeuw J. Introducing multilevel modeling. London: Sage; 1998.
Mahajan Vijay A, Jain K, Bergier M. Parameter estimation in marketing models in the presence of multicollinearity: An Application of ridge regression. Journal of Marketing Research 1997;14:586-591.
Marquardt DW, Snee RD. Ridge regression in practice. American Statistician 1975;29:3-19.
Olawumi SO, Ogunlade JT. Phenotypic correlations between some external and internal egg quality traits in the exotic isa brown layer breeders. Asian Journal of Poultry Science 2008;2:30-35.
Pimentel ECG, Queiroz SA, Carvalheiro R, Fries LA. Use of ridge regression for prediction of early growth performance in crossbred calves. Genetics and Molecular Biology 2007;30:536-544.
Rizzi C, Chiericato GM. Organic farming production. Effect of age on the productive yield and egg quality of hens of two commercial hybrid lines and two local breeds. Italian Journal of Animal Science 2005;4:160-162.
Rook AJ, Dhanoa MS, Gill M. Prediction of the voluntary intake of grass silages by beef cattle. 2. Principal component and ridge regression analyses. Animal Production Science 1990;50:455-466.
SAS. Guide for personal computers, version 9.1.3. Cary; 2006.
Schoeman SJ, Aziz MA, Jordaan GF. The influence of multicollinearity on crossbreeding parameter estimates for weaning weight in beef cattle. South African Journal of Animal Science 2002;32:239-246.
Shafey TM, Mahmoud AH, Abouheif MA. Dealing with multicollinearity in predicting egg components from egg weight and egg dimension. Italian Journal of Animal Science 2014;13:715-718.
Silversides FG, Scott TA. Effect of storage and layer age on quality of eggs from two lines of hens. Poultry Science 2001;80:1240-1245.
Smith G, Campbell F. A critique of some ridge regression methods. Journal of the American Statistical Association 1980;75:74-81.
Van den brand H, Parmentier HK, Kemp B.Effects of housing system (outdoor vs. cages) and age of laying hens on egg characteristics. British Poultry Science 2004;45:745-552.
Wahlstrom A, Tauson R, Elwinger k. Production and egg quality as influenced by mash or crumbled diets fed to laying hens in an aviary system. Poultry Science 1999;78:1675-1680.
Yakubu A. Fixing collinearity instability in the estimation of body weight from morpho-biometrical traits of westafrican dwarf goats. Trakia Journal of Sciences 2009;7:61-66.