Original
Recebido para publicação em 9/5/2008 Aceito para publicação em 3/1/2009 (003503)
1 Food Engineering Department, School of Food Engineering, University of Campinas – UNICAMP, P.O. Box 6121, CEP 13083-862, Campinas - SP, Brazil, E-mail: viotto@fea.unicamp.br
*A quem a correspondência deve ser enviada
Drying of sicilian lemon residue: influence of process
variables on the evaluation of the dietary fiber produced
Secagem do resíduo de limão siciliano: influência das variáveis de processo
na avaliação da fibra alimentar produzida
Vanessa Martins SILVA1, Luiz Antonio VIOTTO1*
1 Introduction
Lemons (Citrus limón L. Burm) are characterized by their light yellow color and excessively high acid content; they are primarily processed into juice and lemonade, as well as pectin and lemon oil (KIMBAL, 1999). Peels, bagasse, membranes, vesicles, and seeds are some by-products that have commercial value, such as essential oil and limonene which are produced during the juice manufacturing process. Solid residues account for a great amount of the whole fruit, about 50 to 60%, and are usually used meant for animal feed (ASSOCIAÇÃO BRASILEIRA DOS EXPORTADORES DE CÍTRICOS, 2007). Some aspects must be observed when dealing with the production of dietary fibers from industrial residues. To begin with, the type of residue and whatever is being processed, fruits, vegetables, or cereals, should be considered since fruits and vegetables present higher content of fibers (soluble and
insoluble) and have better quality. Their harvest time should also be taken into account, as well as their microbiological quality, since possible applications of treatments to reduce their microbial load can affect their corresponding sensory characteristics, such as bitterness in citric fruits, because of flavonoids (PÉREZ; SÁNCHEZ, 2001).
Dietary fibers were initially known for their nutritional properties. However, they also have technological properties that can be used in the formulation of foods resulting in texture modification and enhancement of the stability of the food during production and storage (THEBAUDIN et al., 1997). Some authors added citrus fibers to cooked and dry-cured sausages (FÉRNANDEZ-LOPEZet al., 2004), beef burgers (ALESON-CARBONELL et al., 2005), and fermented milk containing probiotics (SENDRA et al., 2008).
Resumo
Estudou-se o efeito das variáveis de processo da secagem do resíduo de limão siciliano sobre algumas propriedades tecnológicas das fibras produzidas. A determinação e modelagem das isotermas de dessorção foram utilizadas para determinar o conteúdo de umidade de equilíbrio a 60, 75 e 90 °C, através do método gravimétrico estático com 8 soluções salinas saturadas. O melhor ajuste dos dados experimentais foi encontrado com os modelos de BET e GAB. A secagem foi conduzida em um secador vertical de bandejas e delineada de acordo com um planejamento experimental (22), tendo como fatores: velocidade do ar (0,5, 0,75 e 1 m/s) e temperatura (60, 75 e 90 °C), apresentando bons
ajustes ao modelo exponencial (R2 > 99.9%). As respostas do planejamento avaliadas foram relacionadas a algumas propriedades tecnológicas
das fibras, como a capacidade de absorção em água e óleo e o volume de intumescimento. Uma vez que essas propriedades apresentaram altos níveis, os resíduos de limão podem ser utilizados para aumentar o conteúdo de fibras dos alimentos, resultando em um benefício nutricional a mais para o consumidor.
Palavras-chave: resíduo; limão siciliano; isotermas de dessorção; secagem convectiva; fibra alimentar; propriedades tecnológicas.
Abstract
In this study, the effect of the process variables of the air-drying of Sicilian lemon residues on some technological properties of the fibers produced was studied. The determination and modeling of desorption isotherms were used to establish the equilibrium moisture content at 60, 75, and 90 °C using the static method with 8 saturated salt solutions. The best fit was obtained with BET and GAB models. The drying process was conducted in a vertical tray dryer and delineated according to a central composite experimental design (22) using the following
as factors: air velocity (0.5, 0.75 and 1 m/s) and temperature (60, 75, and 90 °C), and it presented a good fit to the exponential model (R2 > 99.9%). The experimental design responses evaluated were the technological properties of the fibers: water-holding, oil-holding, and
swelling capacity. Since these properties were present in high levels, the lemon residues could be used to increase content of fibers in foods resulting in the addition of nutritional benefits for the consumers.
2 Materials and methods
2.1 Material preparation
The Sicilian lemon (Citrus limón L. Burm) was cultivated by the Dois Irmãos S.A. farm, located in the city of Araraquara, Brazil, and the solid residue was produced in pilot scale using the standardized method (extractor, mill, and press) in the amount of 10 kg and stored at 10 °C for 1 day until the drying step. Firstly, the juice was separated in a citrus extractor (Centenario, model Otto 1800, Limeira, Brazil), and the solid residue was wet milled in a knife mill (Tigre, model Q4 inox, São Paulo, Brazil) and a 19 mm sieve to reduce particle size. In the following step, to inactivate enzymes and remove sugars, the bagasse was washed twice by agitation of 250 rpm. It was first washed with ethanol solution at 80% and then with water to remove the ethanol solution. The bagasse was pressed by a helical press reaching 85% of moisture, in wet base. This material was used to determine desorption isotherms used in the drying experiments. The last step to produce fibers was dry milling with a single passage through a knife mill (Marconi, model MA-340).
2.2 Experimental procedure
Using data from the literature (GREENSPAN, 1977), moisture desorption isotherms were determined at temperatures of 60, 75, and 90 °C by using the standard gravimetric static methodology, which includes the selection of 8 saturated salt solutions, which, in turn, provide different relative humidity ranging from 10 to 90% (LiCl, KF, MgCl2, NaBr, KI, NaNO3, NaCl and KCl). Triplicate samples of 3 g (+ 0.0001 g) each were weighed in alumni crucibles and stored in glass jars containing saturated salt solution and taken to an oven (Fanem, model 320-SE, São Paulo, Brazil) which was kept at 60, 75, and 90 °C. The samples were weighed on an analytical balance (Bosch, model SAE 200, Brazil) in regular intervals of time until the sample The main technological steps to produce fruit fibers are: wet
milling, washing, drying, and dry milling. Drying is the main and most expensive step in dietary fiber production. It improves the fiber shelf life and reduces both the volume of packaging and the transport costs (LARRAURI, 1999).
Different drying methods could be used to produce citrus fiber, such as double drum dryer and tray dryer. According to Larrauri (1999), the first is the most adequate when considering both capital and operating costs. Nevertheless, the quality of the product is questionable because of agglomeration and/or excessive darkening of the product. Several studies about the drying process of citrus peels have recently been conducted. Garau et al. (2006) studied the drying of orange peel in a laboratory scale dryer; Carsky (2007) designed a fluidized bed dryer for industrial scale; Langrish (2007) investigated the drying behavior of edible fibers in a drying tunnel.
The quality of preserved foods depends upon the moisture content, moisture migration, and moisture uptake by the food material during storage. The equilibrium moisture content can be defined as the point when the vapor pressure of water present in the food equals that of its surroundings. The relationship between the equilibrium moisture content and the corresponding relative humidity at a constant temperature yields the so-called moisture sorption isotherm (BASU; SHIVHARE; MUJUMDAR, 2006).
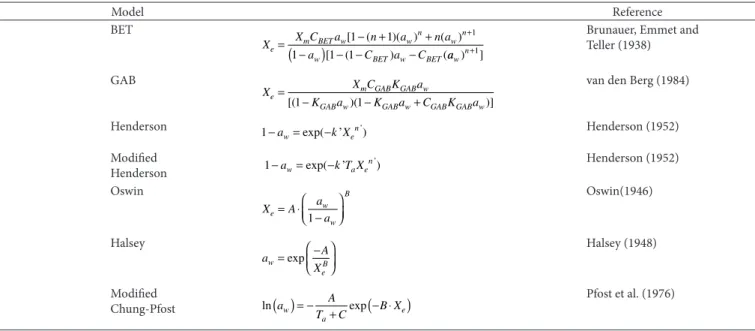
Some of the widely used mathematical models to predict sorption isotherm are shown in Table 1.
The aim of this work was to study the effect of the process variables of the air-drying of Sicilian lemon residues by-products on some technological properties of the fibers produced, such as water-holding, oil-holding, and swelling capacity. In addition, in order to evaluate the drying process, desorption isotherms of the residue were determined.
Table 1. Mathematical models of sorption isotherms of water.
Model Reference
BET
X X C a n a n a
a C a C
e
m BET w w
n w
n
w BET w BET
= − + + −
(
)
− − − + [ ( )( ) ( ) [ ( ) ( 1 11 1 1
1
a a w
n )+1]
Brunauer, Emmet and Teller (1938)
GAB
X X C K a
K a K a C K a
e
m GAB GAB w
GAB w GAB w GAB GAB w =
− − +
[(1 )(1 )]
van den Berg (1984)
Henderson 1−a = −k X
w e
n
exp( ’ ’) Henderson (1952)
Modified Henderson
Henderson (1952)
Oswin
X A a
a e w w B = ⋅ − 1 Oswin(1946) Halsey a A X w e B = − exp Halsey (1948) Modified
Chung-Pfost ln a A exp
T C B X w a e
( )
= − +(
− ⋅)
Drying process
After discovering the best desorption equation, including the temperature parameters, the values of relative humidity measured, under each drying condition, on the best sorption equation were used to calculate the equilibrium moisture content. The equilibrium moisture content could be obtained by drying curves; however, it was not possible to precisely determine it due to low values. The moisture ratio (Y) during the drying experiments was calculated using the following Equation 3:
Y X X
X X
t e
o e
= −−
(3)
The experimental results for the moisture ratio versus drying time were fitted to a simplified expression of a semi-theoretical model, the exponential model Equation 4, by a non-linear regression analysis (using Statistica 5.0). This model, firstly suggested by Lewis (1921), assumes that all the resistances to moisture transfer are in the boundary layer considering the insignificant internal resistance.(Equation 4)
Y=exp
( )
−kt (4)Dry milling
The solid residue was dried up to 10% of moisture, w.b., and it was then milled with a single passage through a knife mill (Marconi, model MA-340) and fibers of 0.15 a 0.6 mm were obtained. Fibers were stored in closed glass containers until the determination of the technological properties.
2.6 Technological properties
Water-holding capacity (WHC)
The water-holding was determined according to the methodology proposed by Anderson, Conway and Pfeifer (1969). One gram of fiber was weighed, in triplicate, placed in a centrifuge tube (50 mL), and suspended in 25 mL of distillated water. It was stirred (Phoenix, model AP-56, Araraquara, Brazil) for half an hour, and afterwards it was centrifuged (Beckman Coulter, model Allegra 25-R, Esalab, São Paulo, Brazil) at 2500 rpm for 10 minutes. The supernatant was removed and the weight of the pulp was recorded. The water-holding Capacity (g water/g dry solid) was calculated according to Equation 5:
WHC (g/g) mass centrifuged pulp mass initial sample
= (5)
Oil-holding capacity (OHC)
The Oil-holding capacity was determined according to the methodology proposed by Anderson, Conway and Pfeifer (1969). One gram of fiber was weighed, in triplicate, placed in a centrifuge tube (50 mL), suspended in 25 mL of rapeseed oil, and stirred (Phoenix, model AP-56, Araraquara, Brazil) for half an hour. Finally, it was centrifuged (Beckman Coulter, model Allegra 25-R, Esalab, São Paulo, Brazil) at 2500 rpm for 10 minutes. The supernatant was removed, and the weight of the weight became constant. The moisture content was determined
in order to get the solid dry mass.
2.3 Drying equipment
The tests were carried out at air temperatures varying from 60 to 90 °C and air velocities from 0.5 to 1.0 m/s. The dryer system consisted of a vertical airflow through trays of 300 × 300 × 50 mm with 6 mesh sieves and a centrifugal fan capacity of 40 m³/minute. For the air heating, three electric resistances were utilized (total potency of 13.500 W divided into 3 regions of 4.500 W), which could be operated independently and controlled by a digital thermostat. The drying air velocity was controlled by a valve located at the fan suction, and it was measured using a digital anemometer (Lutron, model AM-4202, USA) placed in the air tube exit. Additionally, a thermo hygrometer (Testo, model 635, Campinas, Brazil) was used in order to measure the dry bulb temperature, as well as the drying air humidity. Initially, 500 g of the residue was weighed using a semi-analytical balance (Marte, model AS 2000, São Paulo, Brazil). Weighing intervals of 5 minutes were used during the first hour of the process and then 15 minutes intervals were used until the sample weight varied up to 0.5 g. At the end of the experiment, the moisture content of the samples was determined.
2.4 Moisture content
The moisture content was determined by drying the samples in a vacuum oven (Sulab, model EST 920, Indaiatuba, Brazil) at 70 °C according to the AOAC method no. 934.06 (ASSOCIATION OF OFFICIAL ANALYTICAL CHEMISTS, 1990) after 48 hours (isotherms) or 24 hours (drying curves).
2.5 Mathematical modeling
Desorption data
Models were fitted by a non-linear regression analysis (using Excel 2000’s Solver program) by minimizing the sum of the quadratic residues obtained between the experimental and calculated values. The determination coefficient (R2) and
the mean relative error (E), calculated according to Equation 1, were used to evaluate the goodness of fit.
E N
V V
V P
i N
= −
=
∑
100 0
0 1
(1)
The equilibrium moisture content was calculated according to Equation 2:
X m m
m e
e s
s
= − (2)
where Xe is the equilibrium moisture content, me is the
mass sample when the equilibrium is reached, and msis the solid dry mass.
Experimental design
A 22 central composite design with three center points was
used to evaluate the effect of the air temperature and the air velocity on the drying constant (k) and the WHC, OHC, and SC
monolayer moisture content); and CGAB and KGAB are energy constants. The Guggenheim constant (CGAB) is related to the difference of the chemical potential in the upper layers and in the monolayer, whereas KGAB is related to this difference in the sorbate’s pure liquid state and in the upper layers. Thus, the
KGAB parameter is, practically with no exception, proximal but less than unity. This fact constitutes a definitive characteristic of this isotherm (TIMMERMANN; CHIRIFE; IGLESIAS, 2001). The GAB model was the best option for sorption isotherms of lemon peel, determined at 60, 75, and 90 °C. Some authors found similar results, such as García-Pérez et al. (2008), who determined that the GAB model was the best option for sorption pulp was recorded. The oil-holding capacity (g oil/g dry solid)
was calculated according to Equation 6:
OHC mass centrifuged pulp mass initial sample
= (6)
Swelling capacity (SC)
Swelling reflects the capacity of the material to expand itself. The analysis was performed according to the methodology proposed by Gould et al. (1989), during which 1 g of sample was hydrated in a graduated cylinder. The samples were dispersed with magnetic stirring (Fisatom, model 752, São Paulo, Brazil) for 30 minutes. They were then covered and left undisturbed at room temperature overnight. The settled volume occupied by the sample was recorded. The swelling capacity was calculated by taking the difference between the initial and the final volume of the sample divided by the original sample’s dry weight (mL.g-1 dry solid).
3 Results and discussion
3.1 Analysis of desorption data
Desorption isotherms of lemon peel determined at 60, 75, and 90 °C are plotted in Figure 1.
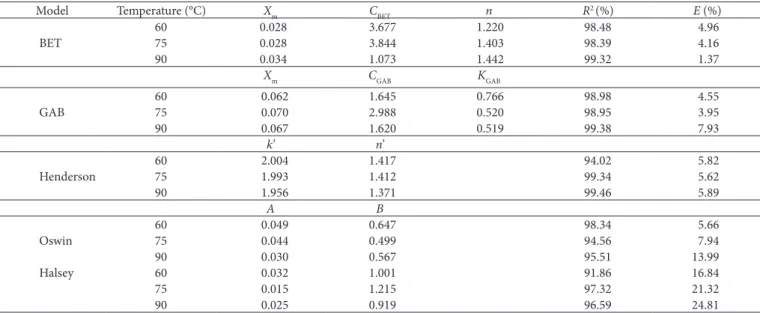
It was observed that the equilibrium moisture content decreases with the increase of temperature for values of water activity higher than 0.5. The estimated model parameters, without considering the influence of temperature, and the statistical results are shown in Table 2.
The GAB and BET models present the best fit with values of R2 > 98% and E < 8%. The parameters of the GAB isotherm
model have physical meanings: W is the equilibrium moisture content; the Xm parameter is the water content corresponding to
the saturation of all primary sites by one water molecule (namely
Table 2. Parameter values of the models (without temperature parameters).
Model Temperature (°C) Xm CBET n R2 (%) E (%)
60 0.028 3.677 1.220 98.48 4.96
BET 75 0.028 3.844 1.403 98.39 4.16
90 0.034 1.073 1.442 99.32 1.37
Xm CGAB KGAB
60 0.062 1.645 0.766 98.98 4.55
GAB 75 0.070 2.988 0.520 98.95 3.95
90 0.067 1.620 0.519 99.38 7.93
k’ n’
60 2.004 1.417 94.02 5.82
Henderson 75 1.993 1.412 99.34 5.62
90 1.956 1.371 99.46 5.89
A B
60 0.049 0.647 98.34 5.66
Oswin 75 0.044 0.499 94.56 7.94
90 0.030 0.567 95.51 13.99
Halsey 60 0.032 1.001 91.86 16.84
75 0.015 1.215 97.32 21.32
90 0.025 0.919 96.59 24.81
higher than the Ft (9.2). This result indicates that the variation of the data is explained by the regression and not by the residue, and thus the model can be considered predictive. In Figure 5, the flat curve shows that the drying constant increased with the increase of air temperature, which was possible due to the] improved mass transfer from the humid material to drying air. The drying constant can be represented by Equation 7:
k=1 30 10. ⋅ 3 + 4 01 10. ⋅ 4T−3 24 10. ⋅ 4v + 7 43 10. ⋅ 5⋅ ⋅T v (7)
Garau et al. (2006) proposed a mathematical model to simulate drying curves of orange skin into circular slabs (3.10-2 m of diameter) taking into account the sample shrinkage
during the drying process and the influence of the local moisture content on the effective diffusion coefficient with higher determination coefficient (99.5%) and lower mean relative error (6.2%). The values of the effective diffusion coefficient ranged from 0.81.10-10 m2/s to 5.11.10-9 m2/s within the interval of
temperatures and moisture contents comprised between 30 and 90 °C, and 0.25 kg and 3.66 kg water/kg dry mass.
Carsky (2007) carried out laboratory drying tests in a fluidized bed dryer with lemon peels crushed into three different sizes (3, 6, and 9 mm) and provided drying times of 15, 20, and 40 minutes at 150 °C, and 30, 35, and 60 minutes at 100 °C, to achieve the required final moisture content of peels (10%). isotherms of lemon peel at 20, 30, 40, and 50 °C (Xm = 0.064,
0.069, 0.062, and 0.049 kg water/kg dry solid; CGAB = 4.88, 1.37, 2.30 and 4.50; KGAB = 1) and Garau et al. (2006) found similar values of GAB parameters for sorption isotherms of orange peel determined at 25 °C (Xm = 0.085 kg water/kg dry solid,
CGAB = 2.374, KGAB = 0.982).
Desorption isotherms were also modeled including the influence of temperature. The estimated model parameters and statistical results are shown in Table 3 and Figure 2, in which the modified Chung-Pfost model presented the best fit (R2 = 95.9% and E = 14.2%).
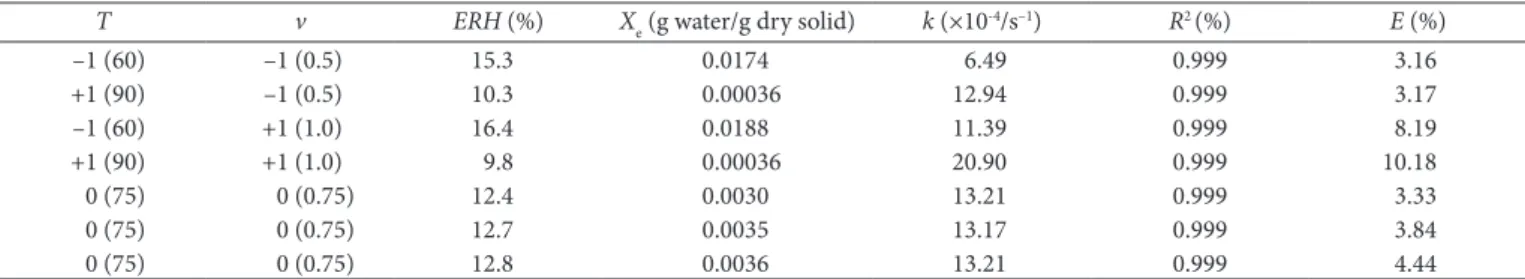
3.2 Drying kinetics
In Table 4, the equilibrium moisture content (Xe) was
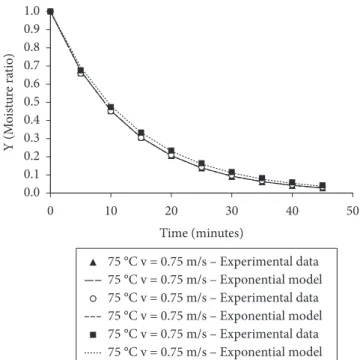
calculated using the equilibrium relative humidity (ERH), measured by a thermohygrometer, and the temperatures, measured for each drying condition, using the modified Chung-Pfost model. Next, the moisture ratio was calculated using Equation 3 and the values of equilibrium moisture content calculated. Figure 3 shows the variation of moisture ratio as a function of the time for working temperatures of 60 and 90 °C and air velocities of 0.5 and 1 m/s, and Figure 4 shows the temperature of 75 °C and air velocity of 0.75 m/s. All drying curves presented a clear exponential tendency; it was observed that the drying time decreased when the temperature increased.
In addition, Table 4 shows the values of drying constant (k), according to the experiments of the central composite design 22, varying from 6.49 to 20.90.10-4/s, and it also shows high
determination coefficients (R2 > 99.9%), which indicates a good
fit. The estimated effects of the factor’s temperature and velocity on the response drying constant (k), analyzed at 95% confidence level, showed that the linear factor’s temperature and velocity were significant (p ≤ 0.05). The test for adequacy and fitness by analysis of variance (ANOVA) presented high determination coefficient values (R2= 99.87%), where the F
c (770.14) value was
Table 3. Parameter values of the models (with temperature para-meter).
Model R2(%) E (%)
A C B
Mod. Chung-Pfost 144.09 –284.52 26.21 95.91 14.24
k’ n’
Mod. Henderson 1.99 1.41 93.16 19.03
60 75
80
0.02 0.2
0.04 0.4
0.06 0.6
0.08 0.8
0.10 1.0
0.12
Temperature (°C) Xe
(g water/g dry solid)
W
at
er A
ct
vi
ty (a
w
)
0.126 0.207 0.287 0.367 0.447 0.528 0.608 0.688 0.768 0.849 above
Figure 2. Comparison of the experimental and predicted equilibrium moisture content obtained by fitting the modified Chung-Pfost model to the data (with temperature parameters).
Table 4. Equilibrium relative humidity (ERH), equilibrium moisture content (Xe), drying constant (k) values, obtained by fitting the Exponential model, determination coefficient (R2), and mean error relative (E) under different conditions of temperature (T) and air velocity (v), codified.
T v ERH (%) Xe(g water/g dry solid) k (×10-4/s–1) R2 (%) E (%)
–1 (60) –1 (0.5) 15.3 0.0174 6.49 0.999 3.16
+1 (90) –1 (0.5) 10.3 0.00036 12.94 0.999 3.17
–1 (60) +1 (1.0) 16.4 0.0188 11.39 0.999 8.19
+1 (90) +1 (1.0) 9.8 0.00036 20.90 0.999 10.18
0 (75) 0 (0.75) 12.4 0.0030 13.21 0.999 3.33
0 (75) 0 (0.75) 12.7 0.0035 13.17 0.999 3.84
resistance to moisture transport in the residue of Sicilian lemon is relatively small. This behavior can be explained due to higher contents of fibers in the composition of the material. The drying residue, up to 0.10 g water/g dry solid, for all experiments did not cause darkening of the product.
Marín et al. (2007) obtained high amounts of soluble (17.15%) and insoluble (64.56%) fibers from the solid residue of Citrus limón (L.) Burm through juice production. Langrish (2007) observed that the drying process of sugar beet or citrus fibers in a vertical tray dryer is more limited by the moisture movement through the bed of solids than the moisture transport within the fiber material itself. Nevertheless, the source of the cellulose (sugar beet or citrus) does not seem to have a substantial effect on the behavior of the drying.
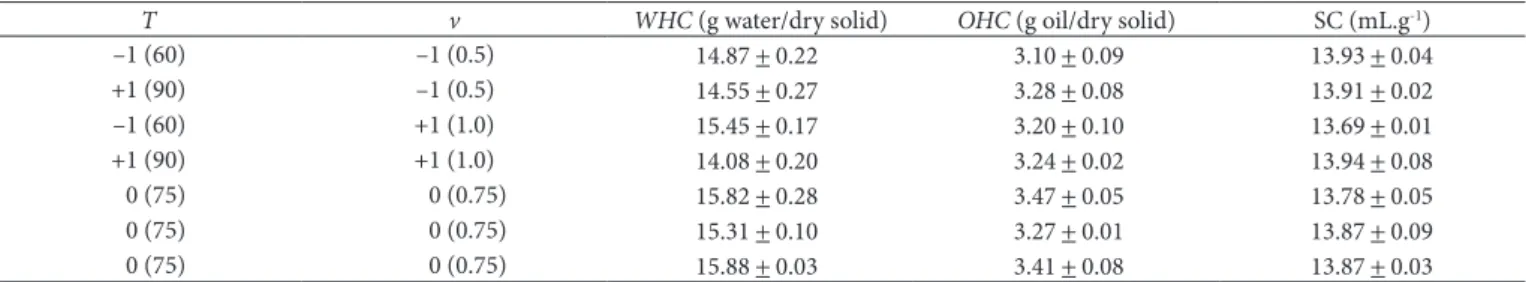
3.3 Technological properties
Table 5 shows the values of the responses for technological properties. The effects of the temperature and velocity factors on the WHC, OHC, and SC responseswere not significant at a 95%, confidence level; therefore, the values to be considered are the global mean of WHC of 15.1 g water/g dry solid, OHC
of 3.3 g oil.g–1 dry solid, and SC of 13.9 mL.g-1 dry solid.
The water-holding Capacity presented high values indicating that this material could be used as a functional ingredient to reduce calories, avoid syneresis, and modify the viscosity and texture of formulated foods (GRIGELMO-MIGUEL; MARTÍN-BELLOSO, 1999). Lario et al. (2004) obtained a maximum of 12.6 g water/g dry solid for the Mesero lemon peel with a particle size higher than 0.9 mm.
The oil-holding Capacity (OHC) is a property exploited in foods (cooked meat products) to enhance their retention of fat, which is normally lost during cooking, in order to increase flavor retention and technological yield (THEBAUDIN et al., 1997). Lario et al. (2004) obtained higher values than those of
Figure 3. Comparison of the experimental and predicted moisture ratios during the drying of Sicilian lemon residue obtained by fitting the Exponential model to the data at temperatures of 60 and 90 °C and air velocity of 0.5 and 1 m/s-1.
Figure 4. Comparison of the experimental and predicted moisture ratio during the drying of Sicilian lemon residue obtained by fitting the Exponential model to the data at temperature of 75 °C and air velocity of 0.75 m/s.
Figure 5. Influence of temperature (°C) and air velocity (m.s-1) on
drying constant (k) for Sicilian lemon residue after convective dryer until 10% moisture in wet basis.
4 Conclusions
Desorption isotherms presented best fitting to GAB and BET models (R2 > 98% and E < 8%) and, considering the
influence of temperature, to the modified Chung-Pfost model (R2= 95.9% and E = 14.2%). The experimental data of drying
curves presented good fitting to the exponential model with drying constant (k) varying from 6.49 to 20.90.10-4/s with
higher determination coefficients (R2 > 99%) and lower mean
relative error (E < 10%). The technological properties of the fibers showed no differences in relation to the drying process operational conditions, and due to their high values, good appearance, and light color, they could be utilized in other formulations of foods.
Acknowledgment
The authors gratefully acknowledge CP Kelco (Limeira, Brazil) for preparing the material and CNPq for providing financial support.
References
ALESON-CARBONELL, L. et al. Characteristics of beef burger as influenced by various types of lemon albedo. Innovative Food Science & Emerging Technologies, v. 6, n. 2, p. 247-255, 2005. ANDERSON, R. A.; CONWAY, H. F.; PFEIFER, V. F. Gelatinization
of corn grits by roll and extrusion cooking. Cereal Science Today, v. 14, n. 1, p. 11-12, 1969.
ASSOCIAÇÃO BRASILEIRA DOS EXPORTADORES DE CÍTRICOS - ABECITRUS. In: Subprodutos da laranja. Disponível em: < http:// www.abecitrus.com.br >. Acesso em: 27 ago. 2007.
ASSOCIATION OF OFFICIAL ANALYTICAL CHEMISTS - AOAC. Official Methods of Analysis. 15th ed. Arlington, 1990.
BASU, S.; SHIVHARE, U. S.; MUJUMDAR, A. S. Models for sorption Isotherms for foods: a review. Drying Technology, v. 24, n. 8, p. 917-930, 2006.
BRUNAUER, S.; EMMET, T. H.; TELLER, F. Adsorption of gases in multimolecular layers. Journal of the American Chemical Society, v. 60, n. 2, p. 309-319, 1938.
CARSKY, M. Design of a dryer for citrus peels. Journal of Food Engineering, v. 87, n. 1, p. 40-44, 2007.
CÉSPEDES, M. A. L. Otimização do processo de extrusão da polpa de laranja: modificação das propriedades funcionais e sua aplicação como fonte de fibra alimentar. 1999. 163 p. Tese (Doutorado) – Universidade Estadual de Campinas, Campinas, 1999.
the present study, about 6.7 g oil/g dry solid for Mesero lemon peel with particles higher than 0.9 mm. This can be explained because smaller fibers (0.15 to 0.6 mm) are associated with lower
OHC, according to Sangnark and Noomhorm (2003).
Swelling is related to the inbibing and swelling characteristics of fibers in water, and is important not only in food application, but also in human gastrointestinal function. Higher values were obtained when compared to 9 mL.g-1
for apples, 5.5 mL.g-1 for peas, and 10 mL.g-1 for sugar beets
(PRAKONGPAN; NITITHAMYONG; LUANGPITUKSA, 2002). Santana (2005) found a maximum of 15 mL.g-1 for
different orange fractions and Céspedes (1999) found 16 mL.g-1
for orange pulp without extrusion.
3.4 Nomenclature
Table 5. Experimental data for the technological properties fibers WHC, OHC, and SC under different conditions of temperature (T) and air velocity (v).
T v WHC (g water/dry solid) OHC (g oil/dry solid) SC (mL.g-1)
–1 (60) –1 (0.5) 14.87 + 0.22 3.10 + 0.09 13.93 + 0.04
+1 (90) –1 (0.5) 14.55 + 0.27 3.28 + 0.08 13.91 + 0.02
–1 (60) +1 (1.0) 15.45 + 0.17 3.20 + 0.10 13.69 + 0.01
+1 (90) +1 (1.0) 14.08 + 0.20 3.24 + 0.02 13.94 + 0.08
0 (75) 0 (0.75) 15.82 + 0.28 3.47 + 0.05 13.78 + 0.05
0 (75) 0 (0.75) 15.31 + 0.10 3.27 + 0.01 13.87 + 0.09
0 (75) 0 (0.75) 15.88 + 0.03 3.41 + 0.08 13.87 + 0.03
A, B, C, CBET, CGAB, KGAB, k’, n, n’
model parameters
aw water activity
E mean relative error (%)
ERH equilibrium relative humidity (%)
k drying constant (/s)
me mass sample when reached equilibrium (g) ms solid dry mass (g)
N number of sampling times
OHC oil-holding capacity (g oil/g dry solid) R universal gas constant (J/mol.K) R2 determination coefficient (%)
SC swelling capacity (ml.g-1)
T air temperature (codified)
t drying time (minute)
Ta absolute temperature (K) v air velocity (codified)
V0 observed values
VP predicted values
WHC water-holding capacity (g water/g dry solid) Xe equilibrium moisture content
Xe equilibrium moisture content (g water/g dry solid)
Xe equilibrium moisture content (g water/g dry solid)
Xm monolayer moisture content (g water/g dry solid) Xo initial moisture content (g water/g dry solid)
Xt moisture content at a time t (g water/g dry solid)
MARÍN, F. R. et al. By-products from different citrus processes as a source of customized functional fibers. Food Chemistry, v. 100, n. 2, p. 736-741, 2007.
OSWIN, C. R. The kinetics of package life. III isotherm. Journal of the Society of Chemical Industry, v. 65, n. 12, p. 419-421, 1946. PÉREZ, M. F.; SÁNCHES, J. L. R. Tecnología para la obtención de fibra
dietética a partir de materias primas regionales. La experiencia en Cuba. In: LAJOLO, F. M. et al. (Eds.). Fibra dietética en Iberoamérica: tecnología y salud: obtención, caracterización, efecto fisiológico y aplicación en alimentos. São Paulo: Livraria Varela, 2001, p. 211-236.
PFOST, H. B. et al. Summarizing and reporting equilibrium moisture data for grains. Saint Joseph: American Society Agricultural Engineering, 1976.
PRAKONGPAN, T.; NITITHAMYONG, A.; LUANGPITUKSA, P. Extraction and application of dietary fiber and cellulose from pineapple cores. Journal of Food Science, v. 67, n. 4, p. 1308-1313, 2002.
SANGNARK, A.; NOOMHORM, A. Effect of particles size on fuctional properties of dietary fiber prepared from sugarcane bagasse. Food Chemistry, v. 80, n. 2, p. 221-229, 2003.
SANTANA, M. F. S. Caracterização físico-química de fibra alimentar de laranja e maracujá. 2005. 168 p. Tese (Doutorado) – Universidade Estadual de Campinas, Campinas, 2005.
SENDRA, E. et al. Incorporation of citrus fibers in fermented milk containing probiotic bacteria. Food Microbiology, v. 25, n. 1, p. 13-21, 2008.
THEBAUDIN, J. Y. et al. Dietary fibers: nutritional and technological interest. Trends in Food Science & Technology, v. 8, n. 2, p. 41-48, 1997.
TIMMERMANN, E. O.; CHIRIFE, J.; IGLESIAS, H. A. Water sorption isotherms of foods and foodstuffs: BET or GAB parameters? JJournal of Food Engineering, v. 48, n. 1, p. 19-31, 2001. van der BERG, C. Description of water activity of food engineering
purposes by means of the GAB model of sorption. In: McKenna, B. M. (Ed.). Engineering and Foods. London: Elsevier, 1984. p. 311-321.
FÉRNANDEZ-LOPEZ, J. et al. Application of functional citrus by-products to meat by-products. Trends in Food Science & Technology, v. 15, n. 3-4, p. 176-185, 2004.
GARAU, M. C. et al. Drying of orange skin: drying kinetics modeling and functional properties. Journal of Food Engineering, v. 75, n. 2, p. 288-295, 2006.
GARCÍA-PÉREZ, J. V. et al. Water sorption isotherms for lemon peel at different temperatures and isosteric heats. LWT - Food Science Technology, v. 41, n. 1, p. 18-25, 2008.
GOULD, M. J. et al. High-fiber, noncaloric flour substitute for baked foods: properties of alkaline peroxide treated lignocelluloses. Cereal Chemistry, v. 66, n. 3, p. 201-205, 1989.
GREENSPAN, L. Humidity fixed points of binary saturated aqueous solutions. Journal of Research of the National Bureau of Standards – Physics and Chemistry, v. 81, n. 1, p. 89-96, 1977. GRIGELMO-MIGUEL, N.; MARTÍN-BELLOSO, O. Characterization
of dietary fiber from orange juice extraction. Food Research International, v. 31, n. 5, p. 355-361, 1999.
HALSEY, G. Physical adsorption on uniform surfaces. Journal of Chemical Physics, v. 16, n. 10, p. 931-937, 1948.
HENDERSON, S. M. A basic concept of equilibrium moisture. Agricultural Engineering, v. 33, n. 1, p. 29-32, 1952.
KIMBAL, D. A. Citrus processing, a complete guide. 2nd ed.
Gaithersburg: Aspen Publishers, 1999.
LANGRISH, T. A. G. Characteristic drying curves for cellulosic fibers. Chemistry Engineering Journal, v. 137, n. 3, p. 677-680, 2007. LARIO, Y. et al. Preparation of high dietary fiber powder from
lemon juice by-products. Innovative Food Science & Emerging Technologies, v. 5, n. 1, p. 113-117, 2004.
LARRAURI, J. A. New approaches in the preparation of high dietary fiber powders from fruit by-products. Trends inFood Science & Technology, v. 10, n. 1, p. 3-8, 1999.