Evaluating the coherence of Take-the-best in structured
environments
Michael D. Lee
∗Shunan Zhang
†Abstract
Heuristic decision-making models, like Take-the-best, rely on environmental regularities. They conduct a limited search, and ignore available information, by assuming there is structure in the decision-making environment. Take-the-best relies on at least two regularities:diminishing returns, which says that information found earlier in search is more important than information found later; andcorrelated information, which says that information found early in search is predictive of information found later. We develop new approaches to determining search orders, and to measuring cue discriminability, that make the reliance of Take-the-best on these regularities clear, and open to manipulation. We then demonstrate, in the well-studied German cities environment, and three new city environments, when and how these regularities support Take-the-best. To do this, we focus not on the accuracy of Take-the-best, as most previous studies have, but on a measure of its coherence as a decision-making process. In particular, we consider whether Take-the-best decisions, based on a single piece of information, can be justified because an exhaustive search for information is unlikely to yield a different decision. Using this measure, we show that when the two environmental regularities are present, the decisions made by limited search are unlikely to have changed after exhaustive search, but that both regularities are often necessary.
Keywords: Take-the-best, process coherence, environment structure, fast and frugal heuristics, diminishing returns.
1
Introduction
The 1992 Olympics was the first time professionals from the US NBA league were allowed to play in the men’s basketball competition. The US “Dream Team”, filled with stars like Michael Jordan, Magic Johnson, Larry Bird, Charles Barkley and Patrick Ewing, was one of the most dominant teams ever assembled for any sporting competition. Their closest game was a 117–85 victory in the final over Croatia, and head coach Chuck Daly never felt the need to call a timeout during the tournament.
Making predictions about the outcomes of sporting contests is notoriously difficult, but the Dream Team made some predictions easy. Imagine trying to predict whether or not the US would beat its first opponent in the tournament, Angola, and examining the players in each team, beginning with the starting five, and moving to the bench players. At some point early in the US list—maybe after Jordan, Johnson, Bird, Barkley and Ewing—there would be no need to look further. No matter who else was on the US roster, or the Angolan roster, the outcome
We thank Ben Newell for very helpful comments on an earlier ver-sion, and Robin Hogarth, Konstantinos Katsikopolous, and an anony-mous reviewer for helpful criticism. Support from the Air Force Of-fice of Scientific Research Award FA9550-11, and Australian Research Council Grant DP110100797, are gratefully acknowledged.
∗Department of Cognitive Sciences, University of California Irvine.
Irvine, CA, 92697-5100. Email: [email protected].
†University of California Irvine
is already clear. The Dream Team also made predictions easy during the course of games. With about 5 minutes to play in the first half against Angola, the US led 45 to 8. It was clear the US would win by a large margin, without needing to watch the rest of the game.
Both of these decisions about a US victory are
non-compensatory, because not all of the available
informa-tion is used, and so the ignored informainforma-tion cannot com-pensate for—that is, change the decision based on—the information that is used. The remaining player rosters are not examined, and the rest of the game is not watched. Yet the decision to forego further information seems sen-sible in both cases. It is not a reaction to limited time or cognitive resources, but a recognition of the nature of the environment in which decision-making is taking place. The first few US players are so good that there are no other players who could lead Angola to victory, and the first half performances of the teams are highly predictive of second half performances.
1.1
Fast and frugal heuristics
The adaptive value of non-compensatory decisions lies at the heart of the “fast and frugal” approach to model-ing cognition (Gigerenzer & Goldstein, 1996; Gigeren-zer, Todd, & the ABC Research Group, 1999). This ap-proach has developed simple and effective heuristic mod-els of human judgment and choice, built around two
pelling ideas. The first idea is that decision-making needs to befast, because the world is competitive. A basic rea-son for making decisions is to acquire resources, which are often scarce, and often contested. Making quick deci-sions usually offers a competitive advantage in these sit-uations.
The second idea is that good decision-making mech-anisms should be frugal, in the sense of being simple, because the world is changeable. A complicated decision making strategy will usually work well in the environ-ment within which it was developed, but will often fail in new or altered environments. Decision making that over-fits, in this sense, is prone to failure when asked to generalize. Because real-world decision environments are continually changing, both quickly and slowly, and along many dimensions, simple decision making strate-gies that focus on the few stable features of the environ-ment are likely to be the ones that succeed. Simplicity makes these decision strategies robust, just as a machine with few moving parts is unlikely to break.
As Gigerenzer et al. (1999) emphasize, neither of these motivating principles are about cognitive limitations. Fast and frugal heuristics are effective to the extent they seize on the opportunities presented by environmental regular-ities. They are rooted in properties of environments, not limits of memory, bounds on cognitive processing capa-bilities, or other internal constraints. What is important is that the heuristics mesh with their environment, allow-ing limited capacity cognitive processes to function effec-tively (Simon, 1956, 1990; Todd & Gigerenzer, 2003).
Two of the most important environmental regularities are highlighted in making predictions about the Dream Team. First, if the environment is searched in such a way that additional information providesdiminishing returns, with less useful information being found as search pro-gresses, it may be sensible to make an early decision. This is what happens when search of the basketball game starts with the most important information, examining the players in the starting five, before continuing to less im-portant information, in the form of the bench players. Second, if there iscorrelated information, so that what is found early in search is predictive of what will be found later, it can also be sensible to make an early decision. This is what happens in watching the basketball game. The score in the first half of the game provides informa-tion that is likely to be highly predictive of the score in the second half of the game.
The basic idea of fast and frugal heuristics is that hu-man decision-making exploits these sorts of possibili-ties. By assuming the environment has structure, non-compensatory decision processes can be used that are fast, robust and accurate.
1.2
Overview
In this paper, we study one of the most prominent fast and frugal heuristics—the Take-the-best model of decision-making—in terms of the diminishing returns and corre-lated information environmental regularities. To do this, we analyze the Take-the-best model in a way that allows its behavior under different assumptions about the envi-ronment to be studied. We also extend the way heuristics like Take-the-best have previously been justified, focus-ing not on an outcome (or correspondence) measure of their decision accuracy, but on a process (or coherence) measure of whether more exhaustive search changes the decisions suggested by limited search. Using the widely-considered German cities environment, and three new city environments, we show that there are good grounds for the limited search assumed by Take-the-best, but only when both the environmental regularities are satisfied.
2
Environmental regularities and
Take-the-best
Take-the-best is perhaps the best developed fast and fru-gal heuristic (Gigerenzer & Goldstein, 1996; Gigerenzer et al., 1999). It chooses between two alternatives, each represented by a set of binary cues. Take-the-best says that people search these cues in a specific order, deter-mined by a measure called cue validity, and terminate search as soon as a discriminating cue is found.
To make clear the reliance of Take-the-best on the envi-ronmental regularity of diminishing returns, we develop a new approach to determining cue search orders. To make clear the reliance of Take-the-best on the environmental regularity of correlation information, we develop a re-fined measure of cue discriminability. Each of these the-oretical developments is best described in concrete terms, and so we introduce them in terms of the German cities environment used in our later evaluation.
2.1
German cities and three new
environ-ments
Take-the-best is to decide which of two cities, like Hamburg and Dortmund, has the larger population, based on their cues. We also developed three other city environments to test the generality of our conclusions. The new environments are based on cities in Italy, the United Kingdom, and the United States, and use the same sorts of cues as the orig-inal German cities environment. All three new environ-ments were collated in January 2012, and were completed before any of the analyses reported here were conducted. We report the basic details of these new environments, and the full datasets are are provided as supplementary materials along with this paper on the page for this issue: http://journal.sjdm.org/vol7.4.html.
For the Italian cities environment, we used the 149 cities with more than 50,000 people. We represented them in terms of 8 cues: whether they were the re-gional capital, whether they had a team in the Serie A soccer league, whether they had a team in the Serie B soccer league, whether they had a major rail station, whether they had an airport, whether they had a univer-sity, whether they were the national capital, and whether they were in the Po Valley (which we believe is com-monly understood to be the most populous area of Italy). For the US cities environment, we used the 74 cities with more than 250,000 people. We represented them in terms of 7 cues: whether they were the state capital, whether they had a major league sports team, whether they had a major airport, whether they had a metro system, whether they had been an exposition site, and whether they were the national capital.
For the UK cities environment, we used the 66 cities with more than 100,000 people. We represented them in terms of 6 cues: whether they were a national capi-tal, whether they had a major airport, whether they had a team in the premier league, whether they had a rail sta-tion, whether they were the county capital, and whether they had a university.
2.2
Measures of the environments
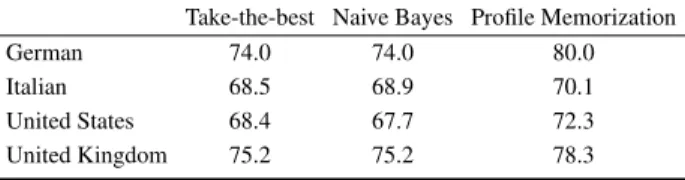
It is instructive to examine the performance of some basic decision-making mechanisms, on all four environments. This allows benchmark accuracies on the well-studied German cities environment to be compared to the new environments. We calculated the accuracy of Take-the-best, naive Bayes, and profile memorization methods for each environment, averaged across all possible city pairs in each case. Naive Bayes basically combines the evi-dence for all cues to make a decision, but assumes each cue provides independent evidence. The profile mem-orization uses the probability that a city represented by one set of cues will have a larger population than another city represented by a different set of cues, choosing the city with higher probability for each pair. The results
Table 1: The accuracy of Take-the-best, naive Bayes and profile memorization decision-making methods, evalu-ated on all possible city pairs in the four environments.
Take-the-best Naive Bayes Profile Memorization
German 74.0 74.0 80.0
Italian 68.5 68.9 70.1
United States 68.4 67.7 72.3
United Kingdom 75.2 75.2 78.3
are shown in Table 1. It is clear that the relative per-formance of these methods observed in the German cities environment is approximately the same in the new envi-ronments. Both Take-the-best and naive Bayes perform extremely similarly, and profile memorization provides a natural upper-bound on achievable accuracy. It is also clear that the new environments are similar to the Ger-man cities in the absolute levels of accuracy they support, ranging from about 68% to about 75%.
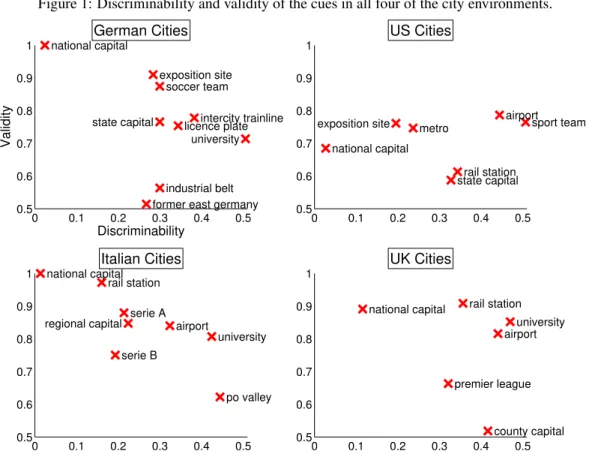
The two key measures associated with cues in our en-vironments are theirdiscriminability1 andvalidity.
Dis-criminability measures how often a cue discriminates be-tween stimuli, as state capital and industrial belt discrimi-nate between Hamburg and Dortmund. Validity measures how often a cue, given that it discriminates, belongs to the stimulus with the higher criterion value. Since Ham-burg has more people than Dortmund, being a state cap-ital is a valid cue for the comparison, but being in the industrial belt is not. Figure 1 shows the discriminability and validity of all of the cues in all four city environ-ments. Discriminability is naturally bounded between 0 and 0.5, while validity is naturally bounded between 0.5 and 1. So, for example, in the German cities environ-ment in the top-left panel of Figure 1, the national capital cue has low discriminability, because only Berlin has the cue, and so it only discriminates when Berlin is one of the cities in the paired comparison. But it has perfect va-lidity because, when it does discriminate, it always gives the correct answer, since Berlin is Germany’s most pop-ulous city. Meanwhile, the university cue has high dis-criminability, because about half the cities have univer-sities and half do not. But it has a validity of about 0.7, because cities without universities are sometimes more populous than cities with universities.
2.3
Balancing discriminability and validity
Take-the-best assumes that cues are searched in decreas-ing order of their validity. This corresponds to a strong
1We use “discriminability” as an exact synonym for the term
Figure 1: Discriminability and validity of the cues in all four of the city environments.
0 0.1 0.2 0.3 0.4 0.5
0.5 0.6 0.7 0.8 0.9 1
Discriminability
Validity
German Cities
soccer team
state capital
former east germany industrial belt
licence plateintercity trainline exposition site
national capital
university
0 0.1 0.2 0.3 0.4 0.5
0.5 0.6 0.7 0.8 0.9 1
US Cities
state capital
sport team airport metro
rail station exposition site
national capital
0 0.1 0.2 0.3 0.4 0.5
0.5 0.6 0.7 0.8 0.9 1
Italian Cities
regional capital serie A rail station
airport national capital
university serie B
po valley
0 0.1 0.2 0.3 0.4 0.5
0.5 0.6 0.7 0.8 0.9 1
UK Cities
national capital
airport
premier league rail station
county capital university
assumption about the environmental regularity of dimin-ishing returns, because it guarantees that those discrimi-nating cues with the most information are found earliest. It might be, however, that this assumption is too strong, and other search orders are used. One line of work that considers other search orders is presented by Todd and Dieckmann (2005). These authors develop and evaluate a number of heuristic methods for learning and adapting search orders. Another line of work considers ways of defining search orders that do not depend entirely on cue validity. In particular, cue discriminability is assumed to influence the order of search.
Discriminability focuses on finding information. Va-lidity focuses on information being highly important if it is found. Clearly, both are important, and it seems rea-sonable that both might influence search. Evidence from experimental investigations of search rules (e.g., Newell, Rakow, Weston, & Shanks, 2004; Rakow, Newell, Fay-ers, & Hersby, 2005) finds both discriminability and va-lidity can be relevant to search, with individual differ-ences and task constraints influencing how they combine to determine the order of search (e.g., Martignon & frage, 1999). Several authors (e.g., Martignon & Hof-frage, 1999; Newell et al., 2004) consider a “success mea-sure” that combines validity and discriminability so that
cues are ordered in terms of their ability to make accurate decisions in isolation from all other cues.
Another way to formalize how discriminability and va-lidity jointly influence search was introduced recently by Lee and Newell (2011). In their approach, the cue search order is determined by giving a weightwto the validity of each cue, the remaining weight1−wto discriminability.
The search order is then based on ordering cues accord-ing to the sum of these two weighted components. Set-tingw= 1therefore gives a validity based search, as for the original Take-the-best heuristic. Settingw= 0gives a discriminability based search, and intermediate values balance both measures in determining search order. This approach is well suited to our goals, since it defines a nat-ural continuum from validity-based to discriminability-based search, and so allows the adherence of search to the regularity of diminishing returns to be manipulated.
2.4
Extending discriminability to capture
correlation
contradic-tory or compensacontradic-tory evidence. This is again a strong as-sumption. There is empirical evidence that people some-times search in non-compensatory ways, but extend their consideration beyond the first discriminating cue. People sometimes look for two or three or more reasons to make a decision, even if they do not search exhaustively (e.g., Dhami, 2003).
A less extreme way to capture the idea of correlated in-formation in a heuristic like Take-the-best is to refine the cue discriminability measure. Correlated environments are those where the information provided by one cue is consistent with information provided by other cues. One way to measure this correlation is to break the traditional measure of discriminability into two parts. These parts measure whether or not a cue is consistent with other cues, in terms of the stimulus it favors when it discrim-inates. We call the consistent part the positive discrimi-nation rated+
, and the inconsistent part the negative dis-crimination rated−
.
Because they are new theoretical measures, we need to explain howd+andd−
are calculated, and this requires a bit more formality. If thekth cue discriminates in favor of stimulus A over stimulus B, the definition of cue valid-ity means that the log-odds evidence it provides in favor of stimulus A islog (vk/(1−vk))(Bergert & Nosofsky,
2007; Lee & Cummins, 2004). It is natural to express idence on the log-odds scale, because this allows the ev-idence contributed by different cues to be summed (e.g., Cover & Thomas, 2006).2
The evidence that all of the cuesexceptthekth cue pro-vide in favor of stimulus A or stimulus B can be formed by such a sum. We write all of the cues except thekth that discriminate in favor of stimulus A ask′ ∈ A
, and similarly write all of the cues except thekth that discrim-inate in favor of stimulus B ask′ ∈ B
. Then the total evidence is
tk′ =
X
k′∈A
log vk′
1−vk′ −
X
k′∈B
log vk′
1−vk′
.
This totaltk′will be positive if the other cues overall
pro-vide epro-vidence in favor of stimulus A, and negative if they favor stimulus B. The positive discrimination rated+for
thekth is then the proportion of times, over all stimulus pairs, when thekth cue discriminates, that it favors the same alternative as that favored by the remaining cues, as
2Unfortunately, some previous research has added the cue validities
themselves to combine evidence, which has no information theoretic justification, and has likely led to errors in the experimental design and the interpretation of results in earlier work (e.g., Gigerenzer & Gold-stein, 1996; Rieskamp & Otto, 2006). A reviewer asked for a concrete example, and so we note that the “weighted linear model” considered by Gigerenzer and Goldstein (1996, p. 654) is miscalculated. Our im-plementation of the WADD method that combines evidence across all cues to choose between cities, as used earlier to characterize the four environments, applies the correct method.
calculated from the sign oftk′. The negative
discrimina-tion rated−
is the proportion of times the alternative fa-vored by thekth cue is different from that favored by the other cues over all stimulus pairs. The positive and nega-tive discrimination rates partition3the traditional
discrim-ination rated, withd=d++d−
. Intuitively,d+
k measure
how often thekth cue discriminates in favor of the same alternative as that favored by the other cues.
Table 2 shows the cue validityv, discriminabilityd, positive discriminabilityd+
, and negative discriminabil-ity d−
for all of the cues in each of our city environ-ments. The validity and discriminability measures are those already presented in Figure 1. The refinement of the traditional unitary discriminability measure into posi-tive and negaposi-tive discriminabilities shows that most cues have much greater positive discriminability. This means that they tend to discriminate in favor of the alternative favored by the other cues.
3
Evaluating Take-the-best
Previous evaluations of Take-the-best have focused on the accuracy of the decisions it makes. Early work demon-strated that Take-the-best was impressively accurate, both in absolute terms, and relative to the performance of various alternative and benchmark statistical decision-making methods (e.g., Gigerenzer & Goldstein, 1996). The general finding is that, despite its very limited search, Take-the-best often matches, and sometimes exceeds, the accuracy of benchmark statistical methods that use all of the available cue information, such as the naive Bayes method reported in Table 1.
Subsequent analyses provide a mixture of formal and simulation results for understanding what properties of the environment and decision-making situation affected the performance of Take-the-best and other methods (e.g., Hogarth & Karelaia, 2007; Katsikopoulos & Martignon, 2006; Martignon & Hoffrage, 2002), and many studies are reviewed by Katsikopoulos (2011). These analyses are quite different in the methods they use, and the as-sumptions about issues like the precision with which cues and their properties are known.
At a general level, however, these previous studies identify the regularities of diminishing returns and corre-lated information structure in environments as key deter-minants of the success of simple heuristics like Take-the-best. A strong relationship between validity-based search and accurate decision-making is widely observed, sup-porting the need for diminishing returns. The need for correlated information is made very explicit in, for
exam-3This means that the extremely rare case where the other cues
Table 2: The cue validityv, discriminabilityd, positive discriminabilityd+, and negative discriminabilityd−
for the cues in the four city environments.
German cities
National Exposition Soccer Intercity State Licence Industrial Former East capital site team trainline capital plate University belt Germany
v 1.000 0.910 0.875 0.778 0.766 0.754 0.71 0.564 0.514
d 0.024 0.284 0.300 0.383 0.300 0.344 0.505 0.300 0.267
d+
0.022 0.260 0.217 0.298 0.225 0.268 0.370 0.110 0.143
d−
0.002 0.024 0.083 0.084 0.075 0.076 0.136 0.189 0.125
Italian cities
Regional Rail National
capital Serie A station Airport capital University Serie B Po valley
v 0.847 0.880 0.972 0.840 1.000 0.807 0.751 0.622
d 0.224 0.214 0.160 0.324 0.013 0.425 0.193 0.444
d+
0.207 0.195 0.157 0.278 0.013 0.368 0.134 0.268
d−
0.018 0.019 0.004 0.045 0.000 0.056 0.059 0.176
US cities
State Sport Rail Exposition National capital team Airport Metro station site capital
v 0.588 0.765 0.787 0.747 0.613 0.761 0.685
d 0.328 0.507 0.444 0.237 0.344 0.196 0.027
d+ 0.182 0.446 0.374 0.217 0.271 0.160 0.026
d−
0.145 0.061 0.071 0.020 0.072 0.035 0.001
UK cities
National Premier Rail County
capital Airport league station capital University
v 0.891 0.816 0.663 0.909 0.519 0.852
d 0.116 0.441 0.321 0.357 0.416 0.470
d+ 0.106 0.355 0.213 0.319 0.293 0.409
d−
0.010 0.085 0.108 0.037 0.124 0.061
ple, the work of Karelaia (2006), who evaluates a heuris-tic that requires two discriminating cues that agree before a decision is made.
3.1
Evaluating process coherence
Previous evaluations of Take-the-best have emphasized accuracy as a measure of performance. This reasonable approach to evaluation, focused on the assessment of
ex-ternal outcomes. A natural complementary approach, however, is to measure the internal coherence of a de-cision process. This is the approach we adopt, and makes our evaluation of environmental regularities and Take-the-best different from previous analyses that have fo-cused on accuracy.
urns, and asks you to decide which urn they were drawn from. Two of the three marbles drawn by your friend are red, and one is blue. The first urn contains 20 red marbles and 10 blue ones. The second urn contains 20 blue mar-bles and 10 red ones. It seems clear the best decision is to choose the first urn, because that inference follows from the available information. But, it is possible, of course, that your friend actually drew the marbles from the sec-ond urn, and just happened to draw two reds and a blue. That situation would make choosing the first urn incor-rect, in the sense that the decision would not match the true state of affairs.
In this situation, there are two sorts of measures of the decision you made, supporting different choices. Choos-ing the first urn is the right thChoos-ing to do from a process-or coherence-based notion of cprocess-orrectness, because it fol-lows rationally from the available information. Choosing the second urn is the right thing to do from an outcome-or coutcome-orrespondence-based notion of coutcome-orrectness, because it is gives an accurate answer in terms of what your friend actually did.
This distinction between the assessment of process and outcome is an important one in the decision sciences (e.g., Simon, 1976), sometimes presented as a distinc-tion between correspondence and coherence (Dunwoody, 2009; Hammond, 2007). While people cannot always make accurate decisions, they can always follow effec-tive decision processes, and it seems important to assess both aspects of decision-making (e.g., Lee, 2006).
For non-compensatory search, one measure of a rea-sonable decision process is that it terminates once the current decision is unlikely to change. If it becomes clear that further search is unlikely to change the current de-cision, it is sensible to stop searching. Regardless of the accuracy of that decision, further search will not change the outcome and, in that sense, the decision is internally coherent. Indeed, the definition of non-compensatory en-courages a measure like this, since it captures the idea that additional information cannot change the overall decision of current information. So, our assessment of Take-the-best focuses not on whether it makes accurate decisions, but on whether it stops when further search is unlikely to change the current decision.
3.2
Proportion of extra cues measure
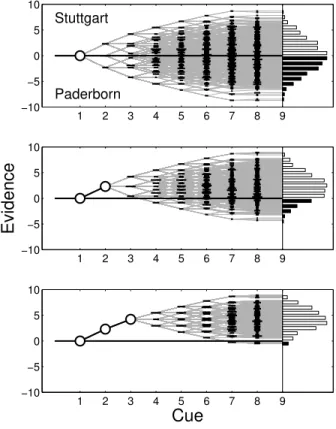
Figure 2 shows three potential stages of search in com-paring Stuttgart to Paderborn. In the first stage, in the top panel, only the first cue, national capital, has been ex-amined, and did not distinguish between the cities. This means the total evidence shown by the white dot is zero. Even without searched cues providing information, how-ever, knowledge of the validities and discriminabilities of the remaining cues can be used to project possible future
Figure 2: Three stages of search in deciding whether Stuttgart or Paderborn has the larger population, and the projection of evidence tallies at each stage. The top panel corresponds to the case where the first cue has been ex-amined, and does not discriminate between the cities. The middle panel corresponds to the case where the sec-ond cue has been examined, and discriminates in favor of Stuttgart. The bottom panel corresponds to the case where the third cue has also been examined, and also dis-criminates in favor of Stuttgart. In each panel, the valid-ity and discriminabilvalid-ity measures for the cues that have not been searched are used to project possible outcomes, shown by gray lines. These projected evidence totals re-sult in final distributions in favor of Stuttgart, shown by the white histogram, and in favor of Paderborn, shown by the black histogram, to the right of each panel.
1 2 3 4 5 6 7 8 9
−10 −5 0 5 10
Evidence
1 2 3 4 5 6 7 8 9
−10 −5 0 5 10
Cue
1 2 3 4 5 6 7 8 9
−10 −5 0 5 10
Stuttgart
Paderborn
ninth cue has been examined, is shown by the histogram on the far right of the panel, with those totals favoring Stuttgart in white and those favoring Paderborn in black. In the top panel, the final evidence tallies are the same for both Stuttgart and Paderborn, because no discriminating cues have yet been found to provide evidence in favor of one city or the other,
The middle panel in Figure 2 corresponds to the case where the second cue, exposition site, has been examined, and found to favor Stuttgart. The evidence for Stuttgart, again shown by the white dot, is now the log odds va-lidity of that cue. As before, the discriminabilities and validities of the remaining cues can be used to project the distribution of possible future evidence totals. The distri-bution of possible final totals now shows that Stuttgart is more likely to be favored than Paderborn.
The bottom panel in Figure 2 corresponds to the case where the third cue, soccer team, has been examined, and also favors Stuttgart. Now the projected final evidence tallies overwhelmingly would lead to the final decision being Stuttgart. This corresponds to the rationale for a process coherence measure of limited search. At this stage in search, with two cues found favoring Stuttgart, almost no sequence of remaining cue information could change that decision.
Using an analysis like that presented in Figure 2, in which each successive stage of search is considered, it is possible to quantify the extent of search justified by a process coherence measure. We formalize this in terms of the Proportion of Extra Cues (PEC) measure, used previously by Newell and Lee (2009). The PEC ranges from 0 to 1, measuring the proportion of cues beyond the first discriminating cue that must be searched to make the probability of exhaustive search changing the current de-cision smaller than some fixed threshold. For example, if the threshold is 5%, then, based on Figure 2, deciding be-tween Stuttgart and Paderborn requires one cue (the third cue, soccer league) beyond the first discriminating cue (the second cue, exposition site) to make the probability of the final decision changing to Paderborn sufficiently small (i.e., the final evidence tallies on which the deci-sion is based favor Stuttgart in white over Paderborn in black sufficiently strongly). Thus the PEC is 1/7, since one extra cue must be searched out of a possible 7.
3.3
Manipulating environmental
assump-tions
When PEC=0, the first discriminating cue terminates search, as in Take-the-best, and when PEC=1, search ex-hausts all of the cues, as in naive Bayes. For intermedi-ate values, the PEC quantifies how much search beyond the first discriminating cue must be conducted, so that the available evidence is very unlikely to be over-turned
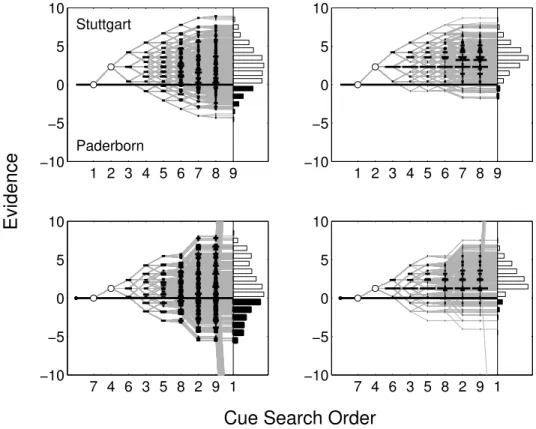
by exhaustive search of all the cues. This PEC measure can be calculated for any environment, using any search order for the cues, and any measure of discriminability. The four examples in Figure 3 demonstrate the effect of changing search order and the measure of discriminabil-ity, continuing to use Stuttgart and Paderborn as a con-crete example.
In the top left panel of Figure 3, a search order based entirely on validity is used, as in Figure 2. The first cue, national capital, does not discriminate the cities, but the second cue, exposition site, does, and favors Stuttgart. The top right panel of Figure 3 shows the analysis for the same search order, but using positive and negative discrimination rates. Now, if the current evidence favors one alternative, the probabilities of future discrimination in favor or against that alternative follow the positive and negative rates, rather than being evenly split between the two possibilities. Because positive discrimination rates are usually larger the distribution of final evidence tal-lies gives greater support the currently favored alterna-tive. This is clear in the top right panel, through an up-ward shift in the evidence path, and in the distribution of final tallies. There is now only a very small probability of exhaustive search changing the decision from Stuttgart to Paderborn.
The bottom two panels of Figure 3 show the same two analyses, but for a different search order. This is a search order based only on discriminability, starting with the most discriminating university cue and moving to the least discriminating national capital cue. As before, the first cue does not discriminate between Stuttgart and Paderborn, but the second intercity trainline cue does, and favors Stuttgart. The bottom left panel of Figure 3 shows the evidence paths that follow, based on this search order, using the traditional single measure of discriminability. The distribution of final tallies shows there is a strong probability of the decision being changed to Paderborn after exhaustive search.
The bottom right panel of Figure 3 considers the same search order, but uses the positive and negative discrim-ination rates. The distribution of final tallies now shows a much lower probability of Paderborn being favored by exhaustive search.
The four examples in Figure 3 show two key trends, corresponding to two environmental regularities. One trend is made by the top versus bottom panels. The top panels show the results of search based on validity, which builds into decision-making an assumption of diminish-ing returns. These diminishdiminish-ing returns are visually clear from the convex nature of the evidence paths, as later cues provide successively less evidence. This means that early decisions are less likely to be over-turned by later evi-dence, because the later evidence is less compelling.
Figure 3: Evidence paths, and distributions of final tallies, for a comparison of Stuttgart and Paderborn where the first discriminating cue favors Stuttgart. Each panel shows by gray lines the possible evidence paths for future cues, culminating in a distribution of final evidence tallies. The final tallies agreeing with the current decision are shown in white, while those corresponding to the alternative decision are shown in black. All four panels consider the case where two cues have been searched, and the current evidence favors choosing Stuttgart. Panels in the top row corresponds to validity-based search, while those in the bottom row corresponds to discriminability-based search. Panels in the left column correspond to using traditional discriminability to assess evidence, while panels in the right column correspond to using positive and negative discriminabilities.
1 2 3 4 5 6 7 8 9 −10
−5 0 5 10
Stuttgart
Paderborn
1 2 3 4 5 6 7 8 9 −10
−5 0 5 10
7 4 6 3 5 8 2 9 1 −10
−5 0 5 10
7 4 6 3 5 8 2 9 1 −10
−5 0 5 10
Cue Search Order
Evidence
different search strategy, based on discriminability in this case, is used. Now later cues can provide strong evi-dence, the evidence paths can move quickly toward one alternative or another late in search, and the distribu-tion of final evidence tallies covers both choices. Basing search on cue validity corresponds to assuming diminish-ing returns, and provides grounds for non-compensatory decision-making. When this assumption is not made, early decisions can be over-turned by later evidence.
The other key trend is shown by the left versus right panels in Figure 3. The left panels show final evidence tallies based on the traditional measure of discriminabil-ity. Those on the right show the tallies coming from using positive and negative discrimination rates. These measures allow the environmental regularity of correlated information to be incorporated in the analysis. In the panels on the right, once evidence favors a decision, fu-ture discriminating cues are generally expected also to favor that decision, because positive discriminability is
greater than negative discriminability for most cues in the German cities environment. What is seen early in search is generally predictive of what is seen later, and so early decisions are unlikely to be over-turned. The presence of correlated information provides grounds for non-compensatory decision-making.
3.4
Results
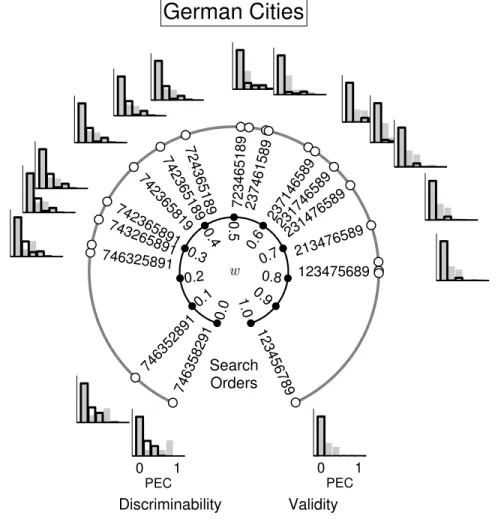
Figure 4: Results of manipulating the search order by emphasizing validity or discriminability, and manipulating the measure of discriminability, on the proportion of cues beyond the first discriminating one that must be searched to reduce the probability of a changed decision below 5%. The inner rim shows the change in thew parameter that weights validity in determining the cue search order, ranging from strictly discriminability-based search at the bottom-left, to strictly validity-based search at the bottom right. The outer rim shows the change in patterns of the actual search orders by circular markers, and provides the details for a selected representative subset of these orders. The histograms for these selected order shows the distribution of the Proportion of Extra Cues (PEC) measure, over all possible questions, assuming both traditional discriminability (shaded gray) and positive and negative discriminability (unshaded).
0 1
PEC
0 1
PEC
German Cities
w
Search Orders
Discriminability Validity
746358291 746352891 746325891
743265891 742365891
742365819
742365189 724365189
723465189 237461589
237146589 231746589 231476589
213476589 123475689
123456789
0.0
0.1 0.2
0.3 0.4 0.5
0.6 0.7
0.8 0.9 1.0
The histograms outside the search orders in Figure 4 show the extent of search, using the criterion that search should continue while there is a greater than 5% chance of exhaustive search leading to a different decision.4
Two key results are clear. One is that, as the em-phasis in search order shifts to validity, search becomes less extensive. In other words, as the assumption of
di-4The choice of 5% is obviously not principled, but is often a default
choice in statistical inference. Using values near 5% lead to qualita-tively similar results, and behave in the ways one would expect. As the criterion becomes more stringent, search is more extensive. Our goal is not to study or justify this criterion, but to show the impact of the environmental regularities for a reasonable criterion setting.
minishing returns is built into the search order, there are stronger grounds for stopping sooner. The other key re-sult is that, when positive and negative discriminability are used, search becomes much less extensive. In other words, when the correlation of cues in the environment is considered, it often becomes clearer earlier that the likelihood of a decision being reversed is small, and the grounds for stopping earlier are again stronger.
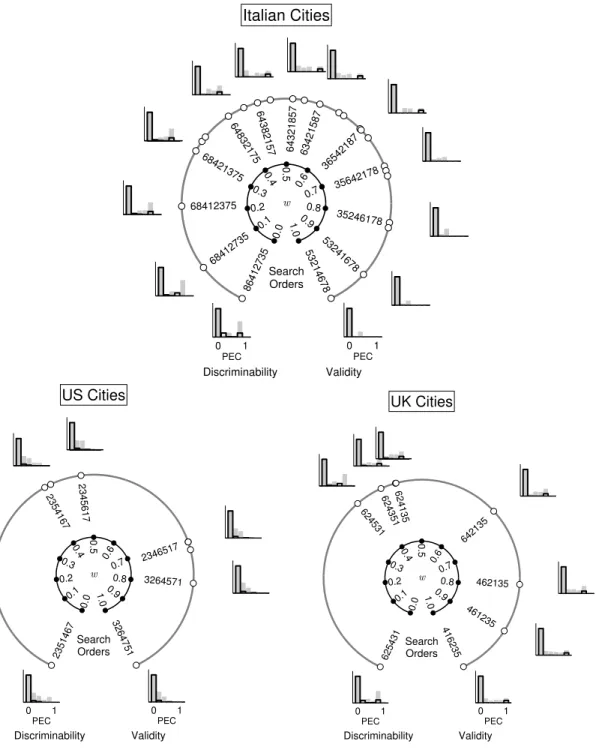
Figure 5 shows the same set of results for the Italian, US and UK city environments.5 The results for the
Ital-5For completeness, we also calculated the search order given by the
Figure 5: Results of manipulating the search order by emphasizing validity or discriminability, and manipulating the measure of discriminability, on the proportion of cues beyond the first discriminating one that must be searched to reduce the probability of a changed decision below 5%. The Italian cities environment is shown at the top, and the US and UK cities environments are shown below.
0 1
PEC
0 1
PEC
Italian Cities
w
Search Orders
Discriminability Validity
86412735 68412735 68412375
68421375 64832175
64382157
64321857 63421587
36542187
35642178
35246178
53241678 53214678
0.0
0.1 0.2 0.3
0.4 0.5
0.6 0.7
0.8
0.9 1.0
0 1
PEC
0 1
PEC
US Cities
w
Search Orders
Discriminability Validity
2351467 2354167
2345617
2346517
3264571
3264751
0.0 0.1
0.2
0.3
0.4 0.5 0.6
0.7
0.8 0.9
1.0
0 1
PEC
0 1
PEC UK Cities
w
Search Orders
Discriminability Validity
625431 624531
624351 624135
642135
462135
461235
416235
0.0 0.1
0.2
0.3
0.4 0.5 0.6
0.7
0.8 0.9
1.0
ian cities are very similar to those found for the German
cities, the order is 2346517, which is shown in Figure 5. The success orders for the other environments are not among the sets we consider. But, their PEC distributions are all similar to those observed in Figures 4 and 5 for orders half-way between validity and discriminability.
discrim-inability is used (i.e., gray histograms), some city com-parisons require more extensive search.
The results for the US and UK city environments show less variability. In general, the distribution of PEC mea-sures shows many values near zero, but does not vary as the search order and assumptions about discriminability are manipulated. These findings are consistent with the idea of limited search, but are less interesting. With hind-sight, it seems, in comparison to the German and Ital-ian environments, that the US and UK city environments have fewer cues, and many fewer possible search orders. We suspect they are too impoverished to reveal the effects of environmental manipulation, and could usefully be en-riched in the future. (But we did not want to revisit the nature of the environments having seen these results).
Overall, the results in Figures 4 and 5 provide sup-port for Take-the-best as an effective decision-making heuristic. But the results also show the bounds on the support offered by a process- or coherence-based anal-ysis. When one or other or both of the environmental assumptions are not met, especially in the German and Italian cities environments, search needs to be more ex-tensive than the first discriminating cue. The gray his-tograms, when a correlated environment is not incorpo-rated, always show search extending well beyond the first discriminating cues for many of the questions. The his-tograms not in the bottom-right corner, considering dis-criminability as part of the search order, and so not re-lying on diminishing returns, also show more extensive search, however discriminability is measured.
4
Discussion
In this paper, we have considered two key theoretical as-sumptions underpinning the Take-the-best heuristic for decision-making. These are both assumptions about the type of information structure of the environment. One is that the environment has diminishing returns, so that evidence found later in search is less important than evi-dence found earlier. The other is that the environment has correlated information, so that information found early in search is likely to be consistent with information found later.
Demonstrating that the grounds for Take-the-best rely on these assumptions requires the ability to manipulate the assumptions. We proposed a richer set of search or-ders, generalizing the validity search of Take-the-best, so that the assumption of diminishing returns could be manipulated. We also proposed dividing discriminabil-ity into positive and negative components, to capture the assumption of correlated information.
Our results, for the well-studied German cities en-vironment, and for three new city environments, show
that combining diminishing returns and correlated infor-mation provide grounds for non-compensatory decision-making. When these assumptions are met, the probabil-ities that exhaustive search would change an initial deci-sion are very small. The first discriminating cue favors the same alternative as exhaustive search favors. The de-tailed results in Figures 4 and 5 show that both environ-mental regularities are important, and quantify their ef-fect. The results also show, however, the bounds on the justification for limited search. In several of the environ-ments we studied, when the basis of search moved away from validity, and so did not emphasize diminishing re-turns, more extensive search was needed. Similarly, if the correlation of information in the environment is not as-sumed, many more cues than the first discriminating one need to be examined to make it very unlikely a decision will change.
More general conclusions about the relative impact and usefulness of each assumption, and their interaction, re-quire a much more extensive study of a broad range of environments. Unfortunately, many of the other envi-ronments studied in the fast and frugal literature (e.g., Czerlinski, Gigerenzer, & Goldstein, 1999) formed bi-nary cues by taking median splits of continuous vari-ables. By construction, this means all of the cues have discriminabilities of 0.5, and so create impoverished en-vironments from the perspective of the current analyses. With appropriate environments, however, our findings give some theoretical tools and initial results to motivate that broader exploration.
Another line of future work is to extend Take-the-best as a decision-making heuristic, and evaluate these exten-sions. Our results present a detached analysis of when and why Take-the-best works in structured environments. But, the mechanism we used for manipulating search or-ders immediately gives a set of possible new decision-making heuristics (see Lee & Newell, 2011). The mech-anism we developed for breaking discriminability into positive and negative components, to assess correlated in-formation, does not immediately give rise to new heuris-tics. It does, however, give a theoretical opening for their development. For example, one sensible stopping rule would require a discriminating cue with a positive dis-crimination rate larger than the negative disdis-crimination rate. This would correspond to stopping only when the discriminating cue was more likely than not in agreement with the information that would be provided by further search. Possibilities like these seem worth exploring.
grounds for limited search. Asked before the Angola game what he knew about the Angolan team, US player Charles Barkley replied: “All I know about Angola is An-gola’s in trouble.” That was a non-compensatory opinion, unlikely to have been changed on the basis of further re-flection. It proved to be accurate.
References
Bergert, F. B., & Nosofsky, R. M. (2007). A response-time approach to comparing generalized rational and take-the-best models of decision making. Journal of Experimental Psychology: Learning, Memory &
Cog-nition, 33,107–129.
Cover, T. M., & Thomas, J. A. (2006).Elements of
infor-mation theory.New York, NY: Wiley.
Czerlinski, J., Gigerenzer, G., & Goldstein, D. G. (1999). How good are simple heuristics? In G. Gigerenzer, P. M. Todd, & The ABC Research Group (Eds.),Simple
heuristics that make us smart, (p. 97–118). Oxford
University Press.
Dhami, M. K. (2003). Psychological model of profes-sional decision-making. Psychological Science, 14,
175–180.
Dunwoody, P. T. (2009). Introduction to the special is-sue: Coherence and correspondence in judgment and decision making. Judgment and Decision Making, 4,
113–115.
Gigerenzer, G., & Goldstein, D. G. (1996). Reasoning the fast and frugal way: Models of bounded rationality.
Psychological Review, 103,650–669.
Gigerenzer, G., Todd, P. M., & the ABC Group. (1999).
Simple heuristics that make us smart. New York:
Ox-ford University Press.
Hammond, K. R. (2007).Beyond rationality: The search
for wisdom in a troubled time. Oxford University
Press.
Hogarth, R. M., & Karelaia, N. (2007). Heuristic and linear models of judgment: Matching rules and envi-ronments.Psychological Review, 114,733–758. Karelaia, N. (2006). Thirst for confirmation in
multi-attribute choice: Does search for consistency impair decision performance? Organizational Behavior and
Human Decision Processes, 100,128–143.
Katsikopoulos, K. V. (2011). Psychological heuristics for making inferences: Definition, performance, and the emerging theory and practice. Decision Analysis, 8,
10–29.
Katsikopoulos, K. V., & Martignon, L. (2006). Naive heuristics for paired comparisons: Some results on their relative accuracy. Journal of Mathematical
Psy-chology, 50,488–494.
Lee, M. D. (2006). A hierarchical Bayesian model of human decision-making on an optimal stopping
prob-lem.Cognitive Science, 30,555–580.
Lee, M. D., & Cummins, T. D. R. (2004). Evidence ac-cumulation in decision making: Unifying the “take the best” and “rational” models. Psychonomic Bulletin &
Review, 11,343–352.
Lee, M. D., & Newell, B. R. (2011). Using hierarchi-cal Bayesian methods to examine the tools of decision-making.Judgment and Decision Making, 6.832–842. Martignon, L., & Hoffrage, U. (1999). Why does
one-reason decision making work? A case study in eco-logical rationality. In G. Gigerenzer, P. M. Todd, & The ABC Research Group (Eds.), Simple heuristics
that make us smart,(p. 119-140). Oxford University
Press.
Martignon, L., & Hoffrage, U. (2002). Fast, frugal and fit: Simple heuristics for paired comparison. Theory
and Decision, 52,29–71.
Newell, B. R., & Lee, M. D. (2009). Learning to adapt evidence thresholds in decision making. In N. Taat-gen, H. van Rijn, J. Nerbonne, & L. Shönmaker (Eds.),
Proceedings of the 31st Annual Conference of the
Cog-nitive Science Society.Austin, TX: Cognitive Science
Society.
Newell, B. R., Rakow, T., Weston, N. J., & Shanks, D. R. (2004). Search strategies fo decision making: The success of ‘success’. Journal of Behavioral Decision
Making, 17,117–130.
Rakow, T., Newell, B. R., Fayers, K., & Hersby, M. (2005). Evaluating three criteria for establishing cue-search hierarchies in inferential judgment. Journal of Experimental Psychology: Learning, Memory &
Cog-nition, 31,1088–1104.
Rieskamp, J., & Otto, P. (2006). SSL: A theory of how people learn to select strategies.Journal of
Experimen-tal Psychology: General, 135,207–236.
Simon, H. A. (1956). Rational choice and the structure of environments.Psychological Review, 63,129–138. Simon, H. A. (1976). From substantive to procedural
ra-tionality. In S. J. Latsis (Ed.),Method and appraisal in
economics(pp. 129–148). London: Cambridge
Uni-versity Press.
Simon, H. A. (1990). Invariants of human behavior.
An-nual Review of Psychology, 41,1–19.
Todd, P. M., & Dieckmann, A. (2005). Heuristics for or-dering cue search in decision making. In L. K. Saul, Y. Weiss, & L. Bottou (Eds.),Advances in Neural
Infor-mation Processing Systems(Vol. 17, pp. 1393–1400).
Cambridge, MA: MIT Press.