(1) Received for publication in March 3, 2011 and approved in September 27, 2011.
(2) Agronomist, Dr. in Water Resources and Environmental Sanitation, Professor PPGCA/UNESC, Researcher EPAGRI, Rod. SC 446, km 16, Zip Code 88840-000 Urussanga (SC), Brazil. E-mail: [email protected]
(3) Sanitary and Environmental Engineer, M.Sc. in Environmental Engineering, Researcher EPAGRI. E-mails: [email protected]; [email protected]
HEAVY RAINFALL EQUATIONS FOR SANTA
CATARINA, BRAZIL
(1)Álvaro José Back(2), Alan Henn(3) & José Luiz Rocha Oliveira(3)
ABSTRACT
Knowledge of intensity-duration-frequency (IDF) relationships of rainfall events is extremely important to determine the dimensions of surface drainage structures and soil erosion control. The purpose of this study was to obtain IDF equations of 13 rain gauge stations in the state of Santa Catarina in Brazil: Chapecó, Urussanga, Campos Novos, Florianópolis, Lages, Caçador, Itajaí, Itá, Ponte Serrada, Porto União, Videira, Laguna and São Joaquim. The daily rainfall data charts of each station were digitized and then the annual maximum rainfall series were determined for durations ranging from 5 to 1440 min. Based on these, with the Gumbel-Chow distribution, the maximum rainfall was estimated for durations ranging from 5 min to 24 h, considering return periods of 2, 5, 10, 20, 25, 50, and 100 years,. Data agreement with the Gumbel-Chow model was verified by the Kolmogorov-Smirnov test, at 5 % significance level. For each rain gauge station, two IDF equations of rainfall events were adjusted, one for durations from 5 to 120 min and the other from 120 to 1440 min. The results show a high variability in maximum intensity of rainfall events among the studied stations. Highest values of coefficients of variation in the annual maximum series of rainfall were observed for durations of over 600 min at the stations of the coastal region of Santa Catarina.
RESUMO: EQUAÇÕES DE CHUVAS INTENSAS PARA O ESTADO DE SANTA CATARINA
O conhecimento das relações intensidade-duração-frequência (IDF) de chuvas é de grande importância no dimensionamento de estruturas de drenagem superficial e controle de erosão do solo. O objetivo deste trabalho foi obter equações IDF para 13 estações pluviográficas do Estado de Santa Catarina: Chapecó, Urussanga, Campos Novos, Florianópolis, Lages, Caçador, Itajaí, Itá, Ponte Serrada, Porto União, Videira, Laguna e São Joaquim. Os pluviogramas diários de cada estação foram digitalizados e, posteriormente, determinaram-se as séries de máximas anuais de chuva com duração de 5 a 1.440 min. A partir delas, foram estimadas, por meio da distribuição de Gumbel-Chow, as chuvas máximas com durações variando de 5 min a 24 h, considerando-se os períodos de retorno de 2, 5, 10, 20, 25, 50 e 100 anos. A aderência dos dados ao modelo de Gumbel-Chow foi comprovada por meio do teste de Kolmogorov-Smirnov a 5 %. Para cada estação pluviográfica, ajustaram-se duas equações IDF de chuvas: uma válida para duração de 5 a 120 min e outra para duração de 120 a 1.440 min. Os resultados mostraram grande variação na intensidade máxima da chuva entre as estações estudadas. Foram observados maiores valores de coeficientes de variação nas séries de máximas anuais de chuva com duração superior a 600 min das estações situadas na faixa litorânea do Estado de Santa Catarina.
Termos de indexação: chuva intensa, hidrologia, drenagem.
INTRODUCTION
Rainfall is one of the climatic events with high variability in terms of time and space, and its excess or deficit generally affects agricultural production and causes problems for the population in general. Knowledge on rainfall characteristics and their relationship with the hydrologic cycle are extremely important for strategic studies on environmental planning (Carvalho & Assad, 2005), power generation and agricultural management, especially under tropical conditions (Mello & Silva, 2009).
Soil erosion caused by water constitutes a great problem in agricultural areas. The power of rain to cause soil erosion is called rainfall erosivity (Cassol et al., 2008). Many studies quantifying rainfall erosivity have been published elsewhere, e.g., Moreira et al. (2008), Bazzano et al. (2007, 2010) and Martins et al. (2010). According to Bazzano et al. (2010), knowledge on rain characteristics increases safety in the planning of soil conservation structures e.g., terraces, catchment areas, and of agricultural practices of soil conservation by maintaining the vegetation cover or by constructions (dams, drainage canals), and hydraulic flow structures for rainwater, justifying the determination of precipitation characteristics. Mesquita et al. (2009) stated that to determine the dimensions of a rural construction it is fundamental to know about the expected rainfall conditions for an adequate planning of systems of agricultural terracing, road drainage, and dam constructions to minimize flooding, among others. According to Bazzano et al. (2010), the effective dimensions of hydraulic structures in urban areas and of agricultural terraces
can be determined when aspects of rain risk and frequency are considered, which can be expressed by relationships of rainfall intensity-duration-frequency (IDF). In this sense, in places where pluviograph data are available, it is possible to fit the equation of heavy rainfall, also called IDF equation. The studies of Fendrich (1998), Costa & Brito (1999), Oliveira et al. (2000), Silva et al. (2002) and Soprani & Reis (2007) deal with this matter.
IDF relationships are obtained through statistical analysis of long data series recorded by pluviographs. In Brazil, it is quite easy to get daily rainfall data, although rainfall data of shorter duration are limited, due to shortage and unavailability of recording equipment and inaccurate data records. Many authors, as for example Assad et al. (1992), Wadt (2003), Ferreira (2005), Lima et al. (2005), Oliveira et al. (2008), and Back (2009) report the difficulty of obtaining long series of rainfall data, mainly of pluviograph data. Cecílio & Pruski (2003) stress that working with the method to determine rainfall IDF relationships to tabulate, analyze and interpret a large quantity of recording charts is rather exhaustying. This study aims to analyze the rainfall data charts and to adjust IDF equations to the meteorological stations of Santa Catarina in Brazil.
MATERIALS AND METHODS
extension of Santa Catarina (Epagri) (Table 1 and Figure 1).
To digitize rainfall data charts, the GEDAC program (Pedrollo, 1997) was used. To read the documents created by GEDAC and to perform discretization of rainfall data at 1 min intervals, a computer program was created to determine the annual maximum rainfall series for different durations (5, 10, 15, 20, 25, 30, 45, 50, 55, 60, 75, 90, and 105 min and 2, 3, 4, 5, 6, 7, 8, 10, 12, 14, 16, 18, 20, 22, and 24 h).
For each duration, rainfall values were estimated for return periods of 2, 5, 10, 20, 25, 50, and 100 years, applying the Gumbel-Chow distribution with:
(1)
where PT - maximum precipitation for return period T
years, mm; - mean of annual maximum series, mm; S - standard deviation of annual maximum
series, mm: Yn - mean of reduced variable; Sn
-standard deviation of reduced variable; and Y - reduced variable estimated by
(2)
where T is the return period (years).
Agreementbetween annual maximum series and
the Gumbel-Chow distribution was verified with the
Figure 1. Location of rain gauge stations in Santa Catarina, Brazil.
Kolmogorov-Smirnov test at 5 % significance level as described by Kite (1978).
For each station, two heavy rainfall equations were adjusted, one for durations of 5 to 120 min and the other 120 to 1440 min, as follows:
(3)
where i - rainfall intensity (mm h-1); K, m, b, n
-empirical coefficients; T - return period (year); and t - rainfall duration (min).
The coefficient was adjusted by reducing the S function, given by:
(4)
where S - sum of squares of deviations (mm2); t - rainfall
duration (min); T - return period (year); J - number of return periods used (1 - 7); G - precipitation intensity with duration of i minutes and return period of T years, estimated by the Gumbel-Chow distribution
(mm h-1); and i - rainfall intensity for duration of t
minutes and return period of T years, estimated by
IDF equation (mm h-1).
The accuracy of estimates was evaluated using the standard error estimate, given by:
(5)
where Ep - standard error of estimate (mm); G - precipitation intensity for duration of i minutes and return period of T years, estimated by the Gumbel-Chow distribution
(mm h-1); i - rainfall intensity for duration of t minutes
and return period of T years, estimated by IDF
equation (mm h-1); and N - number of observations.
RESULTS AND DISCUSSION
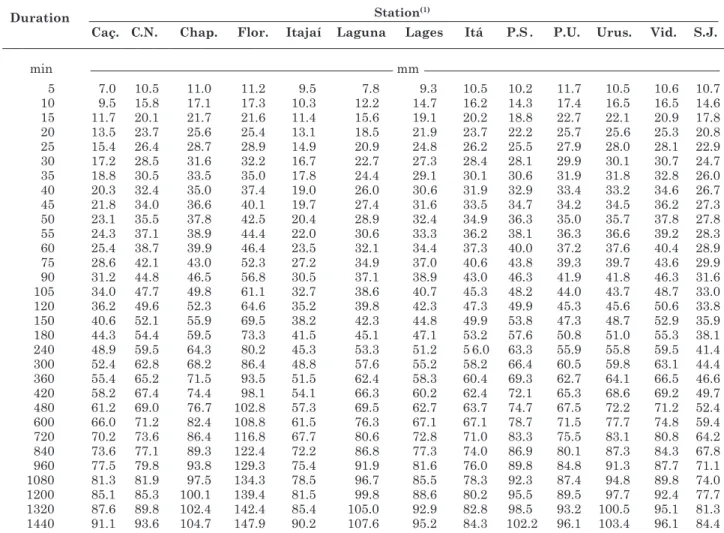
The average values and coefficient of variation of the annual maximum series over a range of durations were calculated for each of the 13 stations studied (Tables 2 and 3).
Table 2. Average values of the annual maximum precipitation series of the rain gauge stations of Santa Catarina
For heavy rainfalls, variability was high among the stations, especially at the station of Florianópolis where the highest average precipitation was recorded for durations of over 30 min. At the stations of Florianópolis and Laguna, the coefficient of variation was also high for rainfall durations of over 60 min. For 5 min durations, the highest value (11.7 mm) was observed at the station of Porto União, and the minimum value (7.0 mm) in Caçador. The relationship between the maximum and minimum value for this duration is 1.7, which this is the lowest ratio found between durations. The highest ratio between maximum and minimum average values was 2.1, recorded for 50 min events, in Florianópolis and Itajaí. In a study involving 19 rain gauge stations in the state of Bahia, Brazil, Silva et al. (2002) observed that the maximum/minimum ratio varied from 1.28 to 1.76, which is lower than observed in this study.
For all locations, the Gumbel distribution proved adequate to represent the estimates of rainfall intensity at 5 % significance level by Kolmogorov-Smirnov test.
The analysis of the coefficient values shows that the heavy rainfalls recorded at the stations of Itajaí, Florianópolis, Laguna, and Urussanga have a slightly different distribution pattern than the other stations, presenting the highest values of the coefficient of variation for long durations (over 600 min). This behavior can be explained by the presence of extreme precipitation values in the annual maximum series for duration of 1440 min (121.3, 437.7, 296.2, and 249.7 mm, respectively, for the stations of Itajaí, Florianópolis, Laguna and Urussanga). These meteorological stations are located in the coastal region of the State, where the occurrence of extreme rain events of longer duration is related to complex phenomena of atmospheric circulation, often associated to extratropical cyclones over the Atlantic (Monteiro, 2001), which would be determinant for the variability found in this study.
Differences in the statistical parameters of the observed rainfalls reflect their different estimates and demonstrate the importance of adjusting equation
Table 3. Coefficient of variation values of the annual maximum precipitation of the rain gauge stations of Santa Catarina
parameters of heavy rainfall events to local data, since regionalized equations may contain errors and inaccuracies. Silva et al. (1999) and Eduardo et al. (2009) drew similar conclusions on the adjusted parameters of IDF data for heavy rainfall events in the States of Rio de Janeiro and Espírito Santo, Brazil.
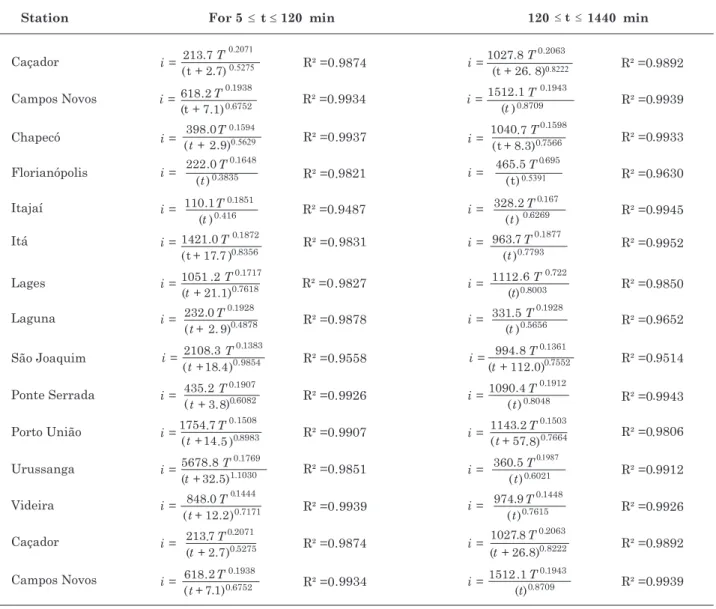
IDF relationships of the station of Urussanga with the respective adjusted equation are shown in figures 2 and 3 and the adjusted equations for each one of the 13 rain gauge stations in table 4, valid for rainfall durations from 5 to 1440 min (24 h) and return periods from 2 to 100 years. It was observed that the coefficient of determination of the adjusted equations
was generally R2 > 0.95 (between 0.95 and 0.99).
Similar results were found by Eduardo et al. (2009).
The greatest deviations between the observed and estimated values by the adjusted equation were observed for a return period of 2 years. The rainfall data charts were traditionally analyzed manually and the adjusted equations were limited to durations of up to 120 min.
The heavy rainfall equations established for the 13 locations in Santa Catarina can be used to determine the dimensions of soil conservation structures and agricultural drainage such as terracing, drainage canals, road drainage as well as of other projects of surface drainage in rural or urban areas. The applied method in the adjustment of the coefficient of IDF equations for return periods from 2 to 100 years and durations from 5 to 1440 min can be
Figure 2. Equations of heavy rainfall events for durations up to 120 min, adjusted to Urussanga, Santa Catarina.
Table 4. Heavy rainfall equations of the rain gauge stations of Santa Catarina where i is rain intensity (mm h-1),
T is the return periods from 2 to 100 years, and t is rain duration, in minute
used to determine the dimensions of most projects that involve surface runoff, as indicated by Tucci et al. (1995) and Tomaz (2002).
CONCLUSIONS
1. There is high variability among the studied stations in the average maximum intensity of rainfall events for a given duration.
2. The coefficients of variation in the annual maximum series for durations of over 600 min (10 h) were higher for the stations in the coastal region of Santa Catarina.
3. To determine dimensions for projects of soil conservation and surface drainage, rainfall intensity for durations from 5 to 1440 min and return periods
from 2 to 100 years can be estimated by adjusted equations.
LITERATURE CITED
ASSAD, E.D.; MASUTOMO, R. & ASSAD, M.L.L. Estimativa das precipitações máximas prováveis com duração de 24 horas e de 30 minutos. Pesq. Agropec. Bras., 27:677-686, 1992.
BACK, Á.J. Relações entre precipitações intensas de diferentes durações ocorridas no município de Urussanga, SC. R. Bras. Eng. Agríc. Amb., 13:170-175, 2009.
BAZZANO, M.G.P.; ELTZ, F.L.F. & CASSOL, E.A. Erosividade e características hidrológicas das chuvas de Rio Grande (RS). R. Bras. Ci. Solo, 34:235-244, 2010.
CARVALHO, J.P. & ASSAD, E.D. Análise espacial da precipitação pluviométrica no Estado de São Paulo: Comparação de métodos de interpolação. Eng. Agríc., 25:377-384, 2005.
CASSOL, A.E.; ELTZ, F.L.; MARTINS, D.; LEMOS, A.M.; LIMA, V.S. & BUENO, A.C. Erosividade, padrões hidrológicos, período de retorno e probabilidade de ocorrências das chuvas em São Borja, RS. R. Bras. Ci. Solo, 32:1239-1251, 2008.
CECILIO, R.A. & PRUSKI, F.F. Interpolação dos parâmetros de equações de chuvas intensas com uso do inverso de potências da distância. R. Bras. Eng. Agríc. Amb., 7:501-504, 2003.
COSTA, A.R. & BRITO, V.F. Equações de chuva intensa para Goiás e Sul de Tocantins. In: SIMPÓSIO BRASILEIRO DE RECURSOS HÍDRICOS, 13., Belo Horizonte, 1999. Anais... Belo Horizonte, ABRH, 1999. CD ROM. EDUARDO, E.N.; MACHADO, R.L.; SOUZA, E.S.; OLIVEIRA,
L.F.C. & CARVALHO, D.F. Estimativa de precipitação para a região metropolitana do Rio de Janeiro. In: CONGRESSO BRASILEIRO DE ENGENHARFIA AGRÍCOLA, 38., Juazeiro/Petrolina, 2009. Anais... Juazeiro/Petrolina, SBEA, 2009. CD ROM.
FENDRICH, R. Chuvas intensas para obras de drenagem no Estado do Paraná. Curitiba, Champagnat, 1998. 99p. FERREIRA, J.C.; DANIEL, L.A. & TOMAZELA, M. Parâmetros
para equações mensais de estimativas de precipitação de intensidade máxima para o Estado de São Paulo – Fase I. Ci. Agrotéc., 29:1175-1187, 2005.
KITE, G.W. Frequency and risk analysis in hydrology. 3.ed. Fort Collins, Water Resources, 1978. 224p.
LIMA, H.M.F.; MATA, I.P. & LIMA, A.V.F. Aplicação e validação de um simulador estocástico de variáveis climáticas: O caso da precipitação. Ing. Agua, 12:27-37, 2005.
MARTINS, S.G.; AVANAZI, J.C.; SILVA, M.L.N.; CURI, N.; NORTON, L.D. & FONSECA, S. Rainfall erosivity and rainfall return period in the experimental watershed of Aracruz, in the Coastal Plain of Espirito Santo, Brazil. R. Bras. Ci. Solo, 34:999-1004, 2010.
MELLO, C.R. & SILVA, A.M. Modelagem estatística da precipitação mensal e anual e no período seco para o Estado de Minas Gerais. R. Bras. Eng. Agríc. Amb., 13:68-74, 2009.
MESQUITA, W.O.; GRIEBELER, N.P. & OLIVEIRA, L.F.C. Precipitações máximas diárias esperadas para as regiões central e sudeste de Goiás. Pesq. Agropec. Trop., 39:73-81, 2009.
MONTEIRO, M.A. Caracterização climática do Estado de Santa Catarina: Uma abordagem dos principais sistemas atmosféricos que atuam durante o ano. Geosul, 16:69-78, 2001.
MOREIRA, C.M.; PRUSKY, F.F.; OLIVEIRA, T.E.C.; PINTO, F.A.C. & SILCA, D.D. NetErosividade MG: Erosividade da chuva em Minas Gerais. R. Bras. Ci. Solo, 32:1349-1353, 2008.
OLIVEIRA, L.F.C.; ANTONINI, J.C. & GRIEBELER, N. Métodos de estimativa de precipitação máxima para o Estado de Goiás. R. Bras. Eng. Agríc. Amb., 12:620-625, 2008.
OLIVEIRA, L.F.; CORTES, F.C.; BARBOSA, F.O.A.; ROMÃO, P.A. & CARVALHO, D.F. Estimativa das equações de chuvas intensas para algumas localidades de Goiás pelo método da desagregação de chuvas. Pesq. Agropec. Trop., 30:23-27, 2000.
PEDROLLO, O.C. GEDAC: Gerenciamento de dados contínuos. Manual do usuário. Porto Alegre, 1997. 60p. (IPH, v.34) SILVA, D.D.; GOMES FILHO, R.R.; PRUSKI, F.F.; PEREIRA,
S.B. & NOVAES, L.F. Chuvas intensas no Estado da Bahia. R. Bras. Eng. Agríc. Amb., 6:362-367, 2002. SILVA, D.D.; PINTO, F.R.L.P.; PRUSKI, F.F. & PINTO, F.A.
Estimativa e espacialização dos parâmetros da equação de intensidade-duração-frequência da precipitação para os Estados do Rio de Janeiro e Espírito Santo. Eng. Agríc., 18:11-21, 1999.
SOPRANI, M.A. & REIS, J.A.T. Proposição de equações de intensidade-duração-frequência de precipitações para a bacia do rio Benevente, ES. R. Capixaba Ci. Tecnol., 2:18-25, 2007.
TOMAZ, P. Cálculos hidrológicos e hidráulicos para obras municipais. São Paulo, Navegar, 2002. 475p.
TUCCI, C.E.M.; POROT, R.L.L. & BARROS, M.T. Drenagem urbana. Porto Alegre, UFRGS, 1995.428p.