Nutrient concentrations in coastal waters: Impact of the Guadiana River
Concentraciones de nutrientes en aguas costeras: Impacto del Río Guadiana
A. Cravo1 M. Madureira1
F. Rita1 A.J. Silva2 M.J. Bebianno1* 1 UCTRA, University of Algarve
Centre of Marine and Environmental Research (CIMA) Campus de Gambelas, 8000-810 Faro, Portugal
*E-mail: [email protected]
2 Hydrographic Institute, Oceanographic Division Rua das Trinas 49
1249-093 Lisboa, Portugal
Recibido en octubre de 2001; aceptado en noviembre de 2002
Abstract
Water samples were collected over an area of 900 km2 adjacent to the outflow of the Guadiana River in January 1999 to characterize the concentrations and spatial distribution of nutrients (ammonium, nitrite, nitrate, phosphate and silicate) in the water column. The purpose of the study was to characterize a winter situation of low discharge in terms of nutrient concentrations in the coastal area adjacent to the Guadiana outflow, before the reduction of the river flow due to the completion of the Alqueva Dam. The results show that the maximum influence of the Guadiana outflow was close to the mouth of the Guadiana River, where the highest nutrient concentrations and the minimum of salinity were registered. At the surface, the nutrient concentrations decreased gradually as the distance from the coast increased. The influence of the Guadiana outflow at the surface, despite being small, was evident in the area of about 90 km2 that extends westwards from the mouth of the river. In this area, the increase in N compounds was more significant than in P and Si. The vertical influence of the outflow of the Guadiana River, until over the isobath lower than 30 m, was reflected in nutrient concentrations that decreased with the increase in depth. However, when the depth of the water column was greater than 30 m, the nutrient concentrations increased with the increase in depth. It is expected that with the completion of the Alqueva Dam, the outflow of the Guadiana River will be reduced even further. Nutrient concentrations will also be reduced and the influence of the river in the coastal zone will be even smaller. This could have a negative impact on the nutrient biogeochemical cycles and on the overall productivity of the area.
Key words: nutrients, Guadiana River, coastal waters, Alqueva Dam.
Resumen
En un área de 900 km2 alrededor de la desembocadura del Río Guadiana se recolectaron muestras de agua para caracterizar las concentraciones y distribución espacial de nutrientes (amonio, nitritos, nitratos, fosfatos y silicatos) en la columna de agua. El propósito de este estudio fue caracterizar la condición invernal de pocas descargas, en términos de concentración de nutrientes en el área costera adyacente a la desembocadura del Guadiana, antes de que el flujo del río se vea reducido por la conclusión de la Presa Alqueva. Los resultados indican que la mayor influencia de la descarga del Guadiana se observó cerca de la boca del río, donde se registraron las mayores concentraciones de nutrientes y la salinidad más baja. En superficie, las concentraciones de nutrientes disminuyeron gradualmente con el aumento de la distancia a la costa. La influencia de la descarga del Guadiana en superficie, aunque pequeña, fue evidente en el área de ~90 km2 que se extiende de la boca del río hacia el oeste. En esta área el incremento de compuestos de N fue más significativo que el de los de P y Si. La influencia vertical de la descarga del Río Guadiana, hasta por encima de la isóbata < 30 m se reflejó en las concentraciones de nutrientes que disminuyeron conforme aumentaba la profundidad. Sin embargo, cuando la profundidad de la columna de agua era > 30 m las concentraciones de nutrientes aumentaron con la profundidad. Es de esperar que con la terminación de la Presa Alqueva la descarga del río se vea aún más disminuida. Las concentraciones también se verán reducidas y la influencia del río en la zona costera será aún menor. Esto podría tener un impacto negativo en los ciclos biogeoquímicos de nutrientes y en la productividad global del área.
Introduction
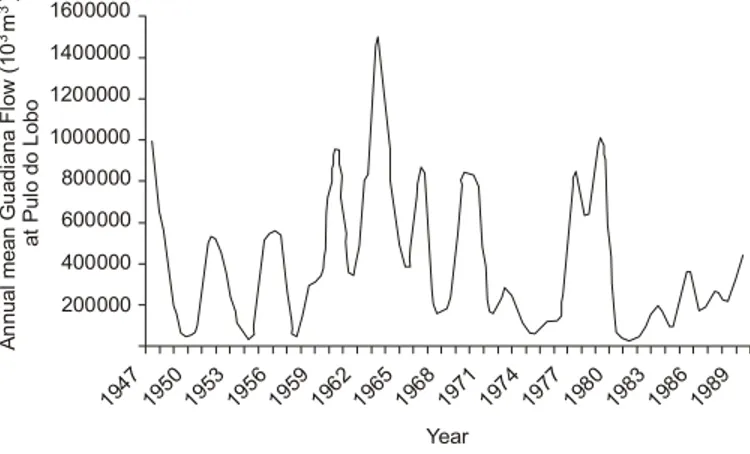
The Guadiana River is the fourth most important river of the Iberian Peninsula. This river, in the southern border between Portugal and Spain, is 810 km long, with a drainage area of about 67,000 km2 of which 17% is Portuguese and 83% is Spanish. The Guadiana River has a very irregular flow, on both seasonal and interannual time scales, associated with cli-matic conditions and regulation management. The mean annual variability of the Guadiana River flow, at the hydrometric station of Pulo do Lobo (37º48′N, 7º38′W), ca 50 km upstream from the mouth of the Guadiana River, for the period 1947–1989 (historical data from INAG, public access data) is shown in figure 1. During this period, the flow ranged annually from 33 × 106 m3 (1981) to 150 × 107 m3 (1963), and from negligible values in the dry season (September 1954) to about 665 × 107 m3 monthly during flood conditions (January 1970).
Dams restrict the freshwater flow regime and the associated load of suspended particles, having repercussions on the water quality of riverine, estuarine and adjacent coastal waters. One of the possible changes in the water quality is a decrease in the nutrient concentrations (Si, N and P) transported by land drainage and river runoff to the coastal zone. The construction of the Alqueva Dam (with a storage capacity of ∼4150 hm3 of water) may have a significant impact on the nutrient concentra-tions of the Guadiana River, its estuary and coastal zone.
Evidence of significant effects in open coastal waters due to damming is sparse (Humborg et al., 1997). However, the extension of the impact of the river outflow on adjacent coastal waters depends upon the variability of the river flow regime and the distance to the mouth of the estuary. It is well docu-mented that areas receiving river discharges have nutrient and phytoplankton concentrations much higher than the adjacent open seas (Cruzado and Velasquez, 1990). Nutrients are the biolimiting elements that play a central role in controlling the
Introducción
El Río Guadiana es el cuarto más importante de la Península Ibérica. Este río, en la frontera sur entre Portugal y España, tiene 810 km de largo con una cuenca de drenaje de alrededor de 67,000 km2, de los cuales 17% están en Portugal y 83% en España. El Río Guadiana tiene un flujo muy irregular, tanto en la escala de tiempo estacional como en la interanual, asociadas con las condiciones climáticas y con el manejo del régimen de la cuenca. La variabilidad anual media del flujo del Río Guadiana en la estación hidrométrica de Pulo do Lobo (37º48′ N; 7º38′ W), ca 50 km río arriba de su desembocadura, durante el periodo 1947–1989 (datos históricos de INAG, datos de acceso público) se muestran en la figura 1. Durante este periodo el flujo varió anualmente de 33 × 106 m3 (1981) a 150 × 107 m3 (1963), y de valores insignificantes en la época de secas (septiembre de 1954) hasta cerca de 665 × 107 m3 mensuales en condiciones de inundación (enero de 1970).
Las presas restringen el régimen de flujo de agua dulce y el de la carga de partículas suspendidas asociada a éste, teniendo gran repercusión en la calidad de las aguas del río, el estuario y la zona costera adyacente. Uno de los cambios posibles en la calidad del agua es la disminución en las concentraciones de nutrientes (Si, N y P) transportados por el drenaje desde tierra y la descarga pluvial a la zona costera. La construcción de la Presa Alqueva (con una capacidad de almacenaje de ~t4150 hm3 de agua) podría tener un impacto significativo en las con-centraciones de nutrientes del Río Guadiana, de su estuario y de la zona costera vecina.
Existe una profusión de evidencias de los impactos signifi-cativos ocasionados por la construcción de presas (Humborg et al., 1997). No obstante, la extensión del impacto de la descarga del río en las aguas adyacentes depende de la variabilidad del régimen de flujo del mismo y de la distancia a la boca del estuario. Está bien documentado que las áreas que reciben descargas fluviales presentan concentraciones mucho más ele-vadas de nutrientes y fitoplancton que sus zonas adyacentes de mar abierto (Cruzado y Velasquez, 1990). Los nutrientes son elementos biolimitantes que juegan un papel central en el control de la productividad primaria y en la productividad bio-lógica global de las zonas costeras (Libes, 1992). Una gran reducción de la descarga de agua dulce en estas áreas puede causar una disminución en las concentraciones de nutrientes (Wetsteyn y Kromkamp, 1994).
En áreas costeras influenciadas directamente por estuarios, el silicato es una de los nutrientes que podría mostrar un cam-bio marcado en su concentración debido a la reducción del flujo de agua dulce. Los ríos transportan hacia las zonas coste-ras concentraciones de silicato uno o dos órdenes de magnitud mayores a las comunes en el agua de mar (Bien et al., 1958; Banoub y Burton, 1968; Liss y Spencer, 1970; Liss y Pointon, 1973). Después de la construcción de la presa en el Río Danubio se observó una reducción del silicato en un 70%, con una disminución asociada del 60% de este nutriente en las aguas superficiales del área costera del Mar Negro central Figure 1. Annual mean flow of the Guadiana River at Pulo do Lobo during
the period 1947–1989 (source: INAG, public access data).
Figura 1. Flujo medio anual del Guadiana en Pulo do Lobo durante el
periodo 1947–1989 (fuente: INAG, fatos de acceso público).
1600000 1400000 1200000 1000000 800000 600000 400000 200000 194719501953195619591962196519681971197419771980198319861989 Year A n nual m ean G u adi ana F low ( 10 m ) at Pul o do L obo 3 3
(Humborg et al., 1997). Como resultado de ello se vieron alteradas las razones N:Si y Si:P, lo cual pudo haber sido la causa de cambios dramáticos en la composición del fitoplanc-ton, cambiando de especies de diatomeas a especies no silíceas (Justic et al., 1994; Humborg et al., 1997). Así, las presas podrían hasta cierto punto afectar los ciclos biogeoquímicos de los nutrientes y la estructura de la cadena alimenticia en las zonas costeras.
Por lo tanto, a fin de evaluar alteraciones futuras en la distribución de las concentraciones de nutrientes en la zona costera adyacente al Río Guadiana, asociadas a la terminación de la Presa Alqueva, es muy importante caracterizar su situa-ción actual en condiciones invernales y estivales. El objetivo de este estudio fue, durante condiciones invernales de escasas descargas fluviales: (1) definir el área de influencia de los aportes del Río Guadiana, (2) evaluar su interacción con las aguas oceánicas, y (3) estudiar la distribución vertical de las concentraciones de nutrientes en el area de la plataforma continental adyacente directamente influenciada por el Río Guadiana. Para ello, se tomaron muestras de agua de mar a diferentes profundidades en condiciones invernales, en un área donde era de esperarse la influencia del impacto del Río Guadiana.
Materiales y métodos
En enero de 1999 se tomaron muestras de agua durante un crucero oceanográfico a bordo del B/O N.R.P. Almeida Carvalho. El área de muestreo (fig. 2) fue cubierta por una red de 38 estaciones, enmarcada entre los meridianos de Vila Real Sto António (7.4º W) y Tavira (7.7º W), desde la línea de costa (37.15º N) hasta la isóbata de los 500 m (36.85º N). Las estaciones de muestreo se espaciaron aproximadamente 2 km la una de la otra.
Se tomaron muestras de agua de superficie y a diferentes profundidades utilizando una roseta equipada con 12 botellas
sampling stations 1 2 3 45 6 7 8 9 10 1112 13 14 15 16 17 18 19 20 21 22 23 24 25 26 27 28 29 3031 32 33 34 35 36 37 38 Oceanographic survey -8.0 -7.9 -7.8 -7.7 -7.6 -7.5 -7.4 -7.3 -7.2 36.8 36.9 37.0 37.1 37.2 37.3 10 20 30 50 100 150 200 300 400 500 Faro
primary production and the overall biological productivity of the coastal zones (Libes, 1992). A huge reduction of the fresh-water discharge in these areas may cause a decrease in nutrient concentrations (Wetsteyn and Kromkamp, 1994).
In coastal areas directly influenced by estuaries, silicate is one of the nutrients that could show a marked change in its concentration due to the reduction of freshwater flow. Rivers transport to the coastal zones concentrations of silicate one to two orders of magnitude higher than those in seawater (Bien et al., 1958; Banoub and Burton, 1968; Liss and Spencer, 1970; Liss and Pointon, 1973). In the Danube River, after the dam construction a reduction of 70% in silicate was observed, with a concomitant decrease of more than 60% of this nutrient in the coastal area of central Black Sea surface waters (Humborg et al., 1997). As a result, N:Si and Si:P ratios were distorted, which could be responsible for dramatic shifts in the phytoplankton composition, with species changing from diatoms to non-siliceous species (Justic et al., 1994; Humborg et al., 1997). Thus, dams, to some extent, could affect the biogeochemical cycling of nutrients and the food web structure in coastal areas.
Therefore, in order to assess future alterations on the distri-bution of nutrient concentrations in the coastal area adjacent to the Guadiana River, associated with the completion of the Alqueva Dam, it is very important to characterize the present situation in winter and summer conditions. So, the objective of the present study was, during winter conditions of low river discharge, to: (1) define the area influenced by the outflow of the Guadiana River, (2) evaluate its interaction with oceanic waters, and (3) study the vertical distribution of the nutrient concentrations in the adjacent continental shelf area directly influenced by the Guadiana River. For this, seawater samples were collected at different depths in winter conditions, in an area where the influence of the Guadiana River impact was expected.
Materials and methods
In January 1999, water samples were collected during an oceanographic cruise on board the R/V N.R.P. Almeida Carvalho. The sampling area (fig. 2) covered a grid of 38 stations, framed by Vila Real Sto António (7.4º W) and Tavira (7.7º W) meridian lines, from the coastline (37.15º N) until the isobath of 500 m (36.85º N). The sampling stations were spaced approximately 2 km from each other.
Water samples were collected at the surface and at different depths using a Rosette equipped with 12 Niskin water bottles. The depth at which samples were collected ranged from about 10 m to approximately 500 m. At the stations where the water column was lower than 100 m, water samples were collected at the surface and bottom. At the stations where the water column was greater than 100 m, an intermediate level of the water column was selected for sampling the water. This depth was defined by the nephelometric signal of a CTD profile and
Water samples were filtered through 0.45-µm pre-weighed membrane filters and frozen at –20ºC prior to the analysis of nutrient concentrations. Ammonium (NH4+), nitrite (NO2–), nitrate (NO3–), phosphate (PO43–) and silicate (SiO44–) were analyzed according to the methods described by Grasshoff et al. (1983), using a Skalar autoanalyser. Ammonium, nitrate and silicate were determined over the range 0.2–15 µM, nitrite over the range 0.02–2.5 µM, and phosphate over the range 0.04–2.5 µM. The Marine Nutrient Standard Kit (OSI) was used as reference material.
Contour mapping of the nutrient concentrations was made based on the calculation of areal integrals by the kriging interpolation method, using the Surfer computer programme.
Results and discussion
Surface and bottom spatial distribution of ammonium, nitrite, nitrate, phosphate and silicate concentrations are presented in figures 3, 4, 5, 6 and 7, respectively. The range of the nutrient concentrations at surface, intermediate depth and bottom are summarized in table 1.
de agua Niskin. La profundidad a la que se tomaron las muestras de agua varió de alrededor de 10 m hasta cerca de 500 m. En las estaciones en las que la columna de agua era menor a 100 m. Se recolectaron muestras de superficie y de fondo. En las estaciones donde la profundidad era mayor a 100 m, se seleccionó un punto intermedio en la columna de agua para recoger la muestra. Esta profundidad fue definida por la señal nefelométrica de un perfil CTD y varió de 60 a 440 m.
Las muestras de agua fueron filtradas a través de filtros pre-viamente pesados de membrana de 0.45 mm y se congelaron a 20ºC previo a su análisis de concentración de nutrientes. Se analizaron amonio (NH4+), nitrito (NO2–), nitrato (NO3–), fosfato (PO43–) y silicato (SiO44–) de acuerdo a los métodos descritos por Grasshoff et al. (1983), usando un autoanalizador Skalar. El amonio, el nitrato y el silicato se determinaron en un rango de 0.2 a 15 µM, el nitrito en uno de 0.02 a 2.5 µM, el fosfato en un rango de 0.04 a 2.5 µM. Se utilizó como material de referencia el Juego Estándar de Nutrientes Marinos (OSI).
Los mapas de contornos de concentraciones de nutrientes se elaboraron con base en la integración de áreas por el método
Figure 4. Distribution of nitrite concentrations (µM) at: (a) surface and (b)
bottom.
Figura 4. Distribución de las concentraciones de nitrito (µM) en: (a) superficie y (b) el fondo. 12 3 4 5 6 7 8 9 10 11 12 13 14 15 16 17 18 19 20 21 22 23 24 25 26 27 28 29 30 31 32 33 34 35 36 37 38 -8.0 -7.9 -7.8 -7.7 -7.6 -7.5 -7.4 -7.3 -7.2 36.8 36.9 37.0 37.1 37.2 37.3 Faro 10 20 30 50 100 150 200 300 400 500 Ammonium [µM] Bottom level
b
1 2 3 4 5 6 7 89 1011 12 13 14 15 16 17 18 19 20 21 22 23 24 25 26 27 28 29 3031 32 33 34 35 36 37 38 -8.0 -7.9 -7.8 -7.7 -7.6 -7.5 -7.4 -7.3 -7.2 36.8 36.9 37.0 37.1 37.2 37.3 Faro 10 20 30 50 100 150 200 300 400 500 Ammonium [µM] Surface levela
1 2 3 4 5 6 7 8 9 1112 13 14 15 16 17 1819 20 21 22 23 24 25 26 27 28 2930 31 32 33 34 35 36 37 38 -8.0 -7.9 -7.8 -7.7 -7.6 -7.5 -7.4 -7.3 -7.2 36.8 36.9 37.0 37.1 37.2 37.3 Faro 10 20 30 50 100 150 200 300 400 500 Nitrite [µM] Surface levela
10 1 2 3 4 5 6 7 8 9 10 1112 13 14 15 16 17 18 19 20 21 22 23 24 25 26 27 28 29 30 31 32 33 34 35 36 37 38 -8.0 -7.9 -7.8 -7.7 -7.6 -7.5 -7.4 -7.3 -7.2 36.8 36.9 37.0 37.1 37.2 37.3 Faro 10 20 30 50 100 150 200 300 400 500 Nitrite [µM] Bottom levelb
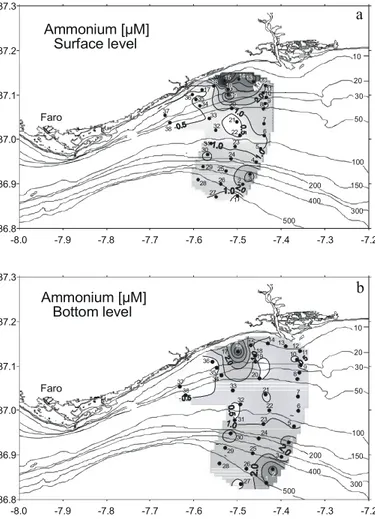
Figure 3. Distribution of ammonium concentrations (µM) at: (a) surface and
(a) bottom.
Figura 3. Distribución de las concentraciones de amonio (µM) en: (a) superficie y (b) el fondo.
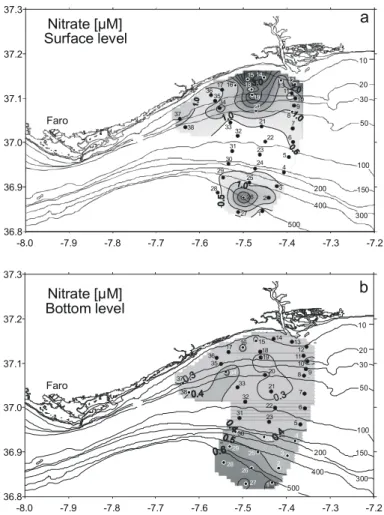
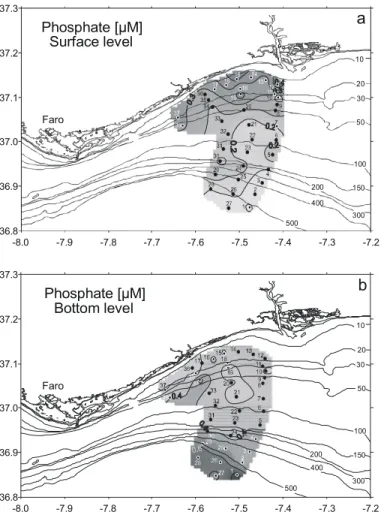
As can be seen from the surface data of ammonium, nitrite, nitrate, phosphate and silicate distribution (figs. 3a, 4a, 5a, 6a, 7a, respectively), the influence of the Guadiana River outflow was small. No plume of reduced salinity was observed in the coastal area associated with the Guadiana outflow. The relative freshwater contribution, calculated from the minimum salinity registered (S = 35.62; Instituto Hidrográfico, 1999a) in relation to the mean salinity of this coastal area (S = 36.30) was about 2%, detected particularly at the surface close to the mouth of the river (station 12, fig. 2). While salinity was minimum, the concentrations of silicate (3.45 µM) and phosphate (0.45 µM) were maximal along with the highest ammonium, nitrite and nitrate concentrations (NH4+ = 6.64 µM, NO2–= 0.56 µM and NO3– = 2.94 µM). The flow recorded at the hydrological station of Pulo do Lobo was small (17 m3 s–1) for this time of the year when compared with the hydrological regime of previous years and with the overall mean value for the period 1947–1989 (∼340 and 156 m3 s–1, respectively; table 2). In fact, the mean flow for this time of the year was similar to those observed in summer months (table 2). However, even during winter, the flow of the Guadiana River
de interpolación conocido como kriging, usando el programa computacional Surfer.
Resultados y discusión
Las distribuciones espaciales, superficial y de fondo, de amonio, nitrito, nitrato, fosfato y silicato se presentan en las figuras 3, 4, 5, 6 y 7, respectivamente. Los intervalos de variación de las concentraciones de nutrientes en superficie, a profundidad intermedia y en el fondo se encuentran resumidos en la tabla 1.
Como se puede observar a partir de los datos superficiales de distribución de amonio, nitrito, nitrato, fosfato y silicato (figs. 3a, 4a, 5a, 6a, 7a, respectivamente), la influencia de las descargas del Río Guadiana es poca. No se observó ninguna pluma de baja salinidad asociada a ella en el área costera. La contribución relativa de agua dulce, calculada a partir de la salinidad mínima registrada (S = 35.62; Instituto Hidrográfico, 1999a) en relación con la salinidad media de esta área costera (S = 36.30) fue alrededor del 2%, detectada particularmente en superficie cerca de la boca del río (estación 12, fig. 2). Cuando la salinidad fue mínima, las concentraciones de silicato (3.45 µM) y fosfato (0.45 µM) fueron máximas, junto con las concentraciones más elevadas de amonio, nitrito y nitrato (NH4+ = 6.64 µM, NO2– = 0.56 µM y NO3– = 2.94 µM). El flujo registrado en la estación hidrológica de Pulo do Lobo fue poco (17 m3 s–1) para esta época del año al compararlo con los regímenes hidrológicos de años previos y con la media global durante el periodo 1947–1989 (~340 y 156 m3 s–1, respectiva-mente; tabla 2). De hecho, el flujo medio en esta época del año fue similar a los observados en los meses de verano (tabla 2). Sin embargo, aún en el invierno, el flujo del Guadiana es muy irregular y varió de 5 m3 s–1 (enero de 1983) a 2483 m3 s–1 (enero de 1970).
Los rangos de las concentraciones de nutrientes en este tra-bajo fueron del mismo orden de magnitud que las encontradas
Figure 5. Distribution of nitrate concentrations (µM) at: (a) surface and (b)
bottom.
Figura 5. Distribución de las concentraciones de nitrato (µM) en: (a) superficie y (b) el fondo. 1 2 3 4 5 6 7 8 910 11 13 14 15 16 17 18 19 20 21 22 23 24 25 26 27 28 29 30 31 32 33 34 35 36 37 38 -8.0 -7.9 -7.8 -7.7 -7.6 -7.5 -7.4 -7.3 -7.2 36.8 36.9 37.0 37.1 37.2 37.3 Faro 10 20 30 50 100 150 200 300 400 500 Nitrate [µM] Surface level
a
12 1 2 3 4 5 6 7 8 9 10 1112 13 14 15 16 17 18 19 20 21 22 23 24 25 26 27 28 29 30 31 32 33 34 35 36 37 38 -8.0 -7.9 -7.8 -7.7 -7.6 -7.5 -7.4 -7.3 -7.2 36.8 36.9 37.0 37.1 37.2 37.3 Faro 10 20 30 50 100 150 200 300 400 500 Nitrate [µM] Bottom levelb
Table 1. Range of nutrient concentrations (µM), minimum (min) andmaximum (max), registered at the surface, intermediate nephelometric depth and bottom level.
Tabla 1. Rango de las concentraciones de nutrientes (µM), mínimo (min)
and máximo (max), regististrados en la superficie, en un nivel nefelométrico intermedio y en el fondo.
Nutrient (µM)
Surface Intermediate depth Bottom
min max min max min max
NH4+ n.d. 10.35 n.d. 7.12 n.d. 6.34 NO2– 0.04 0.87 0.04 0.41 0.04 1.06 NO3– n.d. 4.65 0.35 10.15 0.46 7.51 PO43– 0.10 0.45 0.23 0.66 0.19 0.74 SiO44– 0.25 3.45 0.50 4.26 0.79 5.73 n.d. = not detected
en la zona costera adyacente a la desembocadura del Guadiana en septiembre y octubre de 1998 (CEDEX, 1998), cuando el flujo fue de 18 a 32 m3 s–1 (considerado bajo, típico de las condiciones de verano) y de 39 a 125 m3 s–1 (típico de condiciones invernales), respectivamente. Con una descarga mayor (noviembre de 1998), con excepción del amonio, todas las demás concentraciones máximas de nutrientes fueron más elevadas que las obtenidas en este trabajo (tablas 1, 3).
Los rangos de las concentraciones de nutrientes no fueron significativamente diferentes al compararlos con otros obte-nidos en condiciones de flujo similares a lo largo del estuario del Guadiana (tablas 1, 3), particularmente en su parte baja (~12 km río arriba de la boca), entre octubre de 1996 y marzo de 1998 (Chicharo et al., 2001; Rocha et al., 2002; tabla 3). Sin embargo, las diferencias son evidentes cuando se comparan los periodos de mayor flujo, como en el caso de diciembre de 1997 (tabla 3). Consecuentemente las concentraciones de nutrientes obtenidas en este estudio son típicas de los meses de invierno con bajo flujo de descarga fluvial.
Los datos anteriores brindaron una valiosa información puntual de la magnitud de las concentraciones de nutrientes en is very irregular, ranging from 5 m3 s–1 (January 1983) to 2483
m3 s–1 (January 1970).
The ranges of nutrient concentrations obtained in the present work were of the same order of magnitude as those found in the coastal area adjacent to the Guadiana outflow in September and October 1998 (CEDEX, 1998), when the flow was 18–32 m3 s–1 (considered small, typical of summer conditions) and 39–125 m3 s–1 (typical of winter conditions), respectively. With a higher outflow (November 1998), except for ammonium, all the other maximal nutrient concentrations were higher than the ones obtained in this work (tables 1, 3).
The ranges of nutrient concentrations were not significantly different when compared with others obtained in similar flow conditions along the Guadiana estuary (tables 1, 3), particu-larly in its lower part (∼12 km upstream from the mouth), between October 1996 and March 1998 (Chicharo et al., 2001; Rocha et al., 2002; table 3). However, the differences are evi-dent when periods of high flow were compared, as was the case of December 1997 (table 3). Consequently, the nutrient concentrations in this study are typical of the winter months of low river flow discharge.
1 2 3 4 5 6 7 8 9 10 11 12 13 14 15 16 17 18 19 20 21 22 23 24 25 26 27 28 29 30 31 32 33 34 35 36 37 38 -8.0 -7.9 -7.8 -7.7 -7.6 -7.5 -7.4 -7.3 -7.2 36.8 36.9 37.0 37.1 37.2 37.3 Faro 10 20 30 50 100 150 200 300 400 500 Silicate [µM] Surface level
a
1 2 3 4 5 6 7 8 9 10 11 12 13 14 15 16 17 18 19 20 21 22 23 24 25 26 27 28 29 30 31 32 33 34 35 36 37 38 -8.0 -7.9 -7.8 -7.7 -7.6 -7.5 -7.4 -7.3 -7.2 36.8 36.9 37.0 37.1 37.2 37.3 Faro 10 20 30 50 100 150 200 300 400 500 Silicate [µM] Bottom levelb
-8.0 -7.9 -7.8 -7.7 -7.6 -7.5 -7.4 -7.3 -7.2 36.8 36.9 37.0 37.1 37.2 37.3 Faro 10 20 30 50 100 150 200 300 400 500 Phosphate [µM] Surface levela
-8.0 -7.9 -7.8 -7.7 -7.6 -7.5 -7.4 -7.3 -7.2 36.8 36.9 37.0 37.1 37.2 37.3 Faro 10 20 30 50 100 150 200 300 400 500 Phosphate [µM] Bottom levelb
Figure 6. Distribution of phosphate concentrations (µM) at: (a) surface and
(b) bottom.
Figura 6. Distribución de las concentraciones de fosfato (µM) en: (a) superficie y (b) el fondo.
Figure 7. Distribution of silicate concentrations (µM) at: (a) surface and (b)
bottom.
Figura 7. Distribución de las concentraciones de silicato (µM) en: (a) superficie y (b) el fondo.
The preceding data provided valuable “snapshot” informa-tion on the magnitude of the nutrient concentrainforma-tions in the waters adjacent to the Guadiana outflow that could not be representative of the typical winter situation, when flows are expected to be generally higher (table 2). However, as typically found in coastal areas affected by estuarine discharge, a general enrichment in nutrient concentrations was evident at the stations closest to the estuary, those over the 10-m isobath, when compared with other data collected along the south Portuguese coast from areas not directly influenced by fresh-water inputs (table 3).
The influence of the Guadiana outflow at the surface, despite being small, was evident in the area of about 90 km2 that extends westwards from the mouth of the river. This area is 15 km long (stations 9 to 19) and 6 km wide. This drift was also observed in the distribution of the surface suspended solids collected at the same time (Instituto Hidrográfico, 1999b). A similar drift to the west was recorded, 20 years ago, at the mouth of the estuary, when a turbid water mass was observed during measurements of physical parameters in the Guadiana estuary and adjacent coastal area (Michel, 1980). Moreover, Almeida (1999), using satellite imagery, observed a surface countercurrent directed to the west parallel to the Algarve coast throughout the year. In this particular area of 90 km2, surface nutrient concentrations were higher than those between the isobaths of 30 to 100 m (figs. 3a, 4a, 5a, 6a, 7a). A comparison of the mean surface nutrient concentrations and the N:P and N:Si ratios in these areas is presented in table 4. A three-fold increase in N compounds (mainly ammonium) was observed in the area of influence of the Guadiana River out-flow, whereas the increase in silicate was low (∼25%, table 4). During this study, the presence of this surface countercurrent was the major factor affecting the surface nutrient distribution due to the small outflow influence. However, as the Guadiana estuary is very influenced by tide (tidal influence is felt until
∼50 km upstream from the mouth), those processes associated with tidal fluxes, tidal conditions and regimes must also be taken into account when studies on the distribution of nutrient concentrations are performed around the Guadiana mouth.
las aguas adyacentes a la desembocadura del Guadiana que pudieran no ser representativos de las condiciones invernales típicas, cuando se espera que los flujos sean en general mayo-res (tabla 2). Sin embargo, como típicamente ocurre en zonas costeras afectadas por una descarga estuarina, al comparar las concentraciones de nutrientes con otros datos obtenidos a lo largo de la costa sur de Portugal de áreas no influenciadas por aportes de agua dulce fue evidente un enriquecimiento en las estaciones mas cercanas al estuario, en aquellas que estaban por encima de la isóbata de 10 m (tabla 3).
La influencia de la descarga del Guadiana en superficie, aunque pequeña, fue evidente en el área de 90 km2 que se extiende de la boca del río hacia el oeste. Esta área tiene 15 km de largo (estaciones 9 a 19) y 6 km de ancho. Esta deriva también se observó en la distribución de los sólidos suspendi-dos en superficie recolectasuspendi-dos al mismo tiempo (Instituto Hidrográfico, 1999b). Hace 20 años ya se había también regis-trado una deriva similar hacia el oeste en la boca del estuario, cuando se observó una masa de agua turbia durante la medi-ción de parámetros físicos en el estuario del Guadiana y su área costera adyacente (Michel, 1980). Además, Almeida (1999), usando imágenes de satélite, observó una contracorriente de superficie dirigida hacia el oeste paralela a la costa del Algarve a lo largo de todo el año. En esta área particular de 90 km2, las concentraciones superficiales de nutrientes fueron mayores que las encontradas entre las isóbatas de los 30 y 100 m (figs. 3a, 4a, 5a, 6a, 7a). En la tabla 4 se presenta una comparación entre las concentraciones medias superficiales y las razones N:P y N:Si de estas áreas. Se observó que los compuestos nitrogena-dos (principalmente el amonio) se triplicaron en el área de influencia de la desembocadura del Guadiana, mientras que el silicato era escaso (~25%, tabla 4) Durante este estudio, la presencia de esta contracorriente de superficie fue el factor principal que afectó la distribución superficial de nutrientes debido a la limitada influencia de la descarga. No obstante, como el estuario del Guadiana se encuentra influenciado por la marea (cuya influencia se deja sentir hasta ~50 km río arriba de la boca), cuando se realizan estudios de distribución de la Table 2. Guadiana River flow (m3 s–1) at Pulo do Lobo (ca 50 km upstream from the mouth) during three consecutive hydrological years: 1997/1998, 1998/1999
and 1999/2000. Overall mean for the period 1947–1989 and mean for January months during this period.
Tabla 2. Flujo del Río Guadiana (m3 s–1) en Pulo do Lobo (ca 50 km río arriba de la boca) durante tres años hidrológicos consecutivos: 1997/1998, 1998/1999
y 199/2000. Promedio global para el periodo 1947–1989 y promedio de los meses de enero del mismo periodo.
Year Oct Nov Dec Jan Feb Mar Apr May Jun Jul Aug Sep Mean
97/98 26 642 851 540 1105 93 25 63 19 15 21 39 297
98/99 40 44 34 17 11 14 9 14 5 5 10 13 19
99/00 88 32 16 16 17 9 69 128 8 9 10 14 35
Overall mean flow for
1947–1989 156
Mean for January months
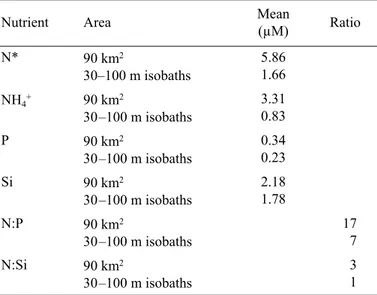
During this study, in the area of the Guadiana outflow influence, the N:P and N:Si ratios calculated were 17 and 3, respectively (table 4). These ratios support the assumption that the N compounds were in excess and showed that P and Si were the limiting elements. Surface nutrient concentrations decreased with the increase in distance from the coast. This was observed at stations with a water column depth greater than 30 m where salinity increased, reaching values of 36.4. This is due to the two component mixing system, mixture of freshwater with seawater (Coste et al., 1987; Cruzado and Velasquez, 1990; Lefevre et al., 1997). The N:P and N:Si ratios at the surface decreased from 17 to 7 and from 3 to 1, respectively (table 4), over the isobaths between 30 and 100 m, indicating that in the water mass between those isobaths, N was the limiting element. This is usual in typical marine waters. However, surface nutrient concentrations were generally lower than in the areas over the isobath greater than 100 m. This can indicate that the primary production in that area was more important than in more remote stations. However, the effect of the alteration of the nutrient ratios upon the phytoplankton assemblages was not studied.
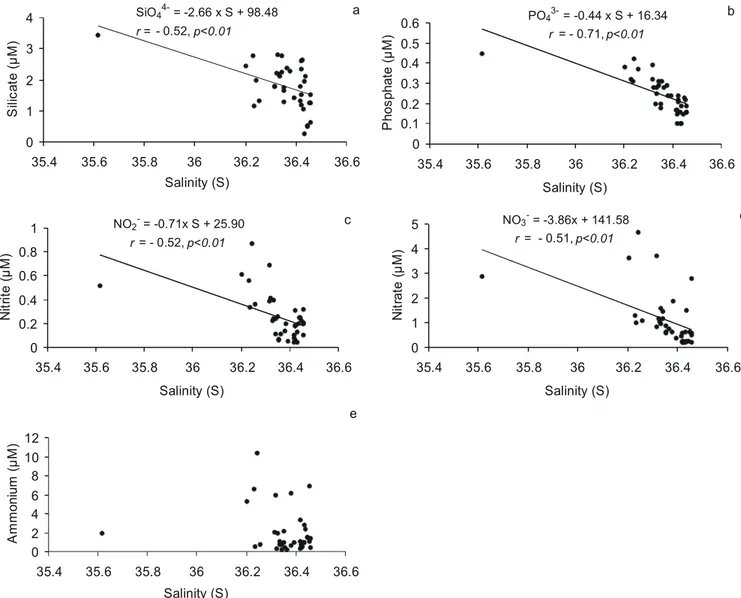
One of the major input of nutrients in coastal areas are river discharges (Valiela et al., 1991; Rabalais, 1996); however, the extension of river discharges depends on the volume of water that reaches the coastal zone (variability of the river discharge regime) and on its spread in the coastal zone. Areas that are markedly influenced by river discharges show evident nutrient gradients along with changes in salinity. Nutrient concentra-tions in these areas are much higher than in the adjacent open seas and decrease as salinity increases, tending to behave conservatively in rapidly flushed estuaries (Balls, 1994). This is particularly evident during winter, when little or no loss of nutrients through phytoplankton consumption was expected, due to their minimal activity (Cruzado and Velasquez, 1990). The conservative mixing of nutrients is a function of the estuarine flushing time that controls the extent to which internal processes (biological and abiotic) can modify nutrient inputs. Significant negative relationships are usually found between nutrient concentrations and salinity in a wide range of salinity, in which nutrient concentrations are higher at lower salinity. In these cases, the nutrient used as the best freshwater tracer is silicate (Hunt and Foster, 1977, 1985). The relation-ship between surface nutrient concentrations and salinity is presented in figure 8. Significant relationships exist between nutrient concentrations and salinity although the correlation coefficients between variables were relatively low (P < 0.01) (fig. 8). This was attributed partly to the small amplitude of salinity associated with the reduced influence of the Guadiana outflow. However, in this study silicate was not the best tracer to identify the presence of freshwater input. The nutrient that showed the highest conservative behaviour was phosphate (r = –0.71; fig. 8b). Some departure from the theoretical dilution line was observed for those points that were off the regression line, which corresponded to samples in the area directly influenced by the freshwater discharge (stations 12,
concentración de nutrientes en las inmediaciones de la boca del Guadiana, también deben de considerarse los procesos asocia-dos con los flujos de marea y sus condiciones y regímenes.
Durante este estudio, en el área de influencia de la descarga del Guadiana las razones N:P y N:Si calculadas fueron 17 y 3, respectivamente (tabla 4). Estas razones apoyan la hipótesis de que existe un exceso de compuestos nitrogenados y mostraron que los elementos limitantes eran P y Si. Las concentraciones de nutrientes en superficie disminuyeron con el incremento de la distancia a la costa. Esto se observó en las estaciones con una profundidad de columna de agua mayor a los 30 m donde la salinidad se incrementó hasta alcanzar valores de 36.4. Esto se debe al sistema de mezcla de dos componentes en el que se mezclan agua dulce y agua de mar (Coste et al., 1987; Cruzado y Velásquez, 1990; Lefevre et al., 1997). Las razones N:P y N:Si en superficie disminuyeron de 17 a 7 y de 3 a 1, respecti-vamente (tabla 4), entre las isóbatas de 30 y 100 m, indicando que en la masa de agua entre estas isóbatas, el N es el elemento limitante, lo que es usual en el agua de mar típica. Sin embargo, las concentraciones superficiales de nutrientes fueron generalmente menores que en las áreas por debajo de la isóbata de los 100 m. Esto puede indicar que la productividad primaria en esta área fue más importante que en las estaciones remotas. Sin embargo, no se estudió el efecto de la alteración de las razones de los nutrientes sobre los grupos de fitoplancton.
Uno de los mayores aportes de nutrientes en las zonas costeras provienen de las descargas de los ríos (Valiela et al., 1991; Rabalais, 1996); sin embargo, la extensión de la descarga de los ríos depende del volumen de agua que llega a la zona costera (variabilidad en el régimen de descargas del río) y de su difusión en la zona costera. Aquellas zonas que están notablemente influenciadas por las descargas de los ríos muestran evidentes gradientes en su concentración de nutrien-tes aparejados con cambios en su salinidad. Las concentracio-nes de nutrientes en estas áreas son mucho mayores que en las áreas oceánicas adyacentes, y disminuyen conforme se incrementa la salinidad, tendiendo a un comportamiento con-servativo en los estuarios que renuevan rápidamente sus aguas (Balls, 1994.) Esto es particularmente evidente en el invierno cuando se esperarían pérdidas mínimas o nulas de nutrientes debidas al consumo del fitoplancton dada la mínima actividad de éste (Cruzado y Velasquez, 1990). La mezcla conservativa de nutrientes está en función de su tiempo de recambio de agua (flushing time) el cual controla la medida en que los procesos internos (biológicos y abióticos) pueden modificar los nutrien-tes a ellos aportados. Usualmente existen relaciones negativas significativas entre concentraciones de nutrientes y salinidad en un amplio intervalo de salinidades en el que a menor salini-dad la concentración de nutrientes es mayor. En estos casos el nutriente utilizado como el mejor trazador del agua dulce es el silicato (Hunt y Foster, 1977, 1985). La relación entre las concentraciones superficiales de nutrientes y la salinidad se presenta en la figura 8. Existen relaciones significativas entre las concentraciones de nutrientes en superficie y la salinidad aunque los coeficientes de correlación entre las variables
13, 14, 15, 19; fig. 2). That possibly resulted from the inherent chemical behaviour of the mixing waters in combina-tion with an in situ non-conservative biological (phytoplankton consumption) behaviour. These relationships are also conditioned by the minimum salinity value (S = 35.6) and consequently they must be interpreted with caution. In fact, if this value is not taken into account, both silicate and ammonium concentrations did not present a conservative behaviour (fig. 8), whereas for the phosphate, nitrite and nitrate concentrations, the correlation coefficients increase with salinity (r = –0.81, r = –0.66 and r = –0.57, respectively). Nevertheless, for more reliable information about the mixture of fresh and marine waters in this area in order to determine the dilution effect upon coastal waters, a wider range of salinity must be covered.
The vertical distribution of nutrient concentrations in the water column with a depth lower than 30 m, showed that concentrations were higher at the surface than at the bottom (figs. 3, 4, 5, 6, 7). This supports the influence of the Guadiana outflow mentioned above. When the water column has a depth greater than 30 m, the nutrient concentrations showed a gradual increase with depth, mainly due to the uptake of
Table 4. Mean surface nutrient concentrations and N:P and N:Si ratio. Tabla 4. Concentraciones medias de nutrientes en superficie y proporciones
N:P y N:Si.
Nutrient Area Mean
(µM) Ratio N* 90 km2 30–100 m isobaths 5.86 1.66 NH4+ 90 km2 30–100 m isobaths 3.31 0.83 P 90 km2 30–100 m isobaths 0.34 0.23 Si 90 km2 30–100 m isobaths 2.18 1.78 N:P 90 km2 30–100 m isobaths 17 7 N:Si 90 km2 30–100 m isobaths 3 1 N* = NH4+ + NO2– + NO3– Table 3. Nutrient concentrations (µM): silicate (SiO44–), phosphate (PO
43–), ammonium (NH4+), nitrite (NO2–), nitrate (NO3–), dissolved inorganic nitrogen (DIN)
and chlorophyll a (Chl a in µg L–1) determined in the coastal area adjacent to the Guadiana estuary, at the lower estuary and at other Algarvian coastal stations
not directly influenced by freshwater inputs.
Tabla 3. Concentraciones de nutrientes (µM): silicato (SiO44–), fosfato (PO43–), amonio (NH4+), nitrito (NO2–), nitrato (NO3–), nitógeno orgánico disuelto (DIN,
por sus siglas en inglés) y clorofila a (Chl a en µg L–1) determinados en la zona costera adyacente al estuario del Guadiana, en la parte baja del estuario y en
otras estacionas costeras del Algarve no indluenciadas directamente por aportes de agua dulce.
Area sampled Period Guadiana
flow (m3 s–1) SiO44– PO43– NH4+ NO2– NO3– DIN Chl a Reference
10-m isobath Jan 99 17 2.66 0.39 6.06 0.64 3.12 9.82 This work
Coastal area near the Guadiana Sep 98 Oct 98 18–32 39–125 1.8–3.2 3.2–3.9 0.06–0.1 0.29–0.74 nd nd nd–0.29 0.29–1.36 nd–1.4 10 nd–3.0 CEDEX (1998) Guadiana low estuary Oct 96– Mar 98 16–1255 2.2 0.9 22.0 18.6 4.8 Chicharo et al. (2001) Apr 97 May 97 Jun 97 Jul 97 Sep 97 Dec 97 Mar 98 17 14 21 8 23 851 93 6.9 0.5 0.5 1.4 5.77 124 1.4 0.5 22.7 0.1 0.1 1.0 1.9 0.1 35.0 26.4 1.2 2.5 5.9 62.4 110 6.0 0.9 2.2 9.3 8.2 1.9 15.7 Rocha et al. (2002) Nov 98 Dec 99 44 16 5 53.2 1.4 4.3 5.0 – 0.3 0.4 5.3 4.9 1.8 Chicharo (not published)
Farol inlet Jun 94 0.64 0.38 1.01 Baptista (1997)
Jan–Dec 92 0.8 0.3 0.3 Falcão (1997)
Apr–Dec 81 1.4 0.2 < 1 Benoliel (1989)
Jul 78, Jun 79 0.1 0.6 Benoliel (1982)
Albufeira Jun 94 1.00 0.58 0.59 Baptista (1997)
Sagres Jun 94 1.55 0.68 0.36 Baptista (1997)
DIN = Σ NH4+ + NO
0 1 2 3 4 35.4 35.6 35.8 36 36.2 36.4 36.6 Salinity (S) Si lica te (µ M ) SiO44- = -2.66 x S + 98.48 r = - 0.52, p<0.01 a PO4 3-= -0.44 x S + 16.34 r = - 0.71, p<0.01 0 0.1 0.2 0.3 0.4 0.5 0.6 35.4 35.6 35.8 36 36.2 36.4 36.6 Salinity (S) P hos phat e (µ M ) b 0 2 4 6 8 10 12 35.4 35.6 35.8 36 36.2 36.4 36.6 Salinity (S) A m m onium (µ M ) e NO3- = -3.86x + 141.58 r = - 0.51, p<0.01 0 1 2 3 4 5 35.4 35.6 35.8 36 36.2 36.4 36.6 Salinity (S) Nit rat e (µ M ) d NO2- = -0.71x S + 25.90 r = - 0.52, p<0.01 0 0.2 0.4 0.6 0.8 1 35.4 35.6 35.8 36 36.2 36.4 36.6 Salinity (S) Nit rit e (µ M ) c
nutrients by phytoplankton at the surface and remineralization in the water column (Saad and Hassan, 1994; Vukadin and Stojanoski, 1996; Padmavathi and Satyanarayana, 1999).
With the completion of the dam, an impoverishment in nutrient concentrations in coastal waters will be expected at the surface (due to the decrease of the river discharge). One way that nutrient concentrations can be reestablished is by mixing with the underlying waters, usually richer in nutrients, or during upwelling events. Effectively, in the bottom layers (depths between 400 and 500 m), nutrient concentrations were generally higher (figs. 3b, 4b, 5b, 6b, 7b), particularly nitrite (1.06 µM), phosphate (0.74 µM) and silicate (5.73 µM) (table 1). At these depths, increases in salinity (maximum S = 36.55) and temperature were observed. These high nutrient concentrations cannot be associated with the impact of the Guadiana outflow but probably to the presence of Mediterranean Water (MW), or to a mixture of MW with
fueron relativamente bajos (P < 0.01) (fig. 8). Esto fue parcialmente atribuido a la poca amplitud de la salinidad asociada con la reducida influencia de las descargas del Guadiana. No obstante, en este estudio el silicato no fue el mejor trazador para identificar la presencia de aportes de agua dulce. El fosfato fue el nutriente que presentó el comporta-miento más conservativo (r = –0.71; fig. 8b). Se observó una ligera desviación de la línea teórica de dilución en los puntos apartados de la línea de regresión, los cuales correspondían a muestras del área directamente influenciada por la descarga de agua dulce (estaciones 12, 13, 14, 15, 19; fig. 2). Posiblemente esto fue resultado del comportamiento químico inherente a las aguas aportadas, en combinación con un comportamiento bio-lógico no conservativo (consumo por el fitoplancton) in situ. Estas relaciones están también condicionadas por la mínima salinidad (S = 35.6) y consecuentemente deben interpretarse con precaución. De hecho, si este valor no se toma en
Figure 8. Relationship between concentration (µM) of: (a) silicate, (b) phosphate, (c) nitrite, (d) nitrate and (e) ammonium and salinity. Figura 8. Relación entre las concentraciones (µM) de: (a) silicato, (b) fosfato, (c) nitrito, (d) nitrato y (e) amonio con la salinidad.
North Atlantic Central Water (NACW). The presence of MW in this region was previously identified (Âmbar, 1983; Zenk and Armi, 1990; Rhein and Hinrichsen, 1993; Almeida, 1999). Âmbar (1983) detected a shallow core of MW off the southern part of the Iberian Peninsula along the continental shelf break and slope at around 400 m. This water, that leaves the Strait of Gibraltar, coming from the Alboran Sea, is generally rich in nutrients (Minas et al., 1983, 1987, 1988, 1991; Packard et al., 1988). At the intermediate level of the water column (over the isobaths greater than 100 m), some ammonium and nitrate concentrations were higher than at the bottom (table 1). These concentrations were observed at around 300 m, in the upper slope of the continental shelf edge where a turbid plume was observed, associated with a positive thermohaline anomaly. Temperature and salinity characteristics were different from those typical of the NACW and identified as a subsurface fila-ment of MW. This water mass can also be a source of nutrients when those are depleted at the surface.
In this particular winter study, the area of influence of the river outflow was reduced due to the small river discharge associated with dry winter conditions. It is expected that during summer, the Guadiana outflow will be even smaller. Therefore, the completion of the Alqueva Dam will have some effects upon the water quality, namely the alteration of the surface nutrient concentrations. Other chemical characteristics of the coastal waters could also change and, in the future, the area of influence of the river will be even smaller than the 90 km2. This could have an important impact in nutrient biogeochemi-cal cycles and affect the food web structure and the overall productivity of the ecosystem. It will be expected that in summer, if a further restriction of the flow (and nutrients) occurs, the structure of the phytoplankton communities could suffer significant alterations. The dominant phytoplankton species in the study area were dinoflagellates, euglenas and marine diatoms in the marine zone, while in the upper estuary, species were typical of freshwater (CEDEX, 1998). Inside the estuary (between October 1996 and March 1998), the higher phytoplankton density was dominated by chlorophytes and cyanobacteria in the upper estuary during summer. In the middle estuary, the dominant species were nanoflagellates, whereas in the lower estuary, they were diatoms, nanoflagel-lates and marine dinoflagelnanoflagel-lates (Gouveia et al., 1999; Chicharo et al., 2001; Rocha et al., 2002). To what extent the conclusion of the Alqueva Dam will affect the phytoplankton community structure and the overall primary productivity inside the Guadiana estuary and in the adjacent coastal area must be assessed in future studies.
Acknowledgements
This study was carried out under project SIRIA funded by a joint venture between the Ministry of Defence and the Founda-tion of the Universities of Portugal in the framework of the Environment and Defence Programme.
consideración, ni la concentración de silicato ni la de amonio presentan una comportamiento conservativo (fig. 8), mientras que los coeficientes de correlación de las concentraciones de fosfato, nitrito y nitrato con la salinidad aumentan (r = –0.81, r = –0.66 y r = –0.57, respectivamente). Sin embargo, para obtener información más confiable acerca de la mezcla de agua dulce y agua de mar en esta área que permita determinar el efecto de dilución sobre las aguas costeras, se debe cubrir un rango mayor de salinidad.
La distribución vertical de las concentraciones de nutrien-tes en la columna de agua a profundidades menores de 30 m mostró que las concentraciones eran mayores en la superficie que en el fondo (figs. 3, 4, 5, 6, 7). Esto confirma la influencia antes mencionada de las descargas del Guadiana. Cuando la columna de agua tuvo una profundidad mayor a 30 m, las con-centraciones de nutrientes mostraron un incremento gradual con la profundidad, debido principalmente a la asimilación de nutrientes por el fitoplancton en superficie y a la remineraliza-ción (Saad y Hassan, 1994; Vukadin y Stojanoski, 1996; Padmavathi y Satyanarayana, 1999).
Con la terminación de la presa es de esperarse un empobre-cimiento en las concentraciones superficiales de nutrientes de las aguas costeras (debido a la disminución de la descarga del río). Una de las maneras en que se pueden restablecer estas concentraciones de nutrientes es con la mezcla con aguas más profundas, usualmente más ricas en nutrientes, o durante eventos de surgencia. En efecto, en las capas del fondo (a profundidades entre 400 y 500 m), las concentraciones de nutrientes fueron generalmente mayores (figs. 3b, 4b, 5b, 6b, 7b), particularmente el nitrito (1.06 µM), el fosfato (0.74 µM) y el silicato (5.73 mM) (tabla 1). A estas profundidades se observaron incrementos en la salinidad (máximo S = 36.55) y en la temperatura. Estas elevadas concentraciones de nutrientes no se pueden asociar con el impacto de las descargas del Guadiana pero probablemente sí con la presencia de Agua Mediterránea (MW), o con una mezcla de MW con Agua Central del Atlántico Norte (NACW). La presencia de MW en esta región ha sido identificada previamente (Âmbar, 1983; Zenk y Armi, 1990; Rhein y Hinrichsen, 1993; Almeida, 1999). Âmbar (1983) detectó un núcleo somero de MW frente al sur de la Península Ibérica a lo largo del margen y el talud continentales alrededor de los 400 m. Estas aguas, que se alejan del Estrecho de Gibraltar, al venir del Mar de Alborán son generalmente ricas en nutrientes (Minas et al., 1983, 1987, 1988, 1991; Packard et al., 1988). A la mitad de la columna de agua (sobre las isóbatas mayores a 100 m), algunas concentraciones de amonio y de nitrato fueron mayores que en el fondo (tabla 1). Estas concentraciones se observaron alrededor de 300 m, en la pendiente superior del margen de la plataforma continental donde se observó una pluma turbia aso-ciada con una anomalía termohalina positiva. La temperatura y la salinidad características fueron diferentes de las típicas de NACW y se identificaron como un filamento subsuperficial de MW. Esta masa de agua puede también constituir una fuente de nutrientes cuando éstos se han agotado en la superficie.
References
Almeida, P.J.R. (1999). The physical oceanography of Cape São Vicente upwelling region observed from sea, land and space. Ph.D. thesis, University of Wales, Bangor, 244 pp.
Âmbar, I. (1983). A shallow core of Mediterranean water off western Portugal. Deep-Sea Res., 30: 677–680.
Balls, P.W. (1994). Nutrient inputs to estuaries from nine Scottish east coast rivers: Influence of estuarine processes on inputs to the North Sea. Estuar. Coast. Shelf Sci., 39(4): 329–352.
Banoub, M.W. and Burton, J.D. (1968). The winter distribution of silicate in Southampton water. J. Cons. Permanent Explor. Mer, 32(2): 201–208.
Baptista, A. (1997). Caracterização física e química da massa de água ao longo da costa sul Algarvia: um estudo pontual. Relatório de Estágio do Curso de Licenciatura em Biologia Marinha e Pescas. Universidade do Algarve, Faro, 40 pp.
Bien, G.S., Contois, D.E. and Thomas W.H. (1958). The removal of soluble silica from freshwater entering the sea. Geochim. Cosmochim. Acta, 14: 35–54.
Benoliel, M.J.A.G. (1982). Controle da poluição na Ria de Faro, Jul 78-Dez 79. Rel. 70, Lisbon.
Benoliel, M.J.A.G. (1989). Vigilância da qualidade da água da Ria Formosa, 1981-1984. Rel. TF-QP04/89. Instituto Hidrográfico, Lisbon.
CEDEX (1998). Estudio de variables ambientales en el tramo onubense del Rio Guadiana. Centro de Estudios de Puertos e Costas, clave OECEX 23-997-5-002.
Chicharo, M.A., Chicharo, L.M., Galvão, H., Barbosa, A., Marques, M.H., Andrade, J.P., Esteves, E., Miguel, C. and Gouveia, I. (2001). Status of the Guadiana estuary (South Portugal) during 1996-1998: an ecohydrological approach. Aquat. Ecosys. Health Management, 4: 73–89.
Coste, A., Cadenes, A. and Minas, H.J. (1987). New observations on the eutrophication of the Gulf of Lion due to input by the Rhone River. 2nd Soviet-French Symposium on Production and Trophic Relationships within Marine Ecosystems. Yalta, 27 October to 2 November 1984. Actes Coloq. IFREMER, 5: 39–40.
Cruzado, A. and Velasquez, Z.R. (1990). Nutrients and phytoplankton in the Gulf of Lions, northwestern Mediterranean. Cont. Shelf Res., 10(9–11): 931–942.
Falcão, M.M. (1997). Dinâmica dos nutrientes na Ria Formosa: efeitos da interacção da laguna com as suas interfaces na reciclagem do azoto, fósforo e sílica. Tese de Doutoramento, Universidade do Algarve, 223 pp.
Gouveia, I., Miguel, C., Chícharo, M.A, Marques, M.H. e Chícharo, L.M. (1999). Plancton do estuário do Guadiana: Sazonalidade e relação com os parâmetro ambientais: Resultados preliminares. Rev. Biol., 17(1–4): 179–192.
Grasshoff, K., Ehrhardt, M. and Kremling, K. (1983). Methods of Seawater Analysis. 2nd ed. Verlag Chemie, Kiel, 419 pp. Humborg, C., Ittekkot, V., Cociasu, A. and Budengen, B.V. (1997).
Effect of Danube River dam on Black Sea biogeochemistry and ecosystem structure. Nature, 336(6623):385–388.
Hunt, D.T.E. and Foster, P. (1977). Studies of the mixing of coastal waters in Liverpool bay using dissolved silicate as a tracer. Water Res., 11: 465–470.
Hunt, D.T.E. and Foster, P. (1985). Dissolved silicon in a North Wales catchment of high relief. Water Res., 19(4): 465–470.
En este estudio invernal en particular, el área de influencia de la desembocadura del río se redujo debido a la descarga pequeña asociada con las condiciones secas del invierno. Se espera que durante el verano las descargas del Guadiana sean menores aún. Por lo tanto, la conclusión de la Presa Alqueva tendrá algunos efectos sobre la calidad del agua, esto es, que las concentraciones superficiales de nutrientes se verán altera-das. Otras características químicas de las aguas costeras podrían también cambiar y la futura área de influencia del río incluso reducirse a menos de 90 km2. Esto podría tener un impacto importante en los ciclos biogeoquímicos de los nutrientes y afectar la estructura de la cadena alimenticia y la productividad global del ecosistema. Se espera que, durante el verano, si se restringe aún más el flujo (y los nutrientes), la estructura de las comunidades de fitoplancton podría sufrir alteraciones significativas. Las especies de fitoplancton dominantes en el área de estudio, en la parte marina son dinoflagelados, euglenas y diatomeas marinas, mientras que las especies de la parte superior del estuario son típicamente de agua dulce (CEDEX, 1998). Dentro del estuario (entre octubre de 1996 y marzo de 1998), en su parte superior la mayor densidad de fitoplancton estuvo dominada por clorofitas y cianobacterias durante el verano. En su parte media, las espe-cies dominantes fueron nanoflagelados mientras que en la parte baja del estuario dominaron diatomeas, nanoflagelados, y dinoflagelados marinos (Gouveia et al., 1999; Chicharo et al., 2001; Rocha et al., 2002). En futuros estudios se deberá estu-diar la magnitud del impacto de la terminación de la Presa Alqeva sobre la estructura de la comunidad de fitoplancton y sobre la productividad primaria global en el estuario del Guadiana y en su area costera adyacente.
Agradecimientos
Este estudio se realizó como parte del proyecto SIRIA, financiado conjuntamente entre el Ministerio de Defensa y la Fundación de las Universidades de Portugal, en el marco del Programa Medio Ambiente y Defensa.
Traducido al español por Manuel Gardea-Ojeda.
Instituto Hidrográfico (1999a). Processamento de dados hidrológicos e nefelométricos recolhidos na campanha SIRIA 99–01. REL TP/ OC/32/99, I.H., Lisbon.
Instituto Hidrográfico (1999b). Progresso dos trabalhos referentes ao primeiro semestre de execução do projecto SIRIA. REL TP/OC/3/ 99, I.H., Lisbon.
Justic, C., Rabalais, N.N. and Turner, R.E. (1994). Riverborne nutrients, hypoxia and coastal ecosystem evolution: Biological responses to long-term changes in nutrient loads carried by the Po and the Mississippi Rivers. In: K.R. Dyer and R.J. Orth (eds.), Changes in Fluxes in Estuaries: Implications from Science to Management. Fredensborg, Denmark, Olsen and Olsen, pp. 161– 167.
Lefevre, D., Minas, H.J., Minas, M., Robinson, C., LeB. Williams, P.J. and Woodward, E.M.S. (1997). Review of gross community production, primary production, net community production and dark community respiration in the Gulf of Lions. Deep Sea Res., 44(3–4): 801–832.
Libes, S.M. (1992). An Introduction to Marine Biogeochemistry. John Wiley & Sons, New York, 734 pp.
Liss, P.S. and Spencer, C.P. (1970). Abiological processes in the removal of silicate from sea water. Geochim. Cosmochim. Acta, 34: 1073–1088.
Liss, P.S. and Pointon, M.J. (1973). Removal of dissolved boron and silicon during estuarine mixing of sea and river waters. Geochim. Cosmochim. Acta, 37: 1493–1498.
Michel, D. (1980). Synthese des donnes mesurées dans le Rio Guadiana: Evaluation de l’intrusion dans l’estuaire. Rapport technique concernant la campagne du mois d’Avril 1979 sur le Rio Guadiana. Laboratoire d’Oceanographie de l’Université Libre de Bruxelles.
Minas, H.J., Coste, B., Le-Corre, P., Minas, M., Packard, T.T. and Raimbault, P. (1983). Role of circulation in the Alboran Sea in the vicinity of the Stait of Gibraltar, on the production-regeneration system (MEDIPROD cruise IV of Jean Charcot). Parr. P. V. Reun. CIESM, 28(7): 59–61.
Minas, H.J., Coste, B. and Minas, M. (1987). The vicinity of the Strait of Gibraltar: A source of a permanent high productivity. 2nd Soviet-French Symposium on Production and Trophic Relation-ships within Marine Ecosystems. Yalta, 27 October to 2 November 1984. Actes Coloq. IFREMER, 5: 40–41.
Minas, H.J., Coste, B., Minas, M., Gostan, J., Nival, P. and Bonin, M.C. (1988). New vs. regenerated production in the northwestern Mediterranean Sea. Oceanol. Acta, 9: 155–162.
Minas, H.J., Coste, B., Le-Corre, P., Minas, M. and Raimbault, P. (1991). Biological and geochemical signatures associated with the water circulation through the Strait of Gibraltar and in the western Alborean Sea. J. Geophysical Res., 95(C5): 8755–8771.
Packard, T.T, Minas, H.J., Coste, B., Martinez, R., Bonin, M.C., Gostan, J. Garfield, P., Christensen, J. and Dortch, Q. (1988). Formation of the Alboran oxygen minimum zone. Deep-Sea Res., 35(7A): 1111–1118.
Padmavathi, D. and Satyanarayana, D. (1999). Distribution of nutrients and major elements in riverine, estuarine and adjoining
coastal waters of Godavari, Bay of Bengal. Indian J. Mar. Sci., 28(4): 345–354.
Rabalais, N.N., Wiseman, W.J. Jr., Turner, R.E., Justic, D., Sen-Gupta, B.K. and Dortch, Q. (1996). Nutrient exchanges in the Mississippi River and system responses on the adjacent continental shelf. Estuaries, 19(2B): 396–407.
Rhein, M. and Hinrichsen, H.H. (1993). Modification of Mediterranean Water in the Gulf of Cadiz, studied with hydrographic and chlorofluoromethanes data. Deep-Sea Res., 40: 267–291.
Rocha, C., Galvão, H. and Barbosa, A. (2002). Role of transient silicon limitation in the development of cyanobacteria blooms in the Guadiana estuary, south-western Iberia. Mar. Ecol. Prog. Ser., 228: 35–45.
Saad, M.A.H. and Hassan, E.M. (1994). Distribution of nutrients in the Rosetta estuary of the Nile and the adjoining coastal Mediterranean waters. 37th Conference of the International Association of Great Lakes Research and Estuarine Research Federation, Buffalo, USA, 1994, p. 166.
Valiela, I., Foreman, K., LaMontagne, M., Hersh, D., Costa, J., Peckol, P., DeMeo,-Andreson, B, D’Avanzo, C. and Babione, M. (1991). Couplings of watersheds and coastal waters: Sources and consequences of nutrient enrichment on Waquiot Bay, Massachusetts. Couplings of watersheds and coastal waters. 5th Int. Cong. Of Ecology, INTECOL.15(4): 443–457.
Vukadin, I. and Stojanoski, L. (1996). Mediterranean and Adriatic Sea: Exchange of water and nutrients on the Pelagruza Sill (middle Adriatic). Proc. 2nd International Conference on the Mediterranean Coastal Environment, MEDCOAST 95, Tarragona, Spain.
Wetsteyn, L.P.M.J. and Kromkamp, J.C. (1994). Turbidity, nutrients and phytoplankton primary production in the Oosterschelde (The Netherlands) before, during and after a large-scale coastal engineering project (1980–1990). The Oosterschelde Estuary, The Netherlands: A case study of a changing ecosystem. Vol. 282– 283: 61–78.
Zenk, W. and Armi, L. (1990). The complex spreading pattern of Mediterranean Water off the Portuguese continental slope. Deep-Sea Res., 37(12): 1805–1823.