Engenharia
Ocular Recognition in Uncontrolled Environments:
Proof-of-Concept
Emanuel da Silva Grancho
Dissertação para obtenção do Grau de Mestre em
Engenharia Informática
(2º ciclo de estudos)
Orientador: Prof. Doutor Hugo Proença
Acknowledgements
Firstly, I would like to thank my supervisor Dr. Hugo Proença, whose expertise, understanding and patience led me to successfully reach another stage of my academic career
I am also thankful to my colleagues at SOCIA Lab, who had the patience to transmit their knowl-edge. His good spirit and friendship were a fundamental pillar for the realization of this work.
To my parents Antonio and Conceição and sister Alexandra I would like to express my gratitude for encouragement and support.To my girlfriend Claudia, I am thankful for all the strength and support, and for always believing in me.
Finally, a special thanks to all the volunteers who in one way or another demonstrated curiosity to participate and learn more about this project.
Resumo
A biometria é uma área em grande expansão e é considerada uma possível solução para casos onde são exigidos parâmetros altos de autenticação. Embora esta área esteja bastante desen-volvia em termos teóricos, a passagem da mesma para a prática ainda apresenta alguns proble-mas. Os sistemas existentes no mercado ainda se encontram dependentes de um alto nível de cooperação, para que se possa alcançar níveis de performance aceitáveis. É com este objectivo que o seguinte trabalho é desenvolvido. Através do estudo do estado da arte, é proposto e provado um um novo sistema biométrico menos cooperativo que se enquadre nos parâmetros normalmente exigidos.
Resumo alargado
A constante necessidade de parâmetros mais elevados de segurança, nomeadamente ao nível de autenticação, leva ao estudo biometria como possível solução. Actualmente os mecanismos existentes nesta área tem por base o conhecimento de algo que se sabe ”password” ou algo que se possui ”codigo Pin”. Contudo este tipo de informação é facilmente corrompida ou con-tornada. Desta forma a biometria é vista como uma solução mais robusta, pois garante que a autenticação seja feita com base em medidas físicas ou compartimentais que definem algo que a pessoa é ou faz (”who you are” ou ”what you do”).
Sendo a biometria uma solução bastante promissora na autenticação de indivíduos, é cada vez mais comum o aparecimento de novos sistemas biométricos. Estes sistemas recorrem a medidas físicas ou comportamentais, de forma a possibilitar uma autenticação (reconhecimento) com um grau de certeza bastante considerável. O reconhecimento com base no movimento do corpo humano (gait), feições da face ou padrões estruturais da íris, são alguns exemplos de fontes de informação em que os sistemas actuais se podem basear. Contudo, e apesar de provarem um bom desempenho no papel de agentes de reconhecimento autónomo, ainda estão muito dependentes a nível de cooperação exigida. Tendo isto em conta, e tudo o que já existe no ramo do reconhecimento biometrico, esta área está a dar passos no sentido de tornar os seus métodos o menos cooperativos poss��veis. Possibilitando deste modo alargar os seus objectivos para além da mera autenticação em ambientes controlados, para casos de vigilância e controlo em ambientes não cooperativos (e.g. motins, assaltos, aeroportos).
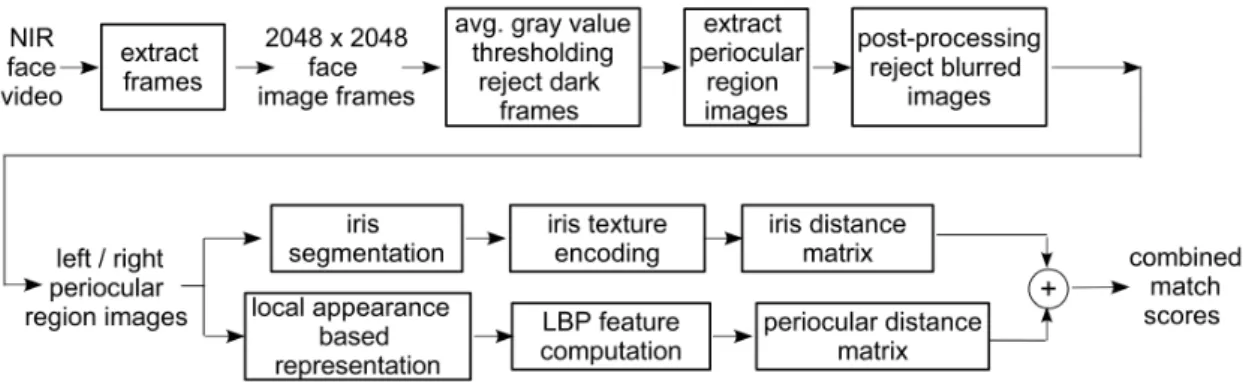
É nesta perspectiva que o seguinte projecto surge. Através do estudo do estado da arte, pre-tende provar que é possível criar um sistema capaz de agir perante ambientes menos cooper-ativos, sendo capaz de detectar e reconhecer uma pessoa que se apresente ao seu alcance.O sistema proposto PAIRS (Periocular and Iris Recognition Systema) tal como nome indica, efectua o reconhecimento através de informação extraída da íris e da região periocular (região cir-cundante aos olhos). O sistema é construído com base em quatro etapas: captura de dados, pré-processamento, extração de características e reconhecimento. Na etapa de captura de dados, foi montado um dispositivo de aquisição de imagens com alta resolução com a capaci-dade de capturar no espectro NIR (Near-Infra-Red). A captura de imagens neste espectro tem como principal linha de conta, o favorecimento do reconhecimento através da íris, visto que a captura de imagens sobre o espectro visível seria mais sensível a variações da luz ambiente. Posteriormente a etapa de pré-processamento implementada, incorpora todos os módulos do sistema responsáveis pela detecção do utilizador, avaliação de qualidade de imagem e segmen-tação da íris. O modulo de detecção é responsável pelo desencadear de todo o processo, uma vez que esta é responsável pela verificação da exist�ncia de um pessoa em cena. Verificada a sua exist�ncia, são localizadas as regiões de interesse correspondentes � íris e ao periocu-lar, sendo também verificada a qualidade com que estas foram adquiridas. Concluídas estas etapas, a íris do olho esquerdo é segmentada e normalizada. Posteriormente e com base em vários descritores, é extraída a informação biométrica das regiões de interesse encontradas, e é criado um vector de características biométricas. Por fim, é efectuada a comparação dos dados biometricos recolhidos, com os já armazenados na base de dados, possibilitando a criação de uma lista com os níveis de semelhança em termos biometricos, obtendo assim um resposta final do sistema. Concluída a implementação do sistema, foi adquirido um conjunto de imagens
capturadas através do sistema implementado, com a participação de um grupo de voluntários. Este conjunto de imagens permitiu efectuar alguns testes de desempenho, verificar e afinar alguns parâmetros, e proceder a optimização das componentes de extração de características e reconhecimento do sistema. Analisados os resultados foi possível provar que o sistema proposto tem a capacidade de exercer as suas funções perante condições menos cooperativas.
Abstract
Biometry is an area in great expansion and is considered as possible solution to cases where high authentication parameters are required. Although this area is quite advanced in theoretical terms, using it in practical terms still carries some problems. The systems available still depend on a high cooperation level to achieve acceptable performance levels, which was the backdrop to the development of the following project. By studying the state of the art, we propose the creation of a new and less cooperative biometric system that reaches acceptable performance levels.
Keywords
Contents
1 Intoduction 1
1.1 Motivation and Objectives . . . 1
1.2 Disertation Outline . . . 2
2 State of The Art 3 2.1 Biometrics . . . 3
2.1.1 Standard Procedure . . . 5
2.1.2 Operating modes . . . 6
2.1.3 Single Biometrics . . . 7
2.1.4 Multimodal Biometric Systems . . . 10
2.1.5 Performance Measures . . . 11
2.2 Iris Recognition . . . 14
2.2.1 Typical Iris Recognition Stages . . . 14
2.2.2 Iris Image acquisition . . . 16
2.2.3 Segmentation . . . 16
2.2.4 Normalization . . . 20
2.2.5 Encoding and Matching . . . 21
2.3 Periocular Recognition . . . 23
2.3.1 Standart Periocular Biometrics Stages . . . 24
2.3.2 Park et al. . . 25
2.3.3 Miller et al. . . 25
2.3.4 Other importante works . . . 25
2.4 Fusion of the Periocular and the Iris . . . 26
2.4.1 Woodard et al. . . 26
2.5 Non-cooperative recognition . . . 27
2.5.1 Region detection (Viola and Jones) . . . 27
2.5.2 Focus evaluation . . . 29
3 PAIRS - Periocular and Iris Recognition System 33 3.1 Proposed Method Schema . . . 33
3.2 Data capture . . . 36
3.2.1 Image acquisition . . . 36
3.2.2 System Setup . . . 36
3.3 Pre-Processing . . . 38
3.3.1 Detection of multiple regions of interest . . . 38
3.3.2 Quality checker . . . 39
3.3.3 Periocular region estimation . . . 41
3.3.4 Iris Segmentation . . . 42
3.3.5 Iris normalization . . . 47
3.4 Feature extraction . . . 48
3.4.1 Global feature extraction . . . 48
3.4.2 Local feature extraction . . . 50
3.4.3 Iris Encoding . . . 52
3.5.1 Matching . . . 52
3.5.2 Classification . . . 53
3.5.3 Enrollement . . . 54
4 Results and Discussion 55 4.1 Dataset . . . 55
4.2 Iris segmentation and encoding . . . 56
4.2.1 Iris segmentation . . . 56 4.2.2 Gabor optimization . . . 56 4.3 Performance evaluation . . . 57 4.4 Descriptores optimization . . . 57 4.5 Results . . . 61 4.5.1 ROC curves . . . 61
4.5.2 Cumulative Match Characteristic . . . 62
4.5.3 Biometric menagerie . . . 63
5 Conclusion 67 5.1 Future Work . . . 67
Bibliography 69 A Anexos 75 A.1 Fusing iris and periocular information for cross-sensor recognition . . . 75
List of Figures
2.1 Biometrics standard procedure. . . 5
2.2 Enrollment mode. . . 6
2.3 Verification mode. . . 6
2.4 Identification mode. . . 7
2.5 Crossover Error Rate. . . 13
2.6 Receiver operating characteristic (Roc) curve. . . 13
2.7 Cumulative Match Characteristic (CMC) curve. . . 14
2.8 Standard Iris Recognition stages. . . 15
2.9 Main steps of the method proposed by Proença and Alexandre. . . 18
2.10 Illustrative figure of the various steps of Zhaofeng He et al. method. . . 19
2.11 Steps that comprise the method proposed by Proença. . . 23
2.12 Steps on periocular recognition. . . 24
2.13 Woodard et al. steps to study a possible fusion between the iris and periocular. . 27
2.14 Non-cooperative system model. . . 27
2.15 Illustration of the intensity calculation of a pixel in a integral image. . . 28
2.16 Feature types used in the object detector. . . 29
2.17 Cascade representation. . . 30
2.18 Daugman convolution kernel (8x8). . . 30
2.19 Jun Kang and Kang Ryoung Park convolution kernel (5x5). . . 31
3.1 Periocular and Iris Recognition System. . . 33
3.2 Proposed method schema. . . 34
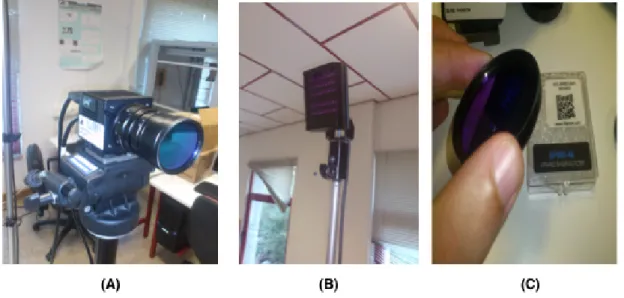
3.3 (A) Camera, (B) Illuminatior, (C) Camera filter. . . 36
3.4 System layout and its capture range (seen from top to bottom) . . . 37
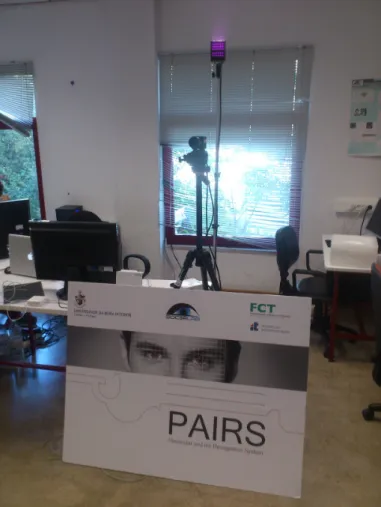
3.5 Data capture setup. . . 37
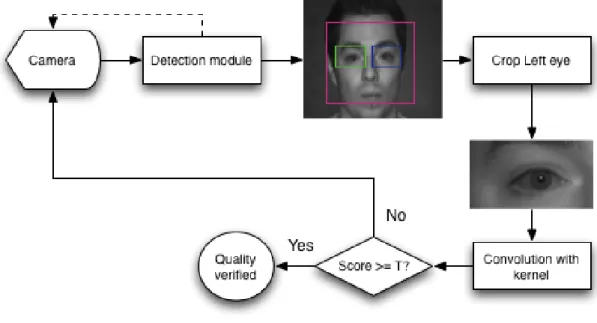
3.6 Detection module flowchart. . . 38
3.7 Quality checker module flowchart, were T is the minimum value established. . . 39
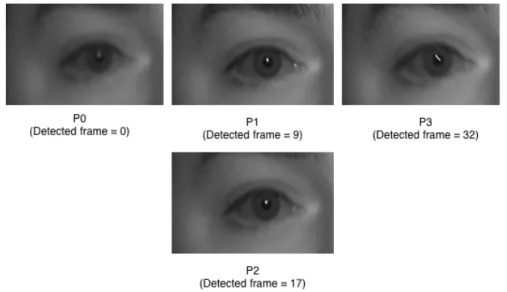
3.8 Quality analysis during the system’s normal operation. . . 40
3.9 Respective frames for P0, P1, P2 and P3 points. . . 41
3.10 Periocular region estimation module steps. . . 41
3.11 Periocular estimation based on the location of the face and eyes. . . 42
3.12 Iris segmentation steps. . . 43
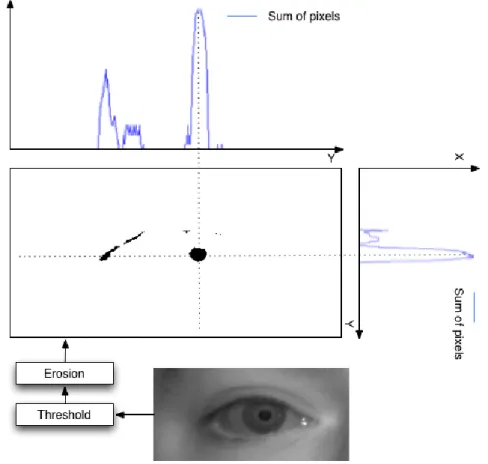
3.13 Pupil estimation steps. Localization of the darkest points in the input image and horizontal and vertical analysis. . . 44
3.14 Basic idea of the Pulling-and-Pushing method, representing strings and force di-rection. . . 45
3.15 Illustration of the Pulling-and-Pushing procedure, where each row represents a iteration. Images in the left column illustrate the estimate of the pupil center and radius. The central column gives the detected edge points in polar coordinates and the right column gives the center displacement by the sum of forces. . . 46
3.16 Resulting mask after completed the segmentation process. . . 47
3.17 Iris normalization after the segmentation process. . . 47
3.19 Feature vectors representation of HOG and LBP obtained through the regions
im-posed on periocualr region. . . 49
3.20 LBP code computation steps for each pixel inside a block. . . 49
3.21 Gradient orientation analysis steps. . . 50
3.22 Key points detected and local descriptor representation. . . 51
3.23 Features matching and scores array. . . 53
3.24 Score level fusion by classifying each matching score vector, where as final result a rank list is returned. . . 54
4.1 Examples of captured images to the dataset. . . 55
4.2 Gabor filters decidability. . . 57
4.3 Local binary pattern parameter variation and respective error. . . 58
4.4 Histogram of Oriented Gradients parameter variation and respective error. . . . 59
4.5 Scale invariant feature transform parameter variation and respective error. . . . 60
4.6 Receiver Operating Characteristic Curves observed for each descriptor and fusion of the same. . . 61
4.7 Receiver Operating Characteristic Curves observed for periocular descriptors and periocular with the iris fusion. . . 62
4.8 Cumulative Match Characteristic observed for the participants in the dataset. . . 63
4.9 Scores distribution in terms of participants. . . 64
4.10 Periocular data acquired from two sessions, where the participant was classified as worm. . . 65
4.11 Periocular data acquired from two sessions, where the participant was classified as sheep. . . 65
List of Tables
4.1 Gabor parameter combinations. . . 57 4.2 Local an binary pattern, standard and optimal parameter combinations. . . 59 4.3 Histogram of Oriented Gradients, standard and optimal parameter combinations. 59 4.4 Scale Invariant Feature Transform, standard and optimal parameter combinations. 60 4.5 Participant’s classification through biometric menagerie. . . 64
Acronyms
UBI Universidade da Beira Interior DNA Deoxyribonucleic acid
FAR False acceptance rate FRR False Rejection Rate FER Failure to enroll rate FTA Failure to acquire rate
NSRI Number of successful recognitions by impostors NARI Number of attempts at recognitions by impostors
NFARAU Number of failed attempts at recognition by authorizes use NRAU Number of attempts at recognition by authorized users
CER Cross Error Rate
CMC Cumulative Match Characteristic GST Generalized Structure Tensor Algorithm
HD Hamming distance
LOG Laplacian of Gaussian Filters HOG Histogram of oriented gradients
LBP Local Binary pattern
SIFT Scale-invariant feature transform SURF Speeded-up robust features ULBP Uniform Local Binary Patterns
DCT Discrete cosine transform DWT Discrete Wavelet Transform SSGA Steady-state Genetic Algorithm
NIR Near-infrared IR Infrared
Chapter 1
Intoduction
Man has been able to distinguish and recognize himself through the human body’s physical and/or behavioural properties since the dawn of civilization. Biometry has been used in several ways throughout history, such as in rock painting, the signing of important documents or in crime investigation based on fingerprint. Recognizing another person can also be shown less directly, for example, when recognizing someone through speech or gait.
As the population grows, the need to create more capable and autonomous biometric systems also arises. Automated biometric systems have only appeared in the past decades due to the considerable advances in the computational area. However, the basic idea has been developed before. The first systems began being used in order to control access, punctuality in the office or to solve criminal cases.
Daily life is currently associated with technologies that enable access to personal data or even to certain physical spaces, deposit boxes or server rooms in data centres, are some examples when it is important to safeguard access only to whoever possesses valid credentials. Although there are relevant forms of authentication, there is still the need to search for new solutions in the field in order to achieve a higher and less cooperative security level. Nowadays, not only is there a need to create authentication systems through identity verification systems, but also to create systems more directed at identification. Factors like the exponential growth of the world’s population or the concentration of great masses in populated areas leads to the search for less cooperative systems that enable for the identification of a great number of people in less daily life scenarios.
Biometrics is a steadily increasing research area due to its promising security and authentication properties in vast areas of civil and military matters. However, it is still in a transition phase between investigation and large-scale production of systems that can be adapted to daily life. Aware of these factors, this project aims to implement a biometric system capable of working in a less cooperative way for the user.
1.1
Motivation and Objectives
Considering biometrics as a significantly promising field in the nearby future, the study of its aspects is quite alluring. Although this field is deeply mature in terms of research, there are still some obstacles regarding its practical aspect, namely in the creation of more dynamic systems capable of working in the most adverse conditions.
Given how important it is to create systems, which are more and more directed at less coop-erative environments. This project proposes the study of the state of the art associated with this type of technology, aiming to project, implement and prove a new biometric system.
More-over, we propose a new system that belongs to the domain of identification systems capable of working in real time and based on biometric features of the area surrounding the eyes (perioc-ular region) and the iris. By creating this kind of multimodal system (with several traits), the intention is to achieve an acceptable performance level, in which the user’s data is acquired at a distance between 1.5 and 2.10 m.
1.2
Disertation Outline
The document then presents the following structure:
Chapter 2 This chapter aims to introduce the components of the state of the art that underlie
this project. It begins with a historical introduction of this field of work and then presents some concepts associated with it. We then present what can be done best in terms of recognition through feature extraction of the iris, the periocular region and both. Finally, some concepts related to the implementation of less cooperative systems are approached.
Chapter 3 The presentation of the theoretical concepts and the methods is thus concluded.
Chapter 3 presents and explains the system proposed. First, the structure of the imple-mented system is introduced from a higher-level point of view in order to understand which modules are implemented and how they interact with one another. Each module is elaborately explained throughout this chapter.
Chapter 4 This chapter basically presents and discusses the results obtained, giving equal
im-portance to the work developed in terms of data acquisition and optimization that allow the development and perfecting of the system proposed.
Chapter 5 The project is summarized and conclusions are drawn as to the work developed.
Some aspects that we consider worth investigating and implementing in the future are also presented in this chapter.
Chapter 2
State of The Art
This chapter addresses the biometric state of art, particularly those approaches that take into consideration the iris and periocular regions as sources of information. It begins by presenting a definition of biometrics and some historical concepts. It is essential, at this point, to introduce the basic concepts associated with biometric systems in general. Subsequently the chapter is directed to the biometric recognition through the iris, periocular and both. Each of these is presented according to authors who have already investigated this area. Finally, the concept of the non-cooperative biometric systems and the implications that it has is approached.
2.1
Biometrics
In order to obtain an optimal definition that would be useful to this dissertation’s context, this section provides a set of possible definitions for biometry from different sources.Complementary to this, a list of the major milestones throughout the history of biometrics is presented to assist in the understanding of the evolution of this concept side by side with civilization.
The word ”biometric” comes from the ancient Greek bios (life) and metron (measure). By deconstructing the origin of the word it is possible to understand that biometry is a science that uses metrics to apply to living beings, and in this context Biometrics refers to a set of techniques or metrics for uniquely recognizing a person based on one or more behavioural or physical traits.
”Biometric identification, or isometrics, refers to identifying an individual based on his or her distinguishing characteristics. More precisely, biometric is the sci-ence of identifying, or verifying the identity of, a person based on physiological or behavioural characteristics” [1]
”Biometrics is the science of establishing the identity of an individual based on the physical, chemical or behavioural attributes of the person.” [2]
”Biometrics is the automated recognition of individuals based on their behavioural and biological characteristics.” [3]
From a historical point of view, as will be seen below, biometric techniques are based on ideas that were originally conceived at the beginning of civilization. However, the emergence of automated systems dates back only a few decades due to the significant advances in the field
of computer processing.
• At the beginning of mankind over 30,000 years ago, prehistoric man painted the walls of his cave and signed his painting with hand prints [4].
• In Babylonian in 500 BC, fingerprints were used as a form of signature ”Babylonian business transactions are recorded in clay tablets that include fingerprints.”
• In the 14th century, a Spanish explorer and writer, João de Barros, reported that Chinese merchants utilized fingerprints for commercial transactions and Chinese parents differen-tiate their children by using fingerprints and footprints.
• In Egypt, commercial transactions were made taking into account the physical characteris-tics of the trader. Allowing them to recognize new elements in the profession or recognize merchants with a certain reputation.
• More recently, until the late 1800s, the photographic memory was a technique used in the Western world for the automatic recognition of individuals.
• In 1882, the French anthropologist Alphonse Bertillion created what many recognise as the first true biometric system, turning biometry into a distinguished field of study. His inven-tion, named Bertillonage, was based on a set of records of body measurements, physical descriptions and photographs. Although this system was difficult to use the Bertillonage was an important advance in criminal and people identification. The increased use of the system allowed us to observe that many people shared the same anthropological measure-ments, leading to entitling this system as inaccurate.
• In 1880 an article written by Henry Faulds and William James describing the uniqueness and permanence of fingerprints was published in the British scientific journal ”Nature”.
• Sir Francis Galton in 1888, motivated by the work of Henry Faulds and William James, began to observe fingerprints as a means of identification.
• Juan Vucetich, an Argentinian Police Official, began the first fingerprint files based on the Galton pattern types. At first, Vucetich included the Bertillon System with the files.
• In 1900, The United Kingdom Home Secretary Office conducted an inquiry into ”Identifi-cation of Criminals by Measurement and Fingerprints”, where Mr. Edward Richard Henry appeared before a committee to explains the fingerprint system he developed and later published in ”The Classification and Use of Fingerprints”. The committee recommended the adoption of fingerprinting as a replacement for the relatively inaccurate Bertillon system of anthropometric measurement, which only partially relied on fingerprints for identification.
• Between 1905 and 1908, all branches of the North American forces adopted the use of fingerprinting systems.
in everyday applications in the early 2000s
Since then, companies and governments have invested in the evolution of biometrics to solve many issues related to social, military and public safety. Unlike standard systems of the past based on only one characteristic (e.g. fingerprint), systems now a days have become more complete and varied. A more current system can be composed of one or more traits depending on the purpose for which it is intended. A key to the development aspects of these systems is the constant evolution of computational power, allowing the expansion of this science in almost every type of technological equipment. Adding an important factor for portability and ease of acquisition for anyone interested in this area.
2.1.1
Standard Procedure
Biometric systems in their most basic form can be structured in four sequential phases as illus-trated in fig. 2.1.
Figure 2.1: Biometrics standard procedure.
The first one is Data Capture, which is the interface between the real world and the system itself. The information captured can have several digital representations depending on the desired purpose. It can be in 1-D (e.g. sound from microphone), 2-D (e.g. image from camera), 3-D (e.g. point cloud from Kinect) depending on the sensors used on acquisition.
Pre-processing encompasses all kinds of methods that allow the processing of information that has been collected, which for reasons of the system design or external factors itself, needs to be treated. Normally this stage is the heaviest in the all biometric systems, including: enhance-ment for improving the quality of data, detection in order to detect Regions of interest, noise reduction to isolate only the useful information or normalization which makes the data invariant and more propitious for further processing.
After treating and selecting the information, the feature extraction stage comes next. This stage is responsible for the characterization of the information previously collected and treated. At this stage, it is assumed that information noise is as low as possible and therefore it is possible to make a characterization using a set of measures (features representation). In this stage, particular care is taken regarding invariance of the measures used for possible transformations (translation, scale, rotation changes, projective distortions, deformations in portions of the data), which adds a greater dynamism and strength to the system performance.
Lastly, the recognition stage which allows a final response to be given. This response consists of finding a degree of similarity between the features derived from the previous stage and
bio-metric templates stored into the database. Depending on the problem in question, several ways might be used to achieve this type of comparison, for example, using a simple distance between features (e.g. Hamming distance) or other more complex method that covers supervised learn-ing (e.g. Neural Network). Sometimes the combination of several methods is also possible, taking maximum advantage of each.
2.1.2
Operating modes
Although biometric systems share the same basic procedures, these have different functional-ities depending on the intended purpose. The systems can be characterized in three distinct modes: enrolment, verification and identification [5].
At the enrolment mode (fig. 2.2) the system can establish a digital representation between a person’s identity and the corresponding biometric sample. This relation (template) is stored apart from the system (e.g. Database) and used whenever a verification or identification is requested.
Figure 2.2: Enrollment mode.
In verification mode (fig. 2.3) the person’s identity is validated based on the comparison made between newly acquired biometric data and a previously collected biometric template. In this way of operating it is assumed that the subject has in his possession some kind of secret infor-mation (e.g. Pin, password).The utilization of biometric data is used to verify that the secret really belongs to the person who submitted it. This approach aims to prevent that secrets can be stolen and presented by another person than the true owner. This type of approach gives the name of positive recognition.
Figure 2.3: Verification mode.
On the other hand, a system that builds on a model of identification (fig. 2.4) intends to conclude what the identity of the person is without intentionally presenting itself to the system. The identification is usually done by negative recognition, although there are systems that work in positive recognition. The main difference between these two is the search of the person in question, taking into account a greater similarity grade in the positive recognition and a lower one in the negative recognition. The identification mode presupposes the comparison of collected biometric data in comparison with all the templates previously stored, in way so as to find a positive or negative relation of the person in the data base. This model is the foundation
to the creation of less cooperative biometric systems.
Figure 2.4: Identification mode.
2.1.3
Single Biometrics
A biometric system can be based on a wide range of physiological and behavioural traits. Each one has its advantages and disadvantages, and it can not be affirmed that a feature is better than any of the others. Although some of the traits are more valued by the scientific community, the choice depends largely on the purpose and conditions imposed on the system to be created.
2.1.3.1 Main traits
There is a fairly wide range of traits that can be applied to biometrics. Within this list of possibilities there are some that stand out more because of their use in large-scale systems or because they have major focuses at the scientific research level. The group of possibilities can be subdivided into two main groups; physical traits (e.g. DNA, Ear, Face, Facial Themogram, Finger Geometry, Fingerprint, Hand geometry, hand vein, Iris, Periocular, Palmprint, Retina) and behavioural traits (e.g. Gait, Keystroke, Signature, Voice).
• DNA - Deoxyribonucleic acid (DNA) is a molecule that contains information required for the development and functioning of all living beings. The pairs found in these chains are translated into a one-dimensional code that can be used for purposes of verification or identification. This characteristic is widely used in cases of mass accidents and solv-ing criminal cases since it only requires a small proportion to obtain all the information needed. Although it has a high performance and easy acquisition, it is very propitious to contamination, very expensive and does not allow real-time processing. Its performance may decrease in situations of close Relatives (e.g. Identical twins).
• Ear - Recognition through the structure of the ear is still a topic that leads to a lot of research, taking into account that a conclusion has not yet been reached about its unique-ness. However it remains promising, and is currently seen as a complementary feature to other systems with more developed features. For example, by using information from the ears into facial recognition systems, it takes advantage of the same device to capture information from both traits.
• Face - The same way that humans use the face to subconsciously do recognition, the face is also widely used in biometric systems. Despite the accuracy being low in comparison to
other characteristics (e.g. iris, fingerprint) the acquisition of this source of information does not need advanced equipment (e.g. recognition through webcam or video vigilance camera) and allows for recognition in real time. However with the appearance of less controlled environments, this gives rise to an increase in computational weight and a decrease in performance.
• Facial Thermogram - The facial thermogram is very similar to facial recognition with the exception of using thermal cameras to capture the faces patterns. The heat patterns are due to the branching of existing blood vessels on the face, which are highly distinctive even between very similar people (e.g. twins). This trait is especially advantageous because it works in total darkness and with the natural light. Although it requires a lower degree of cooperation and operates in real time, the system itself is very expensive and the efficacy is not guaranteed near heat surfaces.
• Finger Geometry - Finger Geometry includes a set of physical metrics as a whole form of biometric trait. Based on the length, height, thickness and curvature of the fingers, it is possible to get some performance in recognition processes. It is an easy technique and not invasive, however it requires some level of cooperation as it requires the placement of the fingers at a default position. There are some high costs due to the equipment required for the acquisition.
• Fingerprint - The fingerprint can be considered the most common way to identification taking into account its modern history in biometric systems. Its uniqueness lies in the arrangement of ridges and valleys on the surface of the finger. Although it is a fairly mature trait, easy to use and with little cost, it is highly dependent on the cooperation of the subject and it is very sensitive. It does not work with small lesions or dirt in the finger and there are also certain people who do not have the needed characteristics to use the system (e.g. surgeon as they often wash their hands with strong detergents, builders, people with special skin conditions).
• Gait - The way we displace in space is increasingly taken into account. From a sequential set of images and analysis of time-series features, stride length, cadence and speed or sil-houette it is possible to gather unique information in order to distinguish one subject from another. The low level of cooperation required makes this trait quite popular, although it is still sensitive to variations in respect of the surface where the person moves and the size of the person, which limits the variations of motion.
• Hand geometry - Consists of the use of metrics related to height and width of the back of the hand. The curves, thickness, length, weight of the fingers as well as the distance between the articulations and the bone structure can contain useful information. The fact of having lower values of discriminability makes this kind of system ideal for using on a restricted group of people and in cases where the need for precision is not one of the main criteria to the system selection (e.g. access to determinate areas in a factory by workers). This trait is highly dependent on cooperation, taking into account that the placement of the hand on the scanner surface is one of the sensitive points of this system.
by the veins and blood vessels of the hand. Traditionally, the de-oxygenated haemoglobin appears as the black patterns in the captured image, while the hand or fingers have lighter patterns. It is believed that this pattern is unique among twins and even between the right and left hands of the same person. However this needs to be corroborated with the proper acquisition of information.
• Iris - The patterns of the iris develop during the fetal period and extend to approximately the age of two. The information from the iris is unmatchable between real twins and invariant over time. Furthermore, it is believed that it is very difficult to be surgically modified or cloned without being identified as false. Despite the major point in its favour, it still requires some level of cooperation, although it has worked to counteract this ten-dency.
• Periocular - The use of the periocular region is a technique emerging in biometrics and it is considered a middle term between facial recognition and the iris independently. The gathering of information of the regions that surround the eyes ( eyelids, eyelashes, nearby skin area and eyebrows) is an alternative when it comes to systems where a demand of cooperation is at a lower level with an acceptable level of precision. In relation to the face, the information that comes from this region is not affected by ageing but when compared to the iris, the periocular has a lower level of precision.
• Keystroke - The way people write on keyboards may contain crucial information for the purpose of continuous authentication. The objective of this kind of system is to capture the existing time between pressing multiple keys in a way to obtain a unique behaviour pattern. Although this method allows for continuous authentication, it raises serious problems of privacy.
• Palmprint - In similar ways to the fingerprint, the palm print contains ridges, principal lines and wrinkles that can serve as a person’s characteristic. Taking into account that the palm of the hand is a much bigger region than the fingerprint, it is expected that there is a large information volume that can be used in relation to the fingerprint. On the other hand, bigger scanners are required which raises the costs associated with this system.
• Retina - The pattern of veins beneath the back of the eyeball is called Retina. It is unique to each person and believed to be one of the safest biometric traits. On the other hand, the fact that it is a small internal region requires the use of very expensive equipment, and a high level of cooperation.
• Signature - Perhaps one of the most used features over time, the signature comprises a series of behavioural characteristics during the writing process and makes it unique. Normally your assessment can be done in a static way, where only geometric features are used or dynamically where the speed, acceleration and trajectory of the signature are also analysed. Despite having an acceptable level of performance in authentication processes, the signature is susceptible to physical and emotional variants.
• Voice - The voice is a mixture of physical and behavioural characteristics. For stan-dard voice recognition two categories are created, text-dependent and text-independent.
Text-dependent recognition is based on reading from a pre-defined phrase. In text-independent category, there are no limitations as to what must be said, which makes the system more complex but provides more reliability. This type of system is not suitable on a large scale, since it is very sensitive to variations (e.g. room acoustics, misspoken Individuals emo-tional states or phrases), which considerably reduces its performance.
2.1.3.2 Traits performance
In summary, the existing traits and the corresponding systems can be classified according to some meaningful criteria. Jain et al. [6] propose to evaluate each trait having regard to its Universality, Distinctiveness, Permanence, Collectability, Performance, Acceptability, Circum-vention.
Universality - Measures the amount of people where the trait is manifested. Distinctiveness - Seeks to quantify how different a trait is between two people. Permanence - Evaluates whether a certain feature remains unchanged over time.
Collectability - Establishes how easy it is to acquire relevant information for a particular trait. Performance - Quantifies the precision and speed that a system can achieve.
Acceptability Establishes the level of social impact in the use of a system.
Circumvention - Measures the degree of reliability of a system against possible attacks.
2.1.4
Multimodal Biometric Systems
Given that each trait has strengths and weaknesses, the choice of the multimodal biometric system attempts to combine the properties of two or more traits in an attempt to attain even better performance. This approach can bring benefits to the level of security, information quality, universality, and better performance in terms of matching.
The level of security and the complexity of the system increases as the number of traits is used. If a feature is difficult to counterfeit, with two or more traits, the difficulty is increased.
Increased quality of information encompasses the scenario in which information from a source is compromised or for any reason is not enough. When using more than one source of information, this scenario can be compensated using the information from another source that was captured correctly. For example when a voice recognition system cannot process this information due to excessive noise, a fingerprint sample can be used. This compensation will reduce the chances of system malfunction.
Universality comprises if a person is not in a physical or emotional condition so that the system can capture a particular trait.
In multimodal systems, merging the characteristics of different origins can be done in two main forms, before and after the matching module of the system. When fusion takes place before the matching it can be at the sensor or feature levels. After this it can be at the score, rank or decision levels [7].
Pre-Matching Fusion
Sensor level It is applicable when there is a combination of information from various
sen-sors.
Feature level fusion at this level can occur in two ways, when the merger is made with
features of the same modality (e.g. instantaneous and transitional information for speaker recognition) and when it is performed based on features of different modal-ities. Bearing in mind that at this level the collected information is still raw, it is common to assume that this approach would be more efficient in comparison with other types of post-matching fusion. This, despite the fact that the literature is based on the post-matching methods. Fusion at this level is a difficult task, since some types of features may be incompatible and the fusion of several features re-sults in the appearance of multi-dimensional vectors that involve more processing, more storage capacity and greater complexity in the matching process. To solve this problem, methods of transformation and selection for features can be applied.
Post-Matching Fusion
Score level By using different matchers that quantity the similarity or difference between
the data acquired and stored in the database, it is possible to combine the different outputs. After performing the normalization, it is possible to apply some mathemat-ical operations: Sum, Product, Min, Max and Median rules .
Rank level Is most widely used in identification systems and is based on the output
match-ing characteristic of this type of system (rank list). By combinmatch-ing the different outputs from each list, is possible to reorder a final list.[8].
Decision level Given that in the verification systems each classifier gives a positive or
negative answer. Or at the case of identification systems, where the output is an or-dered list in which the person who most resembles is at the top. A final answer based on the response that has the most votes among all the classifiers can be obtained. This approach has the advantage of not requiring normalization as required by the score level fusion [8].
2.1.5
Performance Measures
The evaluation of a biometric system is very important to define the strengths and weaknesses of the system. By quantifying the performance against certain scenarios, it is possible to compare systems that are based on the same characteristics but which have been designed differently. The comparison is possible only if the same biometric data and the same metrics of performance
is used.
The evaluation of the system performance does not translate in the calculation of one metric in particular, but of a set of values that define the performance of parts of the system. The most common evaluation metrics for each phase are; data capture (Failure to Acquire Rate (FAR)), enrollment (Failure to Enroll Rate (FER)) and matching (False acceptance rate (FAR) and False Rejection Rate (FRR)). Only with a general analysis of all metrics, is it possible to obtain a coherent evaluation of a biometric system. Be noted that in biometrics; Genuine match scores denote the match scores computed between samples from the same identity and the Impostor match scores denote the match scores computed between two different identities.
The False Acceptance Rate (FAR) is the probability that the system incorrectly performs a corre-spondence between an input pattern and a non-corresponding database template (e.g. confuse two identities). This metric is calculated based on the total number of times that an impostor has been recognized (NSRI),and the total number of attempts, by the impostor, to be recognized (NARI).
F AR = N SRI N ARI (2.1)
On the other hand, the False Rejection Rate (FRR) is the probability that the system does not recognise the identity of a user who owns a template in the database. This metric is calculated based on the number of failed attempts at recognition by a user known to the system (NFARAU) and the total number of attempts to recognize a known user (NRAU).
F RR = N F ARAU
N RAU (2.2)
The Crossover Error Rate (CER) is the rate where both accept and reject error rates are equal. Based on the values of FAR and FRR, it is possible to establish a threshold that allows to deter-minate the proximity that should exist between a template of the database and an input of the system. We call to this threshold the sensitivity (fig. 2.5). With the reduction of this value the system will be subjected to the occurrence of more false accept errors (higher FAR) and less false reject errors (lower FRR), consequently to increase the limit that will lead to lower FAR and higher FRR.
Figure 2.5: Crossover Error Rate.
Once more and, based on the values of FAR and FRR it is possible to characterize the varia-tion of the relavaria-tionship that exists between the two metrics. The area under curve from this type of representation illustrated at fig. 2.6 can be seen as a way of summarizing the system performance.
Figure 2.6: Receiver operating characteristic (Roc) curve.
The Failure to acquire (FTA) represents the probability of a system to fail in the detection and acquisition of a biometric input without the manifestation of external factors that can prevent the acquisition of the information in the right way. This metric is obtained by the number of attempts of acquiring data (NAC) and in the number of failed attempts in the data acquisition (NFCA).
F T A = N F CA N AC (2.3)
The Failure to enrol rate (FER) is the percentage of cases where the system failed the storage of biometric data. This metric is obtained from the total number of attempts at keeping the contact information of a user (NEA) and the number of failed attempts to carry out enrolment (NFEA).
F ER =N F EA N EA (2.4)
In order to assess the degree of efficiency that a system has in terms of classification of inter and intra-class comparisons,we can calculate the degree of dissimilarity eq. (2.5). Between the scores obtained by the matching of features from the same person with different people, it is possible to obtain two distributions that respectively characterize the intra-class and inter-class comparisons. The distance calculation between the two distributions obtained, decidability, can serve as a performance measure.
d′= |µ√inter− µintra|
σ2
inter+σ2intra 2
, (2.5)
where µinterand µintrais the average of values of the scores obtained between inter-and
intra-class comparisons and σinter e σintra are the respective standard deviations.
More directed to the evaluation of identification systems, where the output of the system is represented by a rank ordered comparisons, it is possible to analyse the performance through Cumulative Match Characteristic (CMC) curves representing the probability of being the correct matching between the observed Top-K first elements of the result list.
Figure 2.7: Cumulative Match Characteristic (CMC) curve.
2.2
Iris Recognition
In this section some of the most relevant methods from the literature with regard to biometric recognition through the iris is presented. A brief explanation of each step that make up this process will be done as well as the explanation of the methods that stand out in each one.
2.2.1
Typical Iris Recognition Stages
As a general rule and as in any other biometric trait used, iris recognition is also based on four steps previously explained in subsection 2.1.1 (Data capture, Pre-processing, Feature extraction and Recognition). But each step of the process comprises sub-methods focused only on iris
recognition in particular. Most of the published iris recognition methods can be illustrated according to fig. 2.8.
Figure 2.8: Standard Iris Recognition stages.
Data Capture
Image Acquisition Due to the characteristics of the iris, the acquisition is a task very
sensitive to external factors (e.g. light variations, cooperation). Thus, the selection of sensors for proper acquisition is still a topic widely studied. Beside the difficulties intrinsic to the iris, biometrics has evolved to become less cooperative, witch makes even more complex to define an optimal solution for this first stage of the system.
Pre-Processing
Segmentation This step aims to estimate the internal (pupillary) and outer (scleric)
bound-aries of the iris essential to generate a biometric iris sample containing only solid information, that is subsequently used in the matching phase. In biometric systems this step is usually associated with a large computational load, which leads to a high demand for new ways to counteract this trend.
Normalization The normalization of the segmented region ensures a level of invariance
against certain factors (e.g. iris size, position and rotation). The security of this type of invariance is essential for encoding and matching steps that follow.
Feature Extraction
Encoding The encoding step includes all kinds of methods to extract the most relevant
features of the iris, creating a new representation of the same. These representations are used in the matching phase.
Matching The last step consists of comparing two iris signatures in order to conclude
whether they are form the same person. The way the comparison is done may vary from a simple calculation of the distance between signatures or in more complex cases, the use of machine learning algorithms. In any case, the output is a measure of a similarity representing the degree of likeness between two biometric individuals.
2.2.2
Iris Image acquisition
The way information is acquired from the iris in uncooperative environments is still one of the most controversial issues in the iris recognition domain. The state of the art is divided between the use of sensors with the capability of acquiring iris images in the visible spectrum or in the near-infra-red (NIR) spectrum. This also includes cases where the use of both may be used, in particular for carrying out some specific steps (e.g. detection on visible spectrum and iris acquisition on NIR).
Matey and Kennell [9] studied the problems usually encountered when images are acquired from over one meter. Difficulties related to wavelength of light used, the type of light source, the amount of light reflected by the iris back to the sensor, the required characteristics of the lens, signal-to-noise ratio, eye safety, and image quality, capture volume, residence time, and sensitivity to subject motion were discussed. These authors applied the study of these points into marketable iris recognition systems dating between 1955 and 2008.
Boddeti and Kumar [10] studied the influence of wavefront coding in different stages of iris recognition (e.g. segmentation, feature extraction). Although this aspect had already been previously analysed in the literature, the author used a large database in their tests.
Wheeler et al. [11], Dong et al. [12] He et al. [13] propose to use iris images captured with NIR light. Wheeler et al. presents a system composed of two wide-field-of-view cameras to detect the face of the subject. A third camera and NIR illuminator is used to acquire iris images taking into account the location of the subject previously established. Dong et al. proposes a system for acquiring images of the iris in NIR able to operate at a distance of 3 m. He et al. in order to reduce the cost associated with the collection of high quality material for the iris images , designed a camera that consists of a CCD sensor, a custom glass with a fixed focus, one-pass filters NIR and an illuminator comprised of several NIR LEDS.
Although most systems presently on the market resort to NIR for acquiring images of the iris. Proença [14], argued that the use of sensors operating in the visible spectrum are more appro-priate against factors such as distance and movement.
2.2.3
Segmentation
For segmenting the iris, two kinds of approaches can be considered. The first set is the more classical seen in restricted acquisition environment, while the second set is directed more to less cooperative environments.
Within the set of more classical methods, we have Daugman[15] which proposes the use of a integrodifrencial operator and Wildes [16], Mat et al [17], Tisse et all [18], Monro et al [19] who use the Hough transform. In the second family, we have the use of fuzzy algorithm (Proença and Alexander [20]), elastic model based on the Hooke’s law ( Zhaofeng He et al. [21]), concepts
of Grow-cut algorithm (Tan and Kumar [22]), Generalized Structure Tensor algorithm (Alonso-Fernandez and Bigun [23]) and spatial arrangement of boundary points (Xinyu et al. [24]).
2.2.3.1 Daugman’s Integro-differential
In 1993, John Daugman [25] presented one of the most important methods in regards to iris recognition and what would be the first method implemented in functional biometric recognition systems. The author assumes that both the iris and the pupil have circular shapes. In this way the author uses an integrodifferential operator to search within the image domain, the boundaries of iris. max r,x0,y0 Gσ(r)∗ ∂ ∂r I r,x0,y0 I(x, y) 2πr ds , (2.6)
where I(x, y) is the input image, Gσ(r)is a smoothing function such as a Gaussian of scale σ
and∗ denotes convolution. The variables x0, y0and r, represent the center coordinates and the
radius.
This method iteratively searches a space N3by circles with radius (r) and centre (x
0, y0), where
the response from the operator in eq. (2.6) is larger than a predetermined threshold value. This way, the author manages to approach the iris segmentation to find two circles representing the iris and pupil boundaries. A similar approach is used to find the eyelid boundaries with a small change, which consists of changing the contour integration form circular to arcuate. Later on, the author proposes some improvements to the method allowing for flexible shapes [26].
2.2.3.2 Hough’s Transform
The Hough transform is an algorithm what is used to determine parameters of simple geometric objects, such as lines or circles in images. The circular Hough transform is often used to de-duce the radius and the coordinates of the boundaries of the iris and pupil, assuming that the boundaries of iris resemble circles. Wildes [16], Ma et al. [17], Tisse et al. [18] and Monro et al. [19] apply the circular Hough transform.
Wildes [16], proposes the creation of a binary map from the detection of the boundary points in the captured image. This first step is achieved after establishing a threshold value in the magnitude of the gradient intensity calculated from the eq. (2.7) where▽ ≡ (∂/∂x, ∂/∂y)and
G(x, y) is the 2D Gaussian filter centred in (x, y), defined by eq. (2.8). Once completed this step the Hough transform is applied.
G(x, y) = 1
2πσ2e
−(x−x0)2+(y−y0)2
2σ2 (2.8)
Ma et al. [17] proposes an approach comprised of three phases. In a first phase an approximation of the pupil center is done based on minimum value found in two dimensional projections of the image (horizontal and vertical). Then it provides a region of 120x120 centred on (xp, yp), what
is then passed to a binary representation based on a threshold value found by the histogram of the gray scale region. Finally, using the Canny edge detector and the Hough transform, the location of the circular border is found, together with the information from the pupil centre.
Monro et al. [19] suggests the use of a heuristic method to effect a reduction of the region of interest. Only then do the authors propose to use the Hough transform after using a Canny edge detector to reduce noise levels in the image.
2.2.3.3 Proença and Alexandre Method
Proença and Alexandre [20] surveyed the literature and found that the existing iris segmentation methods were based on essentially two ways of approaching the issue. The first using edge detection methods for the construction of maps of areas and the second by the analysis of the intensities varying radius of consecutive circles. Assuring that both kind of approaches are very susceptible to variations in the properties of the image acquired (e.g. brightness and contrast) and the existence of noise factors (e.g. reflections, eyelids or eyelashes and iris occlusions), these authors propose a new method illustrated in fig. 2.9, while ensuring the operability in less cooperative environments.
Figure 2.9: Main steps of the method proposed by Proença and Alexandre.
From a feature extraction phase in the region of interest and the application of a fuzzy clustering algorithm [27], a normalized image is obtained. Based on this new representation of the original image, the authors apply one edge detector and the Hough transform in order to estimate the targeted region of the iris.
2.2.3.4 Zhaofeng He et al. Method
Zhaofeng He et al. [21] found that the segmentation methods of the iris usually involve an exhaustive search in a large space of parameters. The authors present a new method with special attention to its computational speed, without bleaching the robustness required at this stage of iris recognition. The method can be presented with a set of sequential steps, as illustrated in fig. 2.10 and explained below.
Figure 2.10: Illustrative figure of the various steps of Zhaofeng He et al. method.
1. This method starts by using the Haar-cascade detector proposed by Viola and Jones [28] for the detection of the iris. This method is widely used due to its speed of execution and the fact that the irises of different people share the same structure. However, the direct use of the images on the detector (learning and detection) is subject to failures resulting from specular reflection in the iris, witch is a problem often encountered when working with NIR illuminators. Thus, the authors propose to use a Specular Reflection Removal method prior to detection of the iris. From this step, it is possible to establish an approximate position of the pupil centre.
2. Detecting the boundaries of the iris using a new approach called pulling and pushing. Based on Hooke’s law, the center and the radius of the circle of the iris are adjusted iteratively until reaching a point of equilibrium, preferably up to fit the true boundary of the iris. Being aware of the existence of a non-circular iris, the authors use a smoothing spline on the boundary points previously found. In this way, a real segmentation of iris is obtained and not just a circle that approximates the boundaries of iris.
3. After the inner and outer boundaries of the iris are set, the location of the eyelids is done. This step begins by eliminating the noise associated with the eyelashes through a rank filter. Later, the eyelid edge points are found through an edge detector. Based on the edge points found, a histogram is constructed in relation to its location in the image. Finally, an approximation of the true position of the eyelids is done based on the intersection between the edge points with three eyelid models established manually.
4. The last step consists in the detection of eyelashes and shadows via a learned predic-tion model. This model consists of an adaptive threshold by analysing the distribupredic-tion of intensities in different regions of the iris.
2.2.3.5 Tan and Kumar (2012)
Tan and Kumar [22] propose a segmentation method of the iris with special attention to images acquired from large distances. Their method is based on the concept of Grow-cut, where the aim is to distinguish between the foreground (iris) and background (non- iris) in the input image. The results obtained in this first phase are later refined through set operations that allow to estimate the iris centre, inner and outer boundary, eyelashes, shadows and eyelids.
2.2.3.6 Alonso-Fernandez and Bigun (2012)
Alonso-Fernandez and Bigun [23] present a new algorithm to segment the iris based on a Gener-alized Structure Tensor algorithm (GST). In mathematics, a tensor structure (second- moment matrix) is a matrix that summarizes the predominant directions of gradient in the neighbourhood of a given point. After making the convolution of the region of interest with circular filters, the authors resort to the Generalized Structure Tensor, managing to obtain information about the magnitude and direction of each pixel edge found. This approach gives a level of additional information that significantly improves the detection of boundary points.
2.2.3.7 Xinyu et al. (2012)
Xinyu et al. [24] work with data acquired under less cooperative conditions, and propose the use of an algorithm able to work with images of different resolutions. The author first suggests finding the boundary points in the image by using the Canny edge detector. The non-connected components resulting from this previous step are considered nodes of a graph. Finally, based on the layout of the nodes in the graph, a structure that resembles the iris border more accurately is searched.
2.2.4
Normalization
Given the need of making the iris information invariant to scale and pupillary dilatation, the normalization of the segmented region is done.
Regarding the methods of literature addressing this question, the Daugman’s rubber-sheet model [25] is the one with greater emphasis. The rubber sheet model assigns to each pixel of the image a couple of real coordinates in a polar domain (r, θ) in which r represents the radius and can have values between [0, 1] and θ is the angle between [0, 2π]. The transition of the iris representation in Cartesian coordinates to polar coordinates translates into represented in eq. (2.9).
I(x(r, θ), y(r, θ))→ I(r, θ), (2.9)
where x(r, θ) and y(r, θ) are defined as linear combinations, (xi(θ), yi(θ)) the set of pupillary
of the iris.
x(r, θ) = (1− r)xi(θ) + rxj(θ) (2.10)
y(r, θ) = (1− r)yi(θ) + ryj(θ), (2.11)
where each point of the new representation is obtained using the following set of equations:
xi(θ) = xi0(θ) + ricos(θ) (2.12)
yi(θ) = yi0(θ) + risin(θ) (2.13)
xj(θ) = xj0(θ) + rjcos(θ) (2.14)
yj(θ) = yj0(θ) + rjcos(θ). (2.15)
2.2.5
Encoding and Matching
As mentioned above (section 2.2.1), the encoding step is essential because it allows the coding of the most important features (pattern information) of the iris, so that these can be efficiently stored and used as templates for comparison in biometric systems. Regarding this step, the most classic literature addresses the question through an analysis of the iris patterns themselves. They are statistical approaches and are divided into three categories: phase-based methods (eg, Daugman [15]), zero-crossing methods (eg, Boles and Boashash [29] and Roche et al. [30]) and texture analysis based methods (eg, Wildes [16] Kim et al. [31] and Ma et al. [32]). Another approach (syntatic) focuses the existing structural information on iris pattern (Proença [33]).
2.2.5.1 Daugman’s Iris-code
Daugman [15] proposes the coding standards of the iris through the convulsion of the segmented and normalized region with a 2D Gabor filter, defined by eq. (2.16).
h{Re, Im} = sgn{Re,Im}
∫
ρ
∫
ϕ
I(ρ, ϕ)e−iω(θ0−ϕ).e−(r0−ρ)2/α2e−(θ0−ϕ)2/β2ρdρdϕ, (2.16)
where h{Re, Im} is a complex value in which the real and imaginary parts have value of 0 and 1 depending on the sign of the integral; I(ρ, ϕ) is the input image, normalized to the polar space as referred in section 2.2.4; α and β are the multi-scale 2D wavelet size parameters; ω is wavelet frequency; and (r0, θ0)represent the polar coordinates of each region of the iris for which the
phasor coordinates h{Re, Im} are computed .
The author proposes a new representation of the iris based on the quantification of the respec-tive information from the response phase convulsion. The information from the amplitude is
discarded given that it is sensitive in terms of contrast, lighting and camera gain. In this way, each pixel of the normalized region takes on a binary representation.
In terms of matching, the author proposes the use of the Hamming distance (HD) eq. (2.17) to quantify the degree of similarity between two signatures.
HD = ∥(codeA ⊗ codeB)
∩
maskA∩maskB∥
∥maskA∩maskB∥ , (2.17)
where the two binary iris signatures are represented by codeA, codeB and maskA, maskB are their masks. The application of the exclusive OR operator (XOR) between both signatures re-flects the total of discordant bits, while the AND operator ensures that the information is not affected by noise derived from eyelashes, eyelids, specular reflections, or other noise.
2.2.5.2 Wilde’s Pyramid
Whildes [16] suggests that after the segmentation of the iris corresponding region, the step of matching based on four steps: alignment, representation, comparison and decision is performed immediately.
1. Alignment. As a first step, the author proposes a new technique for registration, in order to compensate for possible variations associated with the rotation and scaling of images. The new images are mapped and subject to alignment with images already stored, to minimize their differences.
2. Representation. It is suggested a decomposition of the image through the application of Laplacian of Gaussian filters (LoG). The filtered image shall be represented by different scales on the Laplacian pyramid shape. This new representation allows the compression of information from the iris highlighting only the most significant characteristics.
3. Comparison. This step is based on a normalized correlation, where the aim is to quantify the degree of similarity between the different components of two irises. In this sense, the author applies this correlation model in the regions of 8x8 for each of the representations in the Laplacian pyramid. The output of this stage is based on a single value obtained through a statistical median.
4. Decision. The last step of the proposed method, intends to give a final response (accept / reject) through the Fisher linear discriminant.
2.2.5.3 Ma et al. Texture Analysis
Ma et al.[32] state that the essential information for the recognition is in the very transient patterns of the iris. Thus, authors propose the construction of a vector consisting of a set of
1-D intensity signals. Each signal is a combination of N successive horizontal lines obtained by scanning the image in order to represent local variations occurring in a horizontal direction. Then, a search is performed in the space of frequencies at different scales in order to find the local minimum and maximum. The authors hypothesized that the extremes that have been found are useful information, since they correspond to variations of the iris features in the original image. Finally, characteristics corresponding to different scales are concatenated into a feature vector. Regarding matching, the authors propose a two-step approach. Firstly, they encode the feature vector into binary where each point lies the value of 1 or -1, depending on the type of extreme point. Secondly, they calculate the degree of similarity between two binary sequences by exclusive OR operator.
2.2.5.4 Proença’s Structural Pattern Analysis
Proenca [33] introduces a new method illustrated in fig. 2.11 that is based on the structural information of the iris. The author assumes that similar to what is visible on the iris pattern, the arrangement of the different regions of the iris itself is a useful property for this task. From the normalized iris image, the author proposes finding the most homogeneous regions. This step is done by searching for the minimum variation of intensities between each image pixel with its neighbour. After defining these regions, their centres are estimated to which the author gives the name of primitives. When all the points in the image are found, the author establishes a relationship between them based on the discrepancy of the value of each. This connection is represented by edges between each pair of points resulting in a representative graph of the data structure illustrated at ??.
Figure 2.11: Steps that comprise the method proposed by Proença.
Considering a graph as a structural representation of the iris, the matching between two signa-tures is done through the calculation of the distance between graphs, resulting in a metric of similarity between them.
2.3
Periocular Recognition
This section aims to explain the methods of literature that stand out in relation to biometric recognition using the periocular region. A brief overview of the steps that constitute the process is given, even though this a quite new kind of recognition technology (initiated by Park et al. at 2009 [34]), and therefore still quite focused on the same kind of approach.
2.3.1
Standart Periocular Biometrics Stages
As well as in the case of the iris, the periocular recognition follows the standard steps charac-teristic of a common biometric system (Data Capture, Pre-Processing, Feature Extraction and Recognition). However, some differences lie in how some steps are addressed, especially the pre-processing and feature extraction phases (fig. 2.12). Regarding the feature extraction. it can be approached in three ways; extract information from the entire region (global descriptor), extracting information from the most relevant parts of the region (local descriptor) or using both types of extraction together.
Figure 2.12: Steps on periocular recognition. Data Capture
Image Acquisition - As well as in other biometric traits, is important to define the setup
that best suits for the collection of biometric information, including whether to op-erate in the visible or NIR (woodard et al. [35]). However, the use of the periocular area can be considered a balance between using the face or the iris. Which means that in certain cases the capture is made in the NIR spectrum, in order to benefit iris acquisition.
Pre-Processing
Estimate the periocular area - After capturing directly the region surrounding the eyes,
it is necessary to establish the exact area that will be used for feature extraction. The definition of a boundary that demarcates the periocular region is still a topic of some interest, as well the elements that should be included in the ROI (e.g. the iris, sclera and eyebrows).
Feature Extraction
Local and Global descriptors - Having established the periocular region and the elements
that must be taken into account, the conditions for the extraction of biometric fea-tures which can be used for the next phase are gathered. The use of global descriptors (e.g. LBP - Local binary pattern [36] [37] and HOG - Histogram of oriented gradients [38]), local (SIFT - Scale-invariant feature transform [39]) or both, may vary