A method for the genetic discrimination between
species of goat (Capra hircus) and sheep (Ovis aries)
Mestrado em Genética Forense
Setembro 2012
Faculdade de Ciências da Universidade do Porto
A method for the genetic discrimination between
species of goat (Capra hircus) and sheep (Ovis aries)
Mestrado em Genética Forense
Setembro 2012
Faculdade de Ciências da Universidade do Porto
Dissertação de candidatura ao grau de Mestre
em Genética Forense submetida à Faculdade de
Ciências da Universidade do Porto.
Este trabalho foi desenvolvido sob a coordenação
científica do Professor Doutor António Amorim e
da Doutora Barbara van Asch.
Dissertation for applying to the Master’s Degree
in Forensic Genetics submitted to the Faculty of
Sciences of the University of Porto.
This work was developed under the scientific
supervision of Professor António Amorim, PhD
and Barbara van Asch, PhD.
Agradecimentos
Agradeço em primeiro lugar ao Professor Sobrinho Simões e a todos os que diariamente constroem a reputação do IPATIMUP pelo privilégio de ter feito parte deste Instituto.
Ao Professor Amorim e à Professora Maria João Prata, agradeço terem-me aceite, e recebido no mestrado, e pela oportunidade de aprendizagem e trabalho nestes últimos dois anos.
À minha orientadora, Barbara van Asch, deixo o agradecimento pela coragem de começar esta aventura. Agradeço também à Joana Gonçalves e Filipe Pereira sem os quais este trabalho não teria sido possível.
A todo o grupo de Genética Populacional, pelo excelente ambiente de trabalho e de amizade, em particular à Manuela e à Lígia por todas as pequenas grandes ajudas. A todos os meus colegas de mestrado: Alexandre, Ana, Catarina, Filipa, Marisa e Sofia. Ficou tudo muito mais fácil.
Estes últimos anos foram extremamente enriquecedores, do ponto de vista pessoal e profissional. São várias as pessoas que durante todo este tempo tiveram um contributo, e não fazendo jus ao reconhecimento que lhes tenho, não posso deixar de apresentar um agradecimento especial.
Às minhas orientadoras de licenciatura, Perpétua e Maria. Nunca vou esquecer o quanto me ensinaram e formaram, nem retribuir o valor e consideração que tiveram por mim. Foi um privilégio ter podido sonhar e ambicionar tanto, e ficarei para sempre grato por tudo o quanto me ensinaram. A todos os meus colegas e amigos da faculdade, desde o primeiro ano. Diana, Hugo, Jacinto, João, Joel, Mário, Paulo, Pedro, Samuel, Rogério, e, em particular ao Rodrigo e ao Vítor, por termos mantido o contacto e amizade durante todos estes anos. A ajuda foi maior do que alguma vez conseguiria aqui traduzir.
Ao Zé Rui, e todos os amigos de infância e de Canidelo. Ao EVPM com um abraço especial para o Zé Pinheiro, um amigo para todas as ocasiões. Deixo o meu obrigado.
À Escola de Música de Canidelo pela importância que sempre teve na minha vida e por todas as memórias. Ao Paulo e à Paulina, e ao Cesário e Mota por tudo o que me ensinaram. E a todos os meus alunos, que em especial durante este ano sempre serviram de inspiração.
Agradeço por fim a toda a minha família, por ser a minha constante motivação. Aos meus pais Adriano e Alexandra. Ao meu pai por todos os conselhos, à minha mãe por ser a pessoa mais forte que conheço. Criaram-me e deram-me uma vida, e devo-lhes tudo o que tenho hoje.
Aos meus irmãos Miguel, por me ter incutido o gosto pela ciência e pelos estudos, e Luís, pela amizade.
Agradeço por fim aos meus avós Alice e Domingos. Educaram-me, e são para mim o exemplo a seguir, por tudo o que lutaram e conseguiram. Viverei sempre com todos os valores e princípios que me ensinaram e deixaram, e ficarão para sempre na minha memória como o meu modelo de vida.
T
ABLE OF CONTENTS
A
BSTRACT
1
R
ESUMO
3
1. I
NTRODUCTION
5
1.1
O
VICAPRINES
7
1.1.1 DAWN OF DOMESTICATION AND DISPERSAL OF PASTORALISM
7
1.1.2 DOMESTICATES AND THEIR WILD RELATIVES
8
1.2
D
ISCRIMINATION OF OVICAPRINES SPECIES
10
1.3
M
OLECULAR
G
ENETICS
11
1.3.1 MITOCHONDRIAL DNA
11
1.4
S
INGLE NUCLEOTIDE POLYMORPHISMS
(SNP
S
)
13
1.5
M
INI
-
SEQUENCING REACTION
14
2. A
IMS
15
3. M
ATERIALS AND
M
ETHODS
19
3.1 Sampling and DNA extraction
21
3.2 Mitochondrial SNP selection
22
3.3 Primer design
23
3.3.1 PCR PRIMERS
24
3.3.3SEQUENCING PRIMERS
25
3.4 Single locus PCR and sequencing
25
3.4.1 SINGLE LOCUS PCR
25
3.4.2 SEQUENCING ANALYSIS
25
3.5 Single-Base Extension (SBE)
26
3.5.1 MULTIPLEX PCR AMPLIFICATION
26
3.5.2 SBE REACTION
26
4. R
ESULTS AND DISCUSSION
29
M
INISEQUENCING REACTION
29
4.1 Singleplex tests and sequencing
33
4.2 Multiplex Single Base Extension
36
4.3 Tests in samples composed by a mixture of species
37
4.4 Cross-species reactivity
39
4.5 Identification of sheep and goat in commercial samples
41
G
ENERAL DISCUSSION
43
5. C
ONCLUSIONS
47
1
A
BSTRACT
The osteometric distinction between Capra and Ovis is regarded as a classical problem in zooarchaeology. This difficulty is particularly relevant for important and frequent bone fragments such as mandibles, vertebrae or bones from young animals, often resulting in the classification of ‘Ovicaprines’. Given the importance and influence of these animals, namely during the Neolithic period, this ambiguous classification limits current knowledge and inferences regarding domestication and important events associated with Human history. In this context, a genetic discrimination system between species of sheep and goat could provide a valuable tool with archaeological application in the analysis of bones or other samples such as skin tissue, but also with potential application in other areas such as food products traceability in which the low quantity and low quality of extractable DNA constitute a strong limitation.
Considering that mitochondrial DNA (mtDNA) is regarded as the only molecular marker that can be efficiently retrieved from highly processed and/or damaged products, and by exploiting the fact that sequences of mtDNA from sheep and goat are currently published, the goal in this work was to develop a genetic screening method to discriminate between species of sheep and goat based on the analysis of these sequences.
The test developed in this work is based on PCR and minisequencing, using short DNA fragments to increase the probability of obtaining results from highly processed or damaged samples. This assay makes use of four SNPs identified as species diagnostic by comparison of complete mitochondrial genomes from sheep and goat.
The analysis performed in this work depicted this method as robust, sensitive and highly specific for the two species and allowed the accurate detection and identification of sheep or goat genetic material in different samples.
This test proved efficient, easy to perform, with potential application in forensic analysis for the rapid screening of a large number of products.
Taking into consideration the limitations presented by other methodologies, this mtDNA-based test probably achieves the highest resolution for the direct genetic identification of sheep and goat products.
3
R
ESUMO
A discriminação entre Capra e Ovis baseada em medições osteométricas constitui ainda hoje um problema clássico no contexto da zooarqueologia. Esta dificuldade é particularmente relevante para amostras ósseas frequentes tais como mandíbulas, vertebras ou ossos de animais jovens, o que resulta frequentemente na classificação dos respectivos vestígios arqueológicos como ‘Ovicaprinos’. Dada a importância e influência que estes animais desempenharam, nomeadamente durante o período Neolítico, esta classificação ambígua resulta numa perda significativa de informação relativamente a inferências sobre os episódios de domesticação e eventos importantes ligados indefectivelmente à história Humana.
Neste contexto, um método de discriminação genético para espécies de cabra e ovelha constituiria uma ferramenta oportuna com aplicação arqueológica na análise de amostras ósseas ou outro tipo de tecido tais como peles, mas também com potencial aplicação em outras áreas tais na análise de produtos alimentares em que a baixa quantidade e a má qualidade de DNA presente constituem fortes limitações.
Dado que o DNA mitocondrial (mtDNA) constitui o único material genético passível de ser eficientemente recuperado de produtos processados e sabendo que existem já sequências publicadas de mtDNA para o os géneros Capra e Ovis, o objectivo deste trabalho foi o desenvolvimento de um sistema genético capaz de discriminar entre espécies de cabra e ovelha baseado na análise destas sequências.
Este sistema de identificação genética é baseado em PCR e minisequenciação, recorrendo a análise de fragmentos de DNA de pequeno tamanho potenciando a sua utilização em amostras altamente processadas. Este método baseia-se na identificação de quatro SNPs diagnóstico, obtidos por comparação de genomas completos de cabra e ovelha.
Todos os testes realizados neste trabalho permitem apresentar este método como sendo robusto, com elevada sensibilidade e altamente especifico para as duas espécies em questão permitindo a detecção e identificação de material genético de cabra e/ou ovelha em diferentes tipos de amostras.
Este teste provou ser bastante eficaz, de fácil execução, com potencial aplicação no campo forense para a análise rápida de um grande número de amostras.
Considerando as limitações apresentadas por outras metodologias, este método apresenta a maior resolução para a identificação genética directa de produtos de cabra e ovelha.
5
7
Ovicaprines
1.1.1 Dawn of domestication and dispersal of pastoralism
Sheep and goat are ungulates, that belong to the Artiodatyla order, Bovidae family (including bovines, buffalo), and the sub-family Caprinae. Most fossil and molecular data suggest that the common ancestor of sheep and goat most likely originated in Asian habitats or the Mediterranean islands around 11 million years (My) ago during the late Myocene, and that a rapid species radiation occurred in the Plio-Pleistocene (5 My ago) [1]. These two species are recognized as among the most successful Pleistocene mammals, and its domestic subspecies
Capra hircus and Ovis aries are distributed today along wide geographical areas ranging from
Europe to Siberia and Alaska to South America. [2].
For thousands of years humans lived as hunter-gatherers until approximately 11,700 years ago. The Neolithic is known as a period of great development for Human societies that happened independently around the world, and at subsequent times, between 11,000 and 4,500 years ago. It is general consensus today that an episode of global warming and climate changes that preceded the Neolithic had a crucial impact in the evolution of fauna and flora and also in human societies. Humans consistently adapted to these alterations and exerted significant pressures on the environment, among which the most significant was the development of agriculture. Human societies suffered a change from hunter-gatherers societies to agriculture-based and sedentary societies and without it, the complex and innovative societies today would never have developed. Agriculture is then defined as the cultivation of plants and animal husbandry. Its development strengthened that lifestyle, and it led to stratification of societies [3, 4].
Goats and sheep are among the first animals to have been domesticated, at around 10 000 years ago [5]. Remains from sheep and goat collected at human sites indicate no domestication prior to this date, suggesting that humans were still hunting populations of wild goats and sheep at that time. However, an abundance of younger skeleton remains from these species is found at sites older than this time, and it is evident that at around 9,000 years ago, people were already keeping and raising sheep and goat at locations further away from their natural wild habitats [6]. The extraordinary versatility and adaptability of these animals allowed for their human-mediated dispersal with the expansion of Neolithic culture to almost all corners of the world. Today, domestic sheep and goat have a worldwide distribution with a significant presence in the developing world, and a particular and strong importance in places where the climate is harsh and the terrain unsuitable for other types of animal husbandry. Both species still own their popularity today to their multi-purpose use, providing meat, milk, skins, dung for fuel, and wool or fiber. In some places, like Tibet, sheep and goat are used as portage to transport goods like salt or grain and, furthermore, these animals have also an important significance in cultural and religious rituals [7].
8
1.1.2
Domesticates and their wild relatives
The Goat
Domestic goat Capra hircus is a species of the genus Capra, along with its wild relatives (bezoar, turs, markhors and ibexes).
The rapid diversification of the Capra taxa makes it difficult to infer the phylogenetic relationships and number of species and the fact that it prefers mountainous habitats (where fossil preservation is not favorable), complicates collecting paleontological data. This explains why archaeological and phylogenetic inferences are difficult, and as a consequence, the evolutionary history for species in this genus is still unclear, and the taxonomy of Capra is still under debate [8], with the number of recognized wild species today ranging from six to nine [9, 10].
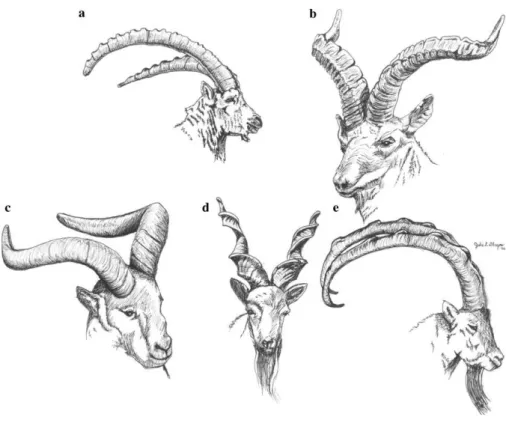
This taxonomy is mainly organized according to horn morphology of the adult males, as well as facial features and coat colors. Wild species depict a high degree of sexual dimorphism and include the mentioned ibex, tur, markhor and bezoar with the five major male adult horn morphotypes depicted in Figure 1 [10].
While the domestic goat is worldwide dispersed, wild species are adapted to extreme climates and currently restricted to mountainous areas in Europe, Africa and Asia. Only the ibex
Figure 1. Horn morphology of the five major morphotypes: (a) the generalized ibex-type (C. ibex, C. nubiana, C. sibirica, and C. caucasica), (b) the Spanish goat (C. pyrenaica), (c) the eastern tur (C. cylindricornis), (d) the markhor (C. falconeri), and (e) the bezoar-type (C. aegagrus). Artwork by Julie Dlugos. From Pidancier (2006) [10].
9 morphotype is found on all three continents. The current nine recognized species and respective distribution are summarized in Table 1.
Mitochondrial DNA and Y chromosome-based studies have contributed to understand the evolutionary history of the genus Capra [12, 13]. Six highly divergent haplogroups have been described in modern breeds of the domestic goat, with different geographical distributions [14]. It is not yet absolutely clear, however, whether these haplogroups represent independent domestication events. It is general consensus that goats were domesticated in the area ranging from the Central Zagros to Eastern Anatolia, throughout a long transitional period [13].
Sheep
Most molecular data show that the genus Ovis diverged from the other Caprini at around 2-3 million years ago (MYA), most likely in Asia according to paleontologists [15]. The domestic sheep, Ovis aries, has had an economic and culturally important part in human settlement suitable for a diverse range of purposes including the production of milk, meat and wool, since the Neolithic Agricultural Revolution [16]. Since then, more than 1,400 breeds are currently recognized as domestic sheep, and the genus Ovis is complex regarding its systematics and evolution. Morphological traits such as horn morphology and coat color, and geographical distribution criteria have supported several classification systems for wild sheep over the last two centuries [17], but up to seven species are currently recognized [18]. The European mouflon (Ovis musimon) and the Asiatic mouflon (Ovis orientalis) are found in the west of Asia and Europe, the Argali (Ovis ammon) inhabits the mountainous areas of central Asia, and the Urial (Ovis vignei) is dispersed across Asia Minor [19].
A number of mtDNA studies have helped to clarify the genetic history of wild sheep [17, 19], but the phylogenetic relationship between wild species still remains unresolved, as well as which wild species were the ancestrals of modern ovines. Recent studies have discounted both the Argali and the Urial as the ancestrals of the domestic Ovis aries, and strengthen the view of the European mouflon as a feral readaptation from an early domestication event [20].
10 Regarding domestic sheep, five mitochondrial haplogroups have been described (termed HA, HB, HC, HD and HE). Haplogroups HE and HD are the most recently found, and also the rarest, having been found only in sheep located in the Caucasus and Turkey [21]. Haplogroup HC has a more widespread distribution with examples from Asia, the Fertile Crescent, Caucasus and the Iberian Peninsula [22, 23]. HA and HA are the most commonly identified haplogroups and were found in every region where Ovis aries was sampled.
1.2
Discrimination of ovicaprines species
The osteological distinction between sheep and goat remains one of the classical problems in zooarchaeology [24, 25]. Despite all efforts that have been employed, morphological discrimination based on bone remains is almost impossible [24, 26]. It is particularly problematic in the case of bones from young animals or of specific bone fragments such as mandibles, vertebrae or distal parts of tibia. This lack of clear morphological markers or any absolute criteria has resulted in the classification of bones in a mixed category, often named as “Domestic ovicaprines” (or sheep/goat) [27-29]. This ambiguity is a major technical limitation in osteoarchaeology and limited the understanding of the roles these animals may have had in pre-historic economies, particularly in areas such as the Mediterranean basin and the Near East, where both species coexisted as livestock populations.
Improved biochemical methods have been developed to address this particular issue, among which the most promising were ancient DNA-based approaches [30-32].
Also in the food industry sector, the discrimination between sheep and goat has been a relevant issue, essentially in food-quality control procedures or the detection and identification of animal material in food samples.
Broadly, in the supply chain, traceability is defined as the ability to identify a food product in all stages of its production chain, from the producer to the consumer. Consumer interests and rights (e.g. vegetarianism, or other preference), public health (for individual with particular allergies), and the impediment of fraudulent misdescription have been the main motivators for authorities and researchers in creating more robust and efficient traceability systems [33-35]. Traditionally, traceability has been performed by the individual animal identification with a specific code associated with all information and documentation specific for that animal. With the advent of molecular techniques, the genetic identification of animal species has grown. From the dot-blot technique as the first genetic approach for species discrimination, to the PCR as the technique of choice at present, several other techniques based on protein analysis have also been developed. Many of these techniques, however, are redundant in the discrimination of species in cooked or highly processed foods. DNA analyses have gained preference over them, such as PCR-RFLP and RAPD-PCR, and currently the most common have focused on the mitochondrial cytochrome b gene, with reports on cattle, domestic pigs and red deer, among others [36, 37].
11
1.3 Molecular Genetics
Genetics has revolutionized the field of forensic science, in the last 20 years, taking advantage of the technical developments in molecular biology. From the description of the ABO blood groupings by Landsteiner in 1900, and its standardized use in forensic laboratories in 1931, forensic genetics has come a long way. Serological and protein-based techniques were later replaced by further improvements in molecular biology, and the 1960s and 1970s were the era of restriction enzymes, Sanger sequencing and Southern blottings, and the breakthrough in the analysis of DNA sequences. It was in 1983, however, that Karl Mullis conceptualized the Polymerase Chain Reaction PCR and imposed a hallmark in all aspects of molecular biology and [38], with an increased sensitivity in DNA analysis, reduced time in producing results, and a greater portion of the genome that could be analyzed. From the first forensic application using a single nucleotide polymorphism [39] to the routine analysis of short tandem repeats (STRs), the most commonly used genetic markers today in human identification, the technologies of DNA analysis were followed by advances in DNA extraction and quantification, commercially available typing kits and equipment for detecting genetic variation. In addition, accreditation of laboratories, high levels of standardization and laboratory quality control has made DNA analysis a robust and reliable forensic tool worldwide [38, 40].
1.3.1
Mitochondrial DNA
Mitochondrial DNA (mtDNA) is an extrachromosomal genome that resides separately in mitochondria, and is distinct from the nuclear genome. In mammals mtDNA is a double stranded (one Heavy (H) and one Light (L) strand), circular, histone-free molecule, and it codes for 13 polipeptides, 2 ribossomal RNAs and 22 transfer RNAs, carrying no introns and possessing little intergenic DNA. It is present in hundreds to thousands of copies in each cell, and in up to as many as 2-10 copies in each mitochondrion. Two broad regions are recognized: the coding region and the non-coding region. The coding DNA is predominant, and it has the exception of the two hypervariable regions (HVI and HVII), with mostly regulatory functions, comprising the mentioned non-coding region, known as the control region. This so called ‘Displacement loop’ (D-loop) has a high mutation rate and is responsible for the highly-variable sequences at the intra-species level. This high mutation rate is due to the low fidelity of the mtDNA polymerase and the absence of mechanisms of repair in the mitochondrial genome. This hypervariability is relevant in identity testing, since most of the variation between individuals, population or species resides in this region [41].
MtDNA has particular advantages in analyzing DNA samples that have been subjected to adverse conditions (such as processed food products or bones, and archaeological remains). In this situations DNA is expected to have suffered degradation, rendering difficult subsequent analysis. The main advantage in this context is its high copy number per cell as well as the protection offered by the mitochondria being a two-wall organelle, and this increases the probability of extracting DNA from degraded or damaged samples. Besides the high copy number, there are other characteristics unique to this molecular marker: its inheritance pattern, the lack of recombination, and a high mutation rate.
12
Inheritance pattern
In animals mtDNA has a uniparental mode of inheritance. Although paternal transmission does occur in some species of Drosophila, mouse, and birds [43], the generally exclusive maternal inheritance of mtDNA is considered one of its great advantages in population genetics, particularly in phylogeographic analysis [44]. Its consequent ¼ effective population size when comparing to autosomes, makes mtDNA, along with the male-specific region of the Y chromosome (MSY) symmetrical counterpart, more sensitive to demographic events such as bottlenecks, genetic drift or founding effects.
High copy number
In a typical mammalian somatic cell, mtDNA is present in hundreds to thousands of copies relatively to the nuclear genome. The fact that it has an extranuclear cytoplasmic location makes it also easier to obtain DNA for analysis, electing it the marker of choice when limiting working conditions of DNA analysis are implied, such as in ancient DNA studies or forensic genetics applications using degraded/lower amount of biological material. Not all copies in an individual are necessarily identical, however, either at the single mitochondrion, cellular, the particular tissue or individual level, a phenomenon known as heteroplasmy. General consensus, however, is that a substantial bottleneck occurs early in oogenesis, and an overall mtDNA homogeneity is generally observed in each individual organism [45].
13
Lack of recombination
Mitochondrial DNA does not undergo recombination. During meiosis, paternal and maternal alleles suffer a rearrangement within chromosomes. On the contrary, mtDNA is transmitted unaltered across generations through the maternal line. A case of direct observation of recombination in mtDNA has, however, been reported, highlighting the possibility of its occurrence. Considering the rarity of paternal mtDNA leakage phenomenon, however, one should not consider recombination a major issue [46]. This lack of recombination results in individuals having a single haplotype across generations, and hence genetic analysis can be more straightforward, since the generation of new lineages is only through the accumulation of mutations.
Mutation rate
The estimated mutation rate of mtDNA is much higher than that of nuclear genes; considering only the hypervariable regions, the mutation rate is even higher. It is debatable how higher this mutation is in this region and phylogenetic comparisons and pedigree-based studies have resulted in different estimates [47]. This observed discrepancy is due to the heterogeneity of mutation rate within the control region, with some positions being called ‘mutational hot spots’ due to mutation rates of four to five times as high compared to the average site. These claims are disputed but nevertheless, it is considered the correct approach to use phylogenetic rate in assessing a population deep history, and pedigree estimates on the other hand, for studies of a recent history [48]. On a different perspective, this understanding is important for forensic investigation aiming at discriminating between different species. Closely related lineages require an mtDNA region with a rapid rate of evolution, whether to discriminate individuals from lineages with a high phylogenetic divergence, more conserved regions should be used.
1.4
Single nucleotide polymorphisms
In the last few years, point mutations known as single nucleotide polymorphisms (SNPs) have also been described in forensic studies [49]. These molecular markers are highly distributed throughout the genome and represent the simplest most abundant form of genetic variation. Particularly important are the ones located in the non-recombinant part of the Y-chromosome and in the mitochondrial genome, because of their uniparental mode of inheritance, and not suffering recombination. This makes them useful in evolutionary and population studies, since they are transmitted as haplotype-blocks and recorded in the molecule from generation to generation. As biallelic markers, SNPs have a lower degree of polymorphism and a lower power of discrimination when compared to STRs [40]. Still, from a technical perspective, the advantages for using these markers include their low mutation rate, great capacity of automation and consequent fast and easy analysis of large number of samples, being all translated into a lower price of analysis [40, 49]. Furthermore it is now recognized that a careful selection of SNPs may provide a better estimate of certain phenotypes (ethnicity and certain physical traits for forensic interest) and this may constitute the main input these markers have in the forensic community. Forensic genetics also recognizes their importance from their applicability in species identification, because, as stated above, they largely constitute the
14 differences observed among species at a genetic marker, and can be used in identification from complex mixtures.
Regarding SNPs in mtDNA, and since the sequencing of the entire molecule is not practical, other methods have been developed to retrieve additional information from point mutations in mtDNA.
A number of methodologies for SNP typing have been developed, and extensive bibliography has been published revising the main strengths and weaknesses concerning these technologies. Traditionally, most methods were simply based on PCR amplification followed by gel electrophoresis but these methods were time-consuming and required large amounts of DNA. More advanced techniques are now in use for the high-throughput analysis for multiple loci simultaneously (the important characteristic of SNPs). Among TaqMan, Pyrosequencing, FRET analysis and DNA microarrays, SNaPshot has been described as a rapid, robust and cheap assay for the simultaneous genotyping of few SNP [50, 51].
Still, no technology for scoring SNPs has become a standard, and the choice of a method to use still depends on the purpose of the analysis and is a compromise between the reproducibility, sensitivity, number of SNPs and samples tested, and the cost of the analysis [50].
In this work we have focused on the mini-sequencing (SNaPShot) method for the detection of SNPs by capillary electrophoretic separation.
1.5 Mini-sequencing
The mini-sequencing reaction comprehends two separate stages: first, the amplification of the DNA fragments containing the SNPs of interest; secondly, the mini-sequencing reaction itself, targeting precisely the selected SNPs. The reaction is based on the extension of a single base at the 3’ position immediately adjacent to the SNP of interest (SBE), using unlabeled extension primers. These primers will incorporate ddNTPs labeled with different fluorochromes (cytosine – ‘blue’, adenine – ‘green’, guanine – ‘black’, thymine – ‘red’) in a reaction mixture that does not contain dNTPs. An additional fluorescence is used to mark the molecular weight of the internal size standard [52]. All extension primers may be designed to have tails non-homologous with other regions in the genome that do not anneal with the amplified DNA but allow for adjusting the electrophoretic mobility of the amplified fragments. The identified SNPs, therefore, will have two levels of identification, one based on the color of the fluorochrome incorporated, and the other on the estimated size of the amplified fragment. The electrophoretic peaks relative to each SNP are depicted separated by colors after subtraction of the background noise, and the size of each peak is estimated according to an internal size standard [52].
15
17 This work had as main objective the development and validation of a genetic system to be used in the discrimination between species of sheep and goat, in standard and sub-standard samples. It was intended to propose this system as an innovative tool, which is reliable, robust and reproducible with a potential application in a wide array of areas such as zooarchaeology, forensic science and food traceability.
19
21
3.1 Sampling and DNA extraction
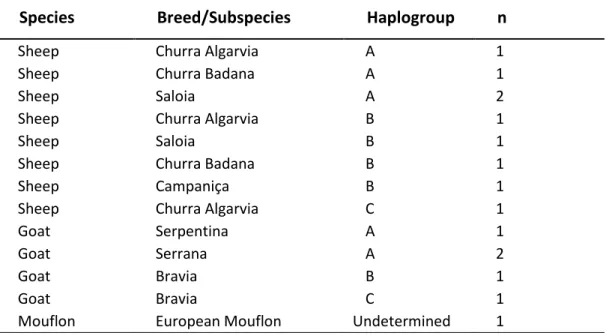
A set of eight reference samples (four goat and four sheep samples) was used to test this system in several stages of its development. Reference samples consisted of whole blood on FTA cards. Samples for diagnostic analysis were collected from a variety of locally available products derived from domestic breeds of sheep and goat, and an additional sample from an European mouflon (Ovis aries musimon) (Table 1). This selection aimed at a preliminary analysis of available products.
Table 1.Sample list including domestic sheep and goat (autochthonous breeds) with respective assigned breed (common name) and European mouflon, from several regions across Portugal, and from different haplogroups. n – number of samples.
Species
Breed/Subspecies
Haplogroup
n
Sheep Churra Algarvia A 1
Sheep Churra Badana A 1
Sheep Saloia A 2
Sheep Churra Algarvia B 1
Sheep Saloia B 1
Sheep Churra Badana B 1
Sheep Campaniça B 1
Sheep Churra Algarvia C 1
Goat Serpentina A 1
Goat Serrana A 2
Goat Bravia B 1
Goat Bravia C 1
Mouflon European Mouflon Undetermined 1
Mixtures of sheep and goat DNA were used to evaluate the sensitivity of the test. The goal was to evaluate how this system performs in the analysis of samples containing more than one genetic contributor. Sensitivity tests were performed in DNA mixtures produced in the laboratory DNA mixtures were obtained by extracting mixtures of goat and sheep’s milk in the proportions described below in Table 2.
Table 2.Proportions of milk in volume used for the obtention of DNA mixtures of sheep and goat used in sensitivity tests. Reference goat sample Reference sheep sample 1 99 1 9 1 1 9 1 99 1
22 Additionally, samples from different species were tested, with the purpose of evaluating the specificity of the test for the genus Ovis and the genus Capra. Analyzed reference DNA samples were from species of Homo sapiens, Oryctolagus cuniculus, Bos taurus, Equus caballus and Canis
lupus.
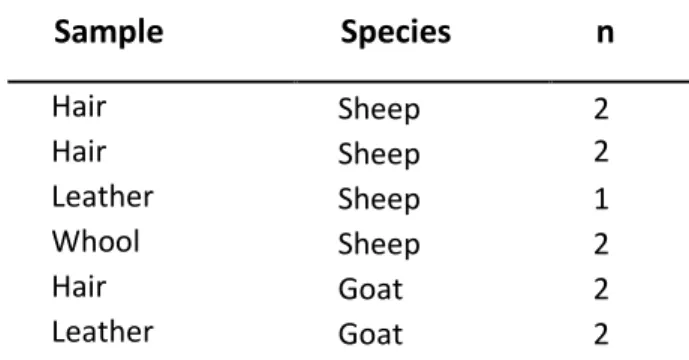
The test was finally validated in 11 additional samples collected from commercially available products containing sheep or goat, available in local retail markets (Table 3). These samples were used to assess the robustness of the test and the ability to diagnose a profile in highly processed materials.
Table 3.Sample list of commercially available products with goat or sheep origin. n – number of tested samples.
Sample
Species
n
Hair Sheep 2 Hair Sheep 2 Leather Sheep 1 Whool Sheep 2 Hair Goat 2 Leather Goat 2DNA extractions were performed using a standard Phenol-Chloroform protocol [53] for tissues, and a standard Chelex method (Biorad, USA) for dry blood in FTA cards [53]. DNA was kept at -20 ºC after extraction.
3.2 Mitochondrial SNP selection
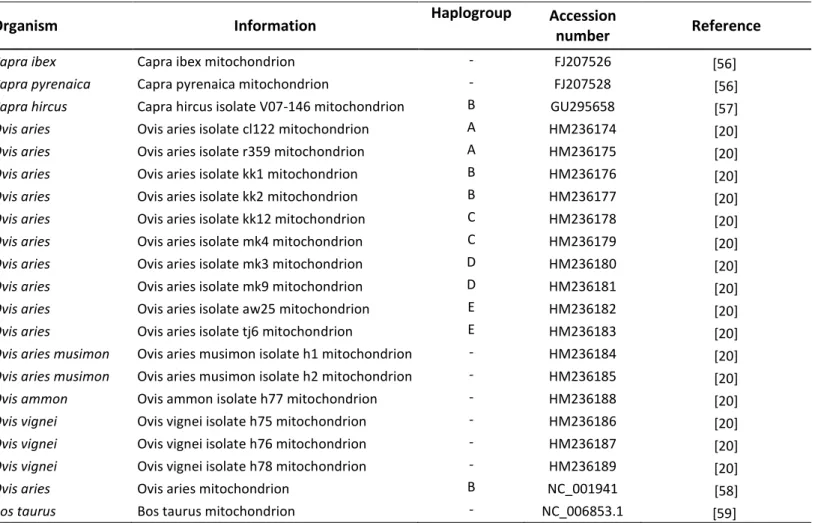
In order to identify diagnostic SNPs for discrimination between Capra and Ovis species we built a phylogenetic tree using publicly available mtDNA sequences. We used complete mtDNA sequences from previously published articles, in a total of 20 sequences (17 sequences from sheep and 3 from goat) (Table 4). The tree was built using Neighbour-Joining method with Tamura-Nei genetic distance model [54]. A Bos taurus (Genbank NC_006853.1) complete sequence served as an outgroup. Complete and publicly available Ovis and Capra mtDNA sequences were retrieved from Genbank (http://www.ncbi.nlm.nih.gov/genbank/) and aligned against a reference sequence (Capra ibex, Genbank FJ207526), using the MUSCLE algorithm implemented on the Geneious software [55].
23
Table 4. List of complete mtDNA sequences retrieved from Genbank and respective accession number.
Organism Information Haplogroup Accession
number Reference
Capra ibex Capra ibex mitochondrion - FJ207526 [56]
Capra pyrenaica Capra pyrenaica mitochondrion - FJ207528 [56]
Capra hircus Capra hircus isolate V07-146 mitochondrion B GU295658 [57]
Ovis aries Ovis aries isolate cl122 mitochondrion A HM236174 [20]
Ovis aries Ovis aries isolate r359 mitochondrion A HM236175 [20]
Ovis aries Ovis aries isolate kk1 mitochondrion B HM236176 [20]
Ovis aries Ovis aries isolate kk2 mitochondrion B HM236177 [20]
Ovis aries Ovis aries isolate kk12 mitochondrion C HM236178 [20]
Ovis aries Ovis aries isolate mk4 mitochondrion C HM236179 [20]
Ovis aries Ovis aries isolate mk3 mitochondrion D HM236180 [20]
Ovis aries Ovis aries isolate mk9 mitochondrion D HM236181 [20]
Ovis aries Ovis aries isolate aw25 mitochondrion E HM236182 [20]
Ovis aries Ovis aries isolate tj6 mitochondrion E HM236183 [20]
Ovis aries musimon Ovis aries musimon isolate h1 mitochondrion - HM236184 [20]
Ovis aries musimon Ovis aries musimon isolate h2 mitochondrion - HM236185 [20]
Ovis ammon Ovis ammon isolate h77 mitochondrion - HM236188 [20]
Ovis vignei Ovis vignei isolate h75 mitochondrion - HM236186 [20]
Ovis vignei Ovis vignei isolate h76 mitochondrion - HM236187 [20]
Ovis vignei Ovis vignei isolate h78 mitochondrion - HM236189 [20]
Ovis aries Ovis aries mitochondrion B NC_001941 [58]
Bos taurus Bos taurus mitochondrion - NC_006853.1 [59]
SNP identification and selection as diagnostic for differentiating between the two species was performed using SplitsTree4 software [60]. Assuming all positions as equally diagnostic, the final selection for their inclusion in the method was manual, and followed empirical criteria to optimize a multiplex reaction, described in the section below. The premise to design this system was to include a high number of SNPs thus maximizing its performance.
3.3 Primer design
Two separate sets of primers are necessary for performing a mini-sequencing assay. The multiplex PCR amplification primers are used in the amplification of the fragments containing the SNPs of interest. Extension primers are subsequently used in the SBE reaction. A third set of primers were designed in this work for the independent sequencing of each fragment, as described below. This set of primers is not part of the mini-sequencing system and was used to amplify the regions containing the fragments described. The aim was to confirm the presence of the diagnostic SNP and the absence of polymorphisms in the primer annealing sites of the PCR and the mini-sequencing reaction.
All primers were designed manually and followed the standard criteria for primer design [49]: the G/C content in each primer should be above 45%; primer size should be between 18 and 22 bp long; annealing temperatures (calculated as G/C x 4 + A/T x 2 - 4) should be between 58 ºC
24 and 62 ºC. The selected primers were tested in silico for possible hairpin formation and primer-primer interactions with AutoDimer 3.0 software [61]. All primer-primers that had theoretical reactivity in multiplex were replaced with new primers.
3.3.1 PCR primers
PCR primers were designed for simultaneous co-amplification in a multiplex PCR (Table 5). These primers were designed to amplify fragments with length inferior to 90 bp in order to maximize the probability of PCR amplification in the presence of low quantity/low quality DNA.
Table 5.List of primers for multiplex PCR amplification of selected DNA fragments containing the four SNPs, designated by the number of the surveyed nucleotide position according to a reference mitochondrial genome (Genbank FJ207526).
3.3.2 SBE primers
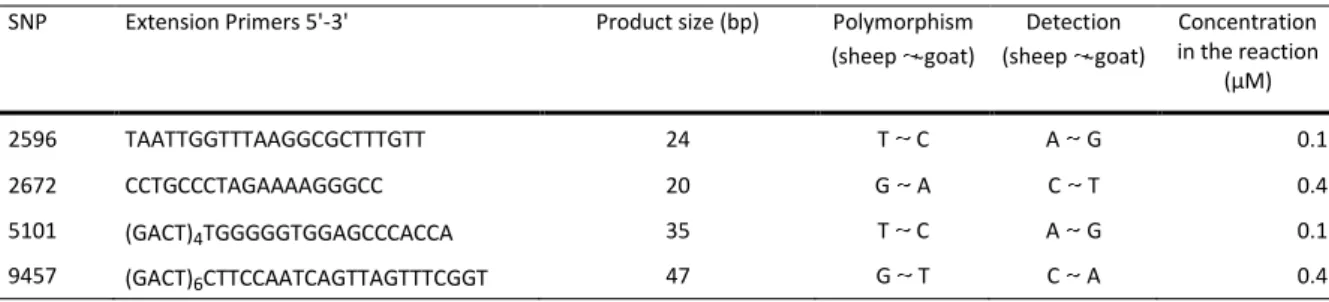
Single-base extension primers were also designed manually, with additional, non-homologous repetitions of [GACT]n tails added to the 5’ end (Table 6), as to obtain extension reaction
products with a significant difference in size, and hence, optimized electrophoretic resolution. Extension primer concentration in the reaction was optimized for each primer in order to obtain well balanced fluorescence signals for all selected SNPs [49].
Table 6. List of extensionprimers used for the mini-sequencing (SBE) reaction. The tail added for electrophoretic resolution is depicted in brackets, from a (GACT) motif, with the number of repetitions underscribed.
SNP Extension Primers 5'-3' Product size (bp) Polymorphism (sheep goat) Detection (sheep goat) Concentration in the reaction (µM) 2596 TAATTGGTTTAAGGCGCTTTGTT 24 T C A G 0.1 2672 CCTGCCCTAGAAAAGGGCC 20 G A C T 0.4 5101 (GACT)4TGGGGGTGGAGCCCACCA 35 T C A G 0.1 9457 (GACT)6CTTCCAATCAGTTAGTTTCGGT 47 G T C A 0.4
SNP Primer Forward 5'-3' Primer Reverse 5'-3' Fragment length (bp) Concentration in the reaction (µM) 2596 CCAGGTCGGTTTCTATCTGTT TAATTGGTTTAAGGCGCTTTGTT 91 0.2 2672 CCTGCCCTAGAAAAGGGCC GGAGAGGATTTGAATCTCTGAG 90 0.2 5101 CATCAATTGAATGCAAATCAACC AAGTTTCGTGGGGGTGGAGC 78 0.2 9457 GAGGCTCATGTCCTTTTAGTAT GGTTTATTGTTCTTTTTCGGATT 85 0.2
25
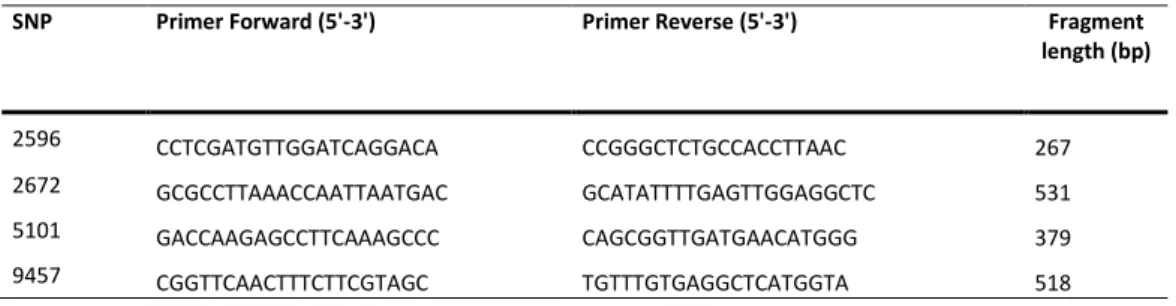
3.3.3 Sequencing primers
Sequencing primers were designed manually, following the same general criteria for primer design described in section 3.3. Sequencing primers were designed for amplifying fragments with a size between 200 and 600 bps (Table 7).
Table 7. Sequencingprimers used for the sequencing reaction.
3.4 Single locus PCR and sequencing
3.4.1 Singleplex PCR amplification
All primers to be used in the multiplex PCR reaction of the SBE assay were first tested in singleplex amplification. Independent amplification of each PCR primer pair (Table 5) was tested separately in the set of eight reference samples described in section 3.1.
Singleplex reactions were performed in a final volume of 5 µL, with 5-10 ng of DNA, 2 µM each primer, 2.5 µL Multiplex PCR Master Mix (QIAGEN GmbH, Germany) and 0.5 µL deionized water (QIAGEN). Amplifications were performed in a GeneAmp® PCR System 2720 thermocycler (Applied Biosystems, USA), under the following conditions: initial denaturation at 95 ºC for 15 min, followed by 30 cycles of 94 ºC for 1 min, 60 ºC for 1,30 min, 72 ºC for 1 min, and a final extension step at 72 ºC for 10 min.
3.4.2 Sequencing analysis
Sequencing analysis was performed for each fragment to confirm the presence of the diagnostic SNP at the expected position and the absence of polymorphisms at the PCR and SBE primer annealing sites (Table 8). Sequencing reactions were performed using the sequencing primers (Table 7) in the set of samples listed in section 3.1 (Table 1).
SNP Primer Forward (5'-3') Primer Reverse (5'-3') Fragment length (bp) 2596 CCTCGATGTTGGATCAGGACA CCGGGCTCTGCCACCTTAAC 267 2672 GCGCCTTAAACCAATTAATGAC GCATATTTTGAGTTGGAGGCTC 531 5101 GACCAAGAGCCTTCAAAGCCC CAGCGGTTGATGAACATGGG 379 9457 CGGTTCAACTTTCTTCGTAGC TGTTTGTGAGGCTCATGGTA 518
26
Table 8. Sequences of the mtDNA fragments containing the four diagnostic SNPs.
SNP Reference sequence
2596 CCAGGTCGGTTTCTATCTGTTATGTATTTCTCCCAGTACGAAAGGACAAGAGAAATAAGGCCAACTTCAACAAAGCGCCTTAAACCAATTA
2672 CCTGCCCTAGAAAAGGGCCTAGTTAAGGTGGCAGAGCCCGGTAATTGCGTAAAACTTAAACCTTTATACTCAGAGATTCAAATCCTCTCC
5101 CATCAATTGAATGCAAATCAACCACTTTAATTAAGCTAAATCCTCACTAGACTGGTGGGCTCCACCCCCACGAAACTT
9457 GAGGCTCATGTCCTTTTAGTATTAATCAGTACAACTGACTTCCAATCAGTTAGTTTCGGTATAATCCGAAAAAGAACAATAAACC
*PCR primers and diagnostic SNPs are shown in uppercase and bold, and SBE primers (tails not represented) are underlined.
Sequencing reactions were performed in a final volume of 5 µL, combining 2.5 µL of previously purified amplified DNA fragments (purification described in section 3.2.3), 2 µM of primer forward, and 2 µL of BigDye® Terminator v3.1 Cycle Sequencing kit (Applied Biosystems), according to manufacturer’s specifications. The sequencing protocol consisted of an initial cycle of denaturation of 2 min at 96 ºC, followed by 35 cycles at 96 ºC for 15 sec, 50 ºC for 9 sec and 60 ºC for 2 min. These reactions were performed in a GeneAmp® PCR System 2720 thermocycler (Applied Biosystems). Sequencing reaction products were purified using Sephadex™ G-50 Fine DNA Grade columns (GE Healthcare, UK) and suspended in 12 µL of Formamide (Hi-Di Formamide, Apllichem, Germany). Electrophoretic separation of the fragments was performed in an ABI Genetic Analyzer 3130xl (Applied Biosystems), according to the recommendations of the manufacturer. Electrophoretic data were analyzed with Sequencing Analysis v5.2 software (Applied Biosystems) and manually compared to the relevant reference sequence (sheep – GenBank HM236186, [20]; goat – GenBank FJ207528, [56]).
3.5 Single-Base Extension
(
SBE) reaction
Two separate reactions compose the SBE method: a multiplex PCR amplification and a subsequent mini-sequencing reaction.
3.5.1 Multiplex PCR amplification
Multiplex PCR amplification of the four fragments containing the diagnostic SNPs were performed in a final volume of 5 µL, with 5-10 ng of DNA, 2 µM each primer, 2.5 µL Multiplex PCR Master Mix (QIAGEN) and 0.5 µL deionized water (QIAGEN). PCRs were performed in a GeneAmp® PCR System 2720 thermocycler (Applied Biosystems), under the following conditions: initial denaturation at 95 ºC for 15 min, followed by 30 cycles of 94 ºC for 1 min, 60 ºC for 1,30 min, 72 ºC for 1 min, and a final extension step at 72 ºC for 10 min.
3.5.2 SBE reaction
Multiplex PCR products were purified by digestion of non-incorporated dNTPs with 1 µL Exostar (USB Corporation, USA) for each 1.5 µL PCR product as follows: 15 min at 37º C, followed by enzymatic denaturation at 85º C for 15 min.
27 SBE reactions were performed in a final volume of 5 µL, with 1.5 µL of purified amplified PCR product, 0.5 µL deionized water, 0.5 µL SBE Mix (QIAGEN) and 2.5 µL SNaPshot Ready Reaction Mix (QIAGEN). All mixtures were submitted to 25 cycles of: denaturation at 96 ºC for 10 s, primer annealing at 50 ºC for 5 s and final extension at 60 ºC for 30 s.
SBE products were then purified using 1 µL SAP (USB Corporation) for each 5 µL sequenced product at 37 ºC for 60 min, followed by 15 min at 85 ºC.
For capillary electrophoresis, 0.5 µL of each mini-sequencing reaction product was added to 9.5 µL of a mixture 33:1 of Formamide (Applied Biosystems) and the internal size standard GeneScan Liz-120 (Applied Biosystems), respectively. Electrophoretic separation was performed in an ABI Genetic Analyzer 3130xl (Applied Biosystems) with 36 cm capillaries, using the filter E5 and POP-7 polymer (Applied Biosystems).
29
31
Mini-sequencing system
In developing this species discrimination system based on phylogenetic information, two aspects were addressed and balanced: on one hand, we considered mtDNA as the only reliable molecular marker for genetic analysis in highly processed damaged samples. On the other hand, if using this marker in addressing livestock species, one has to consider the correlation between haplotypes and geography in the population in study. Since domestication is a relatively recent event and several breeds today were created by human selection, the diverse genetic background of a female genetic founding pool has not been erased.
It has been demonstrated, however, that sheep and goat species show a clear phylogenetic divergence in mtDNA sequences, allowing for a clear discrimination between the two lineages. Nevertheless, when choosing a proper methodology, often the best option is to find a good compromise between quality/quantity of the sample, the laboratory resources, time limitations and the particular addressed question.
The first part of this study consisted in the analysis of the complete publicly available mtDNA sequences of sheep and goat. Five haplogroups from domestic sheep (Ovis aries, haplogroups A, B, C, D and E) and one haplogroup from domestic goat (Capra hircus, haplogroup B) and the feral European Mouflon were included, and additional ovine wild species Ovis vignei and Ovis
ammon, as well as wild caprine species Capra pyrenaica and Capra ibex. The high level of mtDNA
conservation between the two species is visible in the region shown as example (Figure 1). Of all the sequences available, 20 complete mitochondrial sequences (Ovis = 17 and Capra = 3) were finally considered taking into account the quality of the sequences (number of polymorphisms and/or deletions relatively to the reference sequence). Sequences directly submitted to Genbank without an associated published paper were excluded from this analysis.
The first aspect to be considered in the development of a mtDNA forensic methodology is the availability of high-quality, complete mitochondrial sequences for the issued species. Reference mtDNA genomes and respective additional information can be found in public databases such as the NCBI Organelle Genome Resources (http://www.ncbi.nlm.nih.gov/genbank/).
Figure 1.Partial overview of the alignment of 20 complete Ovis and Capra mtDNA sequences, depicting two groups of polymorphic patterns.
32 Also, the choice of the region to examine is crucial for the success of an mtDNA-based forensic test. Commonly used mtDNA regions in a forensic context are the noncoding control region and cytochrome b oxidase (CYTB). The control region is used for the identification of closely related lineages because of the high degree of variation among individuals. The coding region, on the other hand, is of more interest in forensic investigations aiming at discriminating divergent lineages at the level of species. This was accounted for in this work and only the coding region was used in these analyses.
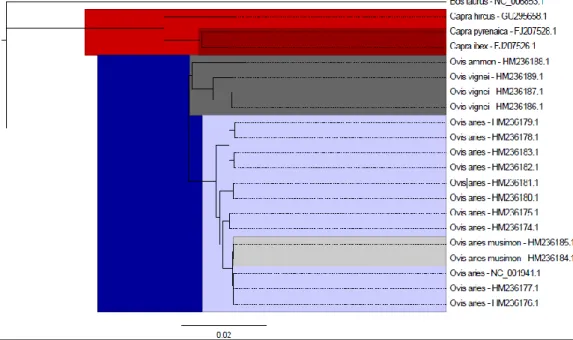
The phylogenetic reconstruction (Figure 2) shows that the available goat and sheep sequences represent the expected two distinct clades, in accordance with the current knowledge concerning the origin of both domestic species, as described in section 1.1.1.
The three caprine genomes show the separation between the domestic Capra hircus and the two wild species, Capra ibex and Capra pyrenaica. In the case of sheep, Urial and Argali sheep (Ovis vignei and Ovis ammon, respectively) separate from its domestic relatives Ovis aries. The genome of the European mouflon (Ovis musimon) supports previous findings that indicate it should not be considered a true wild sheep, but rather a remnant from a domestic subspecies readapted to a feral life [62].
The alignment performed with the selected sequences (a region shown as example in Figure 1) shows two clear patterns of polymorphisms and the large sharing of haplotypes among each species, supporting the phylogenetic tree. The differences however, are not enough to discriminate between different domestic Ovis and Capra sub-species or breeds. As mentioned, this is explained by the fact that extant breeds were recently created, and the fact that mitochondrial DNA is a lineage marker only accounting for the maternal side.
Figure 2.Phylogentic tree obtained with 21 complete mitochondrial DNA sequences , with17 sequences from Ovis species, 3 from
Capra, and Bos taurus as an outgroup. The major clades (Capra in red and Ovis in blue) are clearly separated. Wild species of sheep and the feral mouflon, are highlighted in dark, and light grey, respectively.
33 For selecting the SNPs to be included in the mini-sequencing assay we searched for interspecific polymorphisms.
A total of 856 interspecific polymorphic positions along the complete mitochondrial genome were identified using SplitsTree4 software. Of all these parsimony-informative sites, 44 were identified as diagnostic for the purpose of discrimination between the two species; this was performed empirically by manual screening through the complete mitochondrion and all selected positions. Then, while obeying to all criteria to design a multiplex PCR for those positions, described in the previous section, the final result was the election of four SNPs to be included in the SBE assay (Figure 3). We then set up to design PCR primers and mini-sequencing probes immediately attached to the selected SNP position for the subsequent mini-sequencing reaction.
4.1
Singleplex tests and sequencing
Singleplex reactions were performed to test each primer pair independently and identify all four SNPs separately for each species in a set of eight reference samples (goat, n = 4; and sheep, n = 4). Figures 4-11 depict the electropherograms identifying the expected four SNPs in each species.
All fragments containing the diagnostic position were sequenced and manually compared to the reference sequence of each species (goat: Genbank FJ207526.1; sheep: Genbank HM 236186) to
Figure 3.Schematic representation of the Capra ibex mitochondrial genome, and the location of the 44 polymorphic positions that allow for discrimination between Ovis and Capra species, marked and numbered according to the used reference sequence Genbank FJ207526. The polymorphic positions surveyed in the multiplex single base extension are highlighted in green.
34 confirm the presence of the diagnostic SNP and the absence of polymorphisms in the PCR and SBE primer annealing sites. All fragments contained the SNP at the expected position, and no polymorphisms were detected at the primer annealing sites.
Figure 4. Electropherogram showing the diagnostic SNP at position 2672 in a Capra hircus sample obtained by singleplex PCR.
Figure 5. Electropherogram showing the diagnostic SNP at position 2672 in a Ovis aries sample obtained by singleplex PCR.
35
Figure 8. Electropherogram showing the diagnostic SNP at position 5101 in a Capra hircus sample obtained by singleplex PCR.
Figure 9. Electropherogram showing the diagnostic SNP at position 5101 in a Ovis aries sample obtained by singleplex PCR.
Figure 10. Electropherogram showing the diagnostic SNP at position 9457 in a Capra hircus sample obtained by singleplex PCR. Figure 7. Electropherogram showing the diagnostic SNP at position 2596 in a Ovis aries sample obtained by singleplex PCR.
36 We verified that the estimated fragment size was not always in accordance with the size in bp confirmed by sequencing. This was expected because the electrophoretic mobility of DNA fragments varies depending not only on the size of the fragment but also on the nucleotide composition. Due to inherent chemical characteristics of the mini-sequencing reaction, slight differences for peak intensity for the same SNP may also be expected. It is also known that “blue” fluorochrome (guanine) and “red” fluorochrome (thymine) typically produce more intense signals than the remaining fluorochromes.
4.2
Multiplex Single Base Extension
This SBE multiplex test for discriminating between species of sheep and goat is constituted of four diagnostic SNPs identified in two sequential reactions: a multiplex PCR reaction, followed by a mini-sequencing reaction. The multiplex PCR reaction, amplifies the fragments containing the diagnostic SNP. In the mini-sequencing reaction, the SNP of interest is surveyed.
The results obtained for the multiplex single-base extension assay are shown in Figures 12 and 13. As an example, the profiles of reference samples of sheep and goat are illustrated.
In analyzing the electropherograms obtained for the several samples, only fluorescence signals with an observed mobility similar to that of the theoretically determined and with fluorescence signal superior to 200 FU, were considered as diagnostic to the referred position.
The unspecific peaks that are observable in the electropherograms, result from inherent chemical properties of the mini-sequencing reaction, and do not compromise the interpretation of the electropherograms.
37 By analyzing the obtained profiles with this mini-sequencing system regarding the tested reference samples, we attest for the high reproducibility and consistency through all of the results, as well as the high visual ease of reading, and hence technical practicability in discerning the two profiles of sheep and goat.
4.3 Tests in samples composed by a mixture of species
In the context of the analysis of archaeological, museological or processed commercial products, it is important to assess the performance of the multiplex system in biological material with more than one genetic contributor belonging to different species. For example, remains obtained in archaeological excavations are likely to be contaminated from several sources. In the food industry, composed products such as dairy products or other legally labeled materials may also contain more than one species.
In line with this requirement, we tested samples of reference DNA mixtures of Ovis aries and
Capra hircus in different relative concentrations. The results show that the method is robust and
sensitive, as all SNPs are identified (Figures 14-18). As already mentioned, however, some fluorescent signals, particularly ‘green’ and ‘black’ fluorochromes tend to decrease. This is
Figure 12. Electrophoretic profile representative of an Ovis aries reference sample obtained with the 4 SNPs-multiplex system.
38 especially true for samples in which one of the genetic contributor species is in a particular low relative proportion (1%), (Figures 14 and 18).
Figure 14. Electrophoretic profile of a mixture of reference DNA from Ovis aries and Capra hircus obtained with the 4 SNPs-multiplex system, in Capra/Ovis sample ratios of, respectively, 1%-99%.
Figure 15. Electrophoretic profile of a mixture of reference DNA from Ovis aries and Capra hircus obtained with the 4 SNPs-multiplex system, in Capra/Ovis sample ratios of, respectively, 10%-90%.
Figure 16. Electrophoretic profile of a mixture of reference DNA from Ovis aries and Capra hircus obtained with the 4 SNPs-multiplex system, in Capra/Ovis sample ratios of, respectively, 50%-50%.
39 The tests performed in samples composed by mixtures of both species depict this system as highly sensitive to detect presence of sheep and/or goat in a sample. All results were positive and proved that this system is able to perform in circumstances evolving samples with more than one genetic contributor. It is particularly noteworthy the ability to identify the two profiles even in a relative proportion of 1:100 of each species.
4.4 Cross-species reactivity
It is important that the method here presented is highly specific for the two species under survey. The specificity was evaluated by testing it in different species, namely Homo sapiens, Bos
taurus, Equus caballus, Oryctolagus cuniculus and Canis lupus familiaris. The results were
negative for all species, thus showing that species other than Capra hircus and Ovis aries did not interfere with the results. However, a significant peak amplified in the Bos taurus sample, probably due to an homologous sequence in this species. This was confirmed by singleplex PCR followed by gel electrophoresis revealing amplification for fragment 5101 Bos taurus. Apart from this result, no profile characteristic of sheep or goat was observed in all tested species (Figures 19-23).
Figure 17. Electrophoretic profile of a mixture of reference DNA from Ovis aries and Capra hircus obtained with the 4 SNPs-multiplex system, in Capra/Ovis sample ratios of, respectively, 90%-10%.
Figure 18. Electrophoretic profile of a mixture of reference DNA from Ovis aries and Capra hircus obtained with the 4 SNPs-multiplex system, in Capra/Ovis sample ratios of, respectively, 99%-1%.
40
Figure 19. Electrophoretic profile representative of a specificity test in a Homo sapiens reference sample, obtained with the 4 SNPs-multiplex method.
Figure 20. Electrophoretic profile representative of a specificity test in a Bos taurus reference sample, obtained with the 4 SNPs-multiplex method.
Figure 21. Electrophoretic profile representative of a specificity test in an Equus caballus reference sample, obtained with the 4 SNPs-multiplex method.
41
Figure 22. Electrophoretic profile representative of a specificity test in an Oryctolagus cuniculus reference sample, obtained with the 4 SNPs-multiplex method.
Figure 23. Electrophoretic profile representative of a specificity test in a Canis lupus familiaris reference sample, obtained with the 4 SNPs-multiplex method.
4.5 Identification of sheep and goat in commercial samples
The final step was the validation of this test in an array of commercial samples. These samples, presumably containing low quantity/low quality of extractable DNA, provide the ideal scenario for the limiting working conditions of DNA analysis in the context of archaeological, museological and general processed commercial products.
The electropherograms obtained in the commercial samples were quite similar to the ones obtained from reference samples regarding peak size and intensity, being able to identify and detect all diagnostic SNPs (Figures 24-27). These results show that this system is highly sensitive, since it proves useful in the analysis of samples even with presumably degraded DNA. Its applicability in the analysis of archaeological and museological specimens is therefore an interesting possibility.
42 The success in all these results can be explained by three main reasons. First, the use of mtDNA as the marker of choice enables the success of a PCR to target DNA when nuclear DNA is of difficult extraction. Secondly, the phenol-chloroform DNA extraction method results in high yield and purity of DNA extracts. Lastly, PCR primers were designed to amplify fragments of short size (less than 90 bps), and this allows to obtain results even in samples with degraded DNA.
Figure 24. Electrophoretic profile representative of the Ovis species in DNA extracted from sheep wool obtained with the 4 SNPs-multiplex method.
Figure 25. . Electrophoretic profile representative of the Ovis species in DNA extracted from sheep leather obtained with the 4 SNPs-multiplex method.
Figure 26. Electrophoretic profile representative of the Capra species in DNA extracted from goat hair obtained with the 4 SNPs-multiplex method.
Figure 27. Electrophoretic profile representative of the Capra species in DNA extracted from goat leather obtained with the 4 SNPs-multiplex method.
![Table 1. Current geographical distribution of the genus Capra according to Shackleton(1997) [9]](https://thumb-eu.123doks.com/thumbv2/123dok_br/18717355.918272/19.892.85.818.238.439/table-current-geographical-distribution-genus-capra-according-shackleton.webp)