Chemical characteristics, degradation kinetics and gas production of
arboreal species for ruminants
1Características químicas, cinética de degradação e produção de gases de espécies
arbóreas para ruminantes
Leandro Pereira de Oliveira2*, André Luiz Rodrigues Magalhães3, Ana Lúcia Teodoro4, Albericio Pereira de
Andrade3, Kelly Cristina dos Santos5 and Gherman Garcia Leal de Araújo6
ABSTRACT - The breeding systems of the small ruminants are extensive in the great majority, in which the animals are created in areas of native pasture named Caatinga, being necessary the knowledge on the chemical composition and its characteristics of feed degradation is crucial to increase nutrient use efficiency. Thereat, the objective of this study was to evaluate the chemical composition, the minerals, the carbohydrates and nitrogenous compounds fractionation, the degradability, in vitro dry matter digestibility and the in vitro gas production of arboreal species, those are consumed by goats and sheeps. The species evaluated were Cnidoscolus phyllacanthus (Muell. Arg.) Pax. et K. Hoffman, Mimosa tenuiflora (Willd.) Poiret, Myracrodruon
urundeuva Fr. All., Poincianella bracteosa (Tul.) L. P. Queiroz, Spondias tuberosa Arr. Cam. and Ziziphus joazeiro Mart. It
was found that Mimosa tenuiflora has a higher crude protein quantity (174.9 g.kg-1 DM). Spondias tuberosa and Myracrodruon
urundeuva had the highest values for total carbohydrates compared to the other species analyzed. As for the fractionation of
nitrogenous compounds, the highest proportion of fraction A was found for Cnidoscolus phyllacanthus (375.5 g.kg-1 CP). Among
the species studied, Cnidoscolus phyllacanthus is highlighted with the highest ruminal degradation (61.63%) and dry matter digestibility (627.1 g.kg-1 DM), reflecting higher gas production (206.02 mL.g-1 DM). Cnidoscolus phyllacanthus, Poincianella
bracteosa and Myracrodruon urundeuva showed a greater availability of nutrients in the rumen which is fundamental to increase
the amount of ruminal microbial protein which reaches the small intestine for use by the animal. Key words: Goats. Native pasture. Semi-arid. Sheep.
RESUMO - Os sistemas de criação dos pequenos ruminantes são extensivos na grande maioria, em que os animais são criados em áreas de pastagem nativa denominada Caatinga, sendo necessário o conhecimento da composição química e suas características de degradação alimentar para aumentar a eficiência do uso de nutrientes. Com isso, objetivou-se avaliar a composição química, os minerais, o fracionamento dos carboidratos e dos compostos nitrogenados, a degradabilidade, a digestibilidade in vitro da matéria seca e a produção de gás in vitro de espécies arbóreas, que são consumidas por caprinos e ovinos. As espécies avaliadas foram Cnidoscolus phyllacanthus (Muell. Arg.) Pax. e K. Hoffman, Mimosa tenuiflora (Willd.) Poiret, Myracrodruon urundeuva Fr. All., Poincianella bracteosa (Tul.) L.P. Queiroz, Spondias tuberosa Arr. Cam. e Ziziphus
joazeiro Mart. Verificou-se que Mimosa tenuiflora possui uma maior quantidade de proteína bruta (174,9 g.kg-1 MS). Spondias
tuberosa e Myracrodruon urundeuva apresentaram os maiores valores de carboidratos totais em comparação com as demais
espécies analisadas. Quanto ao fracionamento de compostos nitrogenados, a maior proporção da fração A foi encontrada para Cnidoscolus phyllacanthus (375,5 g.kg-1 PB). Entre as espécies estudadas, Cnidoscolus phyllacanthus é destacado com
maior degradação ruminal (61,63 %) e digestibilidade da matéria seca (627,1 g.kg-1 MS), refletindo uma maior produção de
gás (206,02 mL.g-1 MS). Cnidoscolus phyllacanthus, Poincianella bracteosa e Myracrodruon urundeuva apresentaram maior
disponibilidade de nutrientes no rúmen, o que é fundamental para o aumento potencial da quantidade de proteína microbiana ruminal que chega ao intestino delgado para ser utilizada pelo animal.
Palavras-chave: Caprinos. Pastagem nativa. Semiárido. Ovinos.
DOI: 10.5935/1806-6690.20200047 *Author for correspondence
Received for publication 24/04/2019; approved on 16/04/2020
1Pesquisa financiada pela Coordenação de Aperfeiçoamento de Pessoal de Nível Superior (CAPES) e Banco do Nordeste do Brasil (BNB)
2Departamento de Zootecnia, Centro de Ciências Agrárias, Universidade Federal da Paraíba/UFPB, Rodovia BR 079 - Km 12, Areia-PB, Brasil,
58.397-000, leandropo.zootecnista@gmail.com (ORCID ID 0000-0002-3014-0915)
3Departamento de Zootecnia, Universidade Federal do Agreste de Pernambuco/UFAPE, Garanhuns-PE, Brasil, andre30036@gmail.com
(ORCID ID 0000-0003-2211-6795), albericio3@gmail.com (ORCID ID 0000-0002-1223-394X)
4Instituto Federal de Educação, Ciência e Tecnologia do Piauí, Paulistana-PI, Brasil, analuciatzoo@gmail.com (ORCID ID 0000-0002-2752-6737), 5Programa de Pós-Graduação em Zootecnia, Departamento de Zootecnia, Universidade Federal Rural de Pernambuco/UFRPE, Recife-PE, Brasil,
kelly_venturosa@hotmail.com (ORCID ID 0000-0002-3704-1936)
INTRODUCTION
Brazilian Northeast has the largest national herd of goats and sheep (IBGE, 2017), specifically in Semi-arid region. The breeding systems of these animals are extensive in the great majority, in which the animals are created in areas of native pasture named Caatinga. This biome presents a great diversity of forage species and participates in about 70 % in the feeding of these animals, so that the dry period is prolonged, the contribution tends to increase due to the availability of dry leaves (NUNES et al., 2016).
The diet of small ruminants in the Brazilian Semi-arid region is often based on the grazing of Caatinga native plants, which are the only sources of protein and energy for those animals. Given its botanical diversity, management practices should be adopted to ensure the preservation of the vegetation, which, according to Souza
et al. (2013) makes the knowledge of quantitative and
qualitative parameters necessary.
The knowledge on the chemical composition and its characteristics of feed degradation is crucial to increase nutrient use efficiency. As feed quality depends on its constituents, the nutritional evaluation of forages produced in Caatinga with a potential for feeding small ruminants is essential to increase the efficiency of the livestock in that region. The use of values presented in foreign tables of feed composition for diets formulation is common in the Brazilian Northeast region.
However, not all characteristics of feed available in the region are known. Studies on Caatinga arboreal species discussed the potential of these plants regarding its composition, especially crude protein content. However, it is important to note that such nutrients are complexed with the plant cell walls and secondary compounds, making them unavailable to animals (SANTANA et al., 2011). Thus, this study aimed to evaluate the chemical characteristics, minerals, carbohydrates and nitrogenous compounds fractionation, degradability and in vitro digestibility of dry matter and the in vitro gas production of the browse species from Brazilian Semi-arid region.
MATERIAL AND METHODS
The samples were collected in the Caatinga area owned by the Embrapa Semiarid Company located in the city of Petrolina, Pernambuco (PE), Brazil (9°09’ S, 40°22’ W, at 365.5 meters of altitude). The climate is classified, according to Köppen, as BSwh’ (tropical semi-arid, hot and dry). Rainfall in the year of collection was 287.4 mm. The evaluated species were Cnidoscolus
phyllacanthus (Muell. Arg.) Pax. et K. Hoffman, Mimosa
tenuiflora (Willd.) Poiret, Myracrodruon urundeuva Fr.
All., Poincianella bracteosa (Tul.) L.P. Queiroz, Spondias
tuberosa Arr. Cam. and Ziziphus joazeiro Mart. All
species were evaluated in natura, and all in vegetative phenological stage with completely expanded leaves, shredded and processed for further analysis.
Four plant samples of every species were collected at random. The species have expanded and compound leaves, with the exception of Cnidoscolus phyllacanthus, which has simple leaves. The branches collected had a maximum diameter of eight millimeters, because the animals do not consume branches with larger diameter. Then, all analyses were performed at the Animal Nutrition Laboratory of Federal University of Agreste of Pernambuco (UFAPE), former Academic Unit of Garanhuns (UAG). Chemical composition analyses – dry matter (DM) (930.15), organic matter (OM) (942.05), ash (942.05), crude protein (CP) (954.01) and ether extract (EE) (Sohxlet) (920.39) - were performed according to the methodology described by the Association of Official Analytical Chemists (ASSOCIATION OF OFFICIAL ANALYTICAL CHEMISTS, 1990). Neutral detergent fiber (NDF), acid detergent fiber (ADF) and NDF corrected
for ash and protein (NDFap) were determined according
to Van Soest (1963a) with modifications proposed by Senger et al. (2008). To determine lignin digested in acid (LDA), the methodology proposed by Van Soest (1963b) was used. The cellulose fraction (CEL) was estimated by the equation CEL = ADF - LDA. The determination of the minerals being the macronutrients - Potassium (K), Calcium (Ca), Magnesium (Mg), Phosphorus (P), Sulfur (S) and micronutrients: Boron (B), Copper (Cu), Iron (Fe), Manganese (Mn), Zinc (Zn), were determined by nitric-perchloric digestion according to Malavolta, Vitti and Oliveira (1997).
Total carbohydrates (TC) were calculated according to Sniffen et al. (1992), where TC = 100 - (CP + EE + Ash), and fractionated in A+B1, B2 and C, being the nonfibrous carbohydrates (NFC), corresponding to the fractions A+B1, by the difference between TC and NDFap. The fraction C represented by the indigestible NDF was obtained according to Valente et al. (2011). The fraction B2, was obtained by the difference between NDFap and the C fraction. For the fractioning of nitrogenous compounds, the non-protein nitrogen (fraction A), the neutral detergent insoluble nitrogen (NDIN) and the acid detergent insoluble nitrogen (ADIN) were estimated according to the methodology described by Licitra, Hernandez and Van Soest (1996). The fraction B1+B2 was obtained by means of the equation: B1+B2 = 100 - (A + B3 + C), while fraction B3 was obtained by the difference between NDIN and ADIN and fraction C considered as ADIN.
The in vitro dry matter degradability was determined according to the first stage of the Tilley and Terry (1963) method. Samples (milled in sieve of 2 mm) were incubated at 0, 3, 6, 9, 12, 18, 24, 36 and 48 hours at 39 °C. To estimate the parameters a, b and c, the model proposed by Ørskov and McDonald (1979) was used and
processed by the PROC NLIN procedure of the SAS®
statistical software, once the parameters a, b, and c were calculated, they were applied to the equation (ØRSKOV; McDONALD, 1979). The analysis of in vitro dry matter digestibility (IVDMD) was conducted according to Tilley and Terry (1963), with the modifications proposed by Holden (1999).
The in vitro gas production using technique a pressure transducer was used as proposed by Theodorou
et al. (1994). The cumulative gas production was estimated
by measuring the pressure of the gases produced during the fermentation process using a pressure transducer (LOGGER AG100 - Agricer) and graduated syringes for gas volume at 2, 4, 6, 8, 10, 12, 15, 18, 21, 24, 30, 36, 42 and 48 hours after incubation. Using pressure and volume data, an equation was generated, (y = 5.1612x - 0.3017), R2 = 0.9873, where the pressure (psi) and the gas volume
(mL) were related by the PROC REG of SAS® from 937
observations. In the equation developed at the Laboratory of Gas Production (-8°90’77” S, -36°49’49” W, altitude of 844 meters), it was observed that one psi = 4.859 mL of gases. From the equation, data (in psi) reported for volume of gas produced during incubation were used. To determine the parameters, the bicompartmental logistic model was used Schofield, Pitt and Pell (1994) with the
aid of the PROC NLMIXED of SAS®. All incubations
were used 1.0g of sample in each jar of glass (160 mL), and the ruminal fluid was taken from goats fed a balanced diet with Pennisetum purpureum and concentrate (80:20). The treatments were arranged in a completely randomized design with ten replications (Yij= µ + ti +eij; Yij– observation j, submitted to treatment i; µ - general constant; ti – effect of treatment I; eij – randon error associated with each observation). The data obtained from chemical analyses, fractionation of carbohydrates, nitrogenous compounds and IVDMD were submitted to analysis of variance using the PROC GLM procedure, and the means were compared by Tukey test at 0.05 significance level using the SAS® statistical software.
RESULTS AND DISCUSSION
The highest DM values found were 528.5 g.kg-1 of
natural matter (NM) for Poincianella bracteosa, followed by Mimosa tenuiflora and Ziziphus joazeiro, and the lowest value was found for Spondias tuberosa (297.4 g.kg-1 NM)
and Cnidoscolus phyllacanthus (270.1 g.kg-1 NM) (Table
1). The highest DM values obtained for P. bracteosa,
Z. joazeiro and M. tenuiflora can be explained by the
different morphological characteristics of these forages. The highest concentration of ash was observed for Z.
joazeiro (83.7 g.kg-1 DM) and the lowest concentration
was observed for P. bracteosa (45.4 g.kg-1 DM). M.
tenuiflora showed the highest ether extract (EE)
content among species (79.4 g.kg-1 DM) and Z. joazeiro
presented the lowest quantity of EE (10.4 g.kg-1 DM).
The highest concentrations of neutral detergent fiber corrected for ash and protein (NDFap) were 520.8 and 485.9 g.kg-1 DM for S. tuberosa and Z. joazeiro,
respectively, and the lowest concentration was 361.3 g.kg-1
DM for M. urundeuva. For ADF, there was variation from 416.7 g.kg-1 DM for S. tuberosa to 231.2 g.kg-1 DM for M.
tenuiflora (Table 1). The cellulose (CEL) concentration
was the highest in P. bracteosa (307.5 g.kg-1 DM) followed
by C. phyllacanthus (227.3 g.kg-1 DM) and S. tuberosa
(210.9 g.kg-1 DM), and the lowest concentration was
observed for M. tenuiflora (117.0 g.kg-1 DM). The
highest concentration of LDA was observed for S.
tuberosa (205.8 g.kg-1 DM) and lowest concentration for
P. bracteosa (85.5 g.kg-1 DM) (Table 1).
For non-fibrous carbohydrates (NFC), M.
urundeuva showed the highest concentration in its
composition, 451.7 g.kg-1 DM, followed by P. bracteosa
(368.9) and S. tuberosa (314.3). The content of fibrous components presented in this study are similar to the values found by Neves et al. (2014) and Nunes et al. (2016). Part of the energy used by the ruminal microflora is obtained from the fermentation of dietary carbohydrates, which are converted into short-chain fatty acids (SCFA), glucose precursors and fatty acids (OWENS; BASSALAN, 2016).
The levels of minerals present in the evaluated species presented a difference, except for potassium (K) (Table 2). The highest amount of phosphorus (P) was
observed in P. bracteosa, with 1.51 g.kg-1 DM and the
lowest in S. tuberosa with 0.83 g.kg-1 DM. Calcium (Ca)
found in Z. joazeiro was 22.18 g.kg-1 DM and 2.35 g.kg-1 in
M. tenuiflora. The presence of sulfur (S) was higher in Z. joazeiro (2.22 g.kg-1 DM). The iron content (Fe) observed
in the species ranged from 78.5 to 142.05 mg.kg-1 DM,
with a higher concentration found in C. phyllacanthus and lower in M. urundeuva.
The quantity of total carbohydrates (TC) was observed in the composition of S. tuberosa (835.1 g.kg-1
DM), followed by M. urundeuva (813.0 g.kg-1 DM) and
the lowest concentration was observed for M. tenuiflora (690.2) (Table 3). The highest concentration of TC presented by S. tuberosa does not mean more energy,
approximately 55% of the TC are not digestible (fraction C), in contrast, 70% of the TC of M. urundeuva can be degraded. Regarding the fractionation of carbohydrates (Table 3), the highest value for the fraction A+B1, corresponding to carbohydrates with a fast degradation
rate, was obtained for M. urundeuva (555.6 g.kg-1 TC)
followed by P. bracteosa (474.6). The lowest values were observed for S. tuberosa (376.6) and Z. joazeiro (356.6). C.
phyllacanhus, Z. joazeiro, M. urundeuva and P. bracteosa
showed a higher fraction B2 of TC (166.9; 152.4; 149.5 and 132.6 g.kg-1 TC, respectively) (Table 3).
Species with a higher proportion of the fraction B2, i.e., potentially digestible fibers, better support the growth of microorganisms that use fibrous
carbohydrates. Moreover, as the fiber undergoes a slow degradation, the use of protein sources with a slow degradation in the rumen is also appropriate because it allows a better synchronization between carbohydrates and proteins for a maximum efficiency of microbial protein synthesis and promotes a decrease in energy and nitrogen losses resulting from ruminal fermentation (LICITRA; HERNANDEZ; Van SOEST, 1996). S. tuberosa participated the most in the fraction C of TC, confirmed by the larger amount of lignin found in that forage. Pereira et al. (2010) performed the fractioning of the TC of Z. joazeiro, in vegetative
phenological stage, and found 309.1 g.kg-1 TC (A+B1),
284.5 g.kg-1 TC (B2) and 406.3 g.kg-1 TC (C), values
close to those observed in this study.
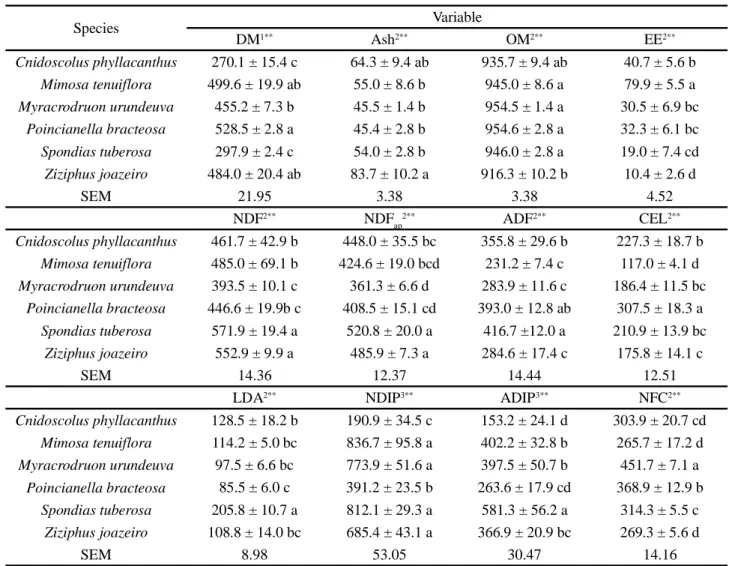
Columns means with different superscripts differ significantly (**0.01 and *0.05 of probability).1g.kg-1 NM;2g.kg-1 DM;3g.kg-1 CP
Species Variable DM1** Ash2** OM2** EE2** Cnidoscolus phyllacanthus 270.1 ± 15.4 c 64.3 ± 9.4 ab 935.7 ± 9.4 ab 40.7 ± 5.6 b Mimosa tenuiflora 499.6 ± 19.9 ab 55.0 ± 8.6 b 945.0 ± 8.6 a 79.9 ± 5.5 a Myracrodruon urundeuva 455.2 ± 7.3 b 45.5 ± 1.4 b 954.5 ± 1.4 a 30.5 ± 6.9 bc Poincianella bracteosa 528.5 ± 2.8 a 45.4 ± 2.8 b 954.6 ± 2.8 a 32.3 ± 6.1 bc Spondias tuberosa 297.9 ± 2.4 c 54.0 ± 2.8 b 946.0 ± 2.8 a 19.0 ± 7.4 cd Ziziphus joazeiro 484.0 ± 20.4 ab 83.7 ± 10.2 a 916.3 ± 10.2 b 10.4 ± 2.6 d SEM 21.95 3.38 3.38 4.52 NDF2** NDF ap 2** ADF2** CEL2** Cnidoscolus phyllacanthus 461.7 ± 42.9 b 448.0 ± 35.5 bc 355.8 ± 29.6 b 227.3 ± 18.7 b Mimosa tenuiflora 485.0 ± 69.1 b 424.6 ± 19.0 bcd 231.2 ± 7.4 c 117.0 ± 4.1 d Myracrodruon urundeuva 393.5 ± 10.1 c 361.3 ± 6.6 d 283.9 ± 11.6 c 186.4 ± 11.5 bc Poincianella bracteosa 446.6 ± 19.9b c 408.5 ± 15.1 cd 393.0 ± 12.8 ab 307.5 ± 18.3 a Spondias tuberosa 571.9 ± 19.4 a 520.8 ± 20.0 a 416.7 ±12.0 a 210.9 ± 13.9 bc Ziziphus joazeiro 552.9 ± 9.9 a 485.9 ± 7.3 a 284.6 ± 17.4 c 175.8 ± 14.1 c SEM 14.36 12.37 14.44 12.51
LDA2** NDIP3** ADIP3** NFC2**
Cnidoscolus phyllacanthus 128.5 ± 18.2 b 190.9 ± 34.5 c 153.2 ± 24.1 d 303.9 ± 20.7 cd Mimosa tenuiflora 114.2 ± 5.0 bc 836.7 ± 95.8 a 402.2 ± 32.8 b 265.7 ± 17.2 d Myracrodruon urundeuva 97.5 ± 6.6 bc 773.9 ± 51.6 a 397.5 ± 50.7 b 451.7 ± 7.1 a Poincianella bracteosa 85.5 ± 6.0 c 391.2 ± 23.5 b 263.6 ± 17.9 cd 368.9 ± 12.9 b Spondias tuberosa 205.8 ± 10.7 a 812.1 ± 29.3 a 581.3 ± 56.2 a 314.3 ± 5.5 c Ziziphus joazeiro 108.8 ± 14.0 bc 685.4 ± 43.1 a 366.9 ± 20.9 bc 269.3 ± 5.6 d SEM 8.98 53.05 30.47 14.16
Table 1 - Mean of dry matter (DM), ash, organic matter (OM), ether extract (EE), neutral detergent fiber (NDF), NDF corrected for ash and protein (NDFap), acid detergent fiber (ADF), cellulose (CEL), lignin digested in acid (LDA), neutral detergent insoluble protein (NDIP), acid detergent insoluble protein (ADIP), non-fibrous carbohydrates (NFC) and standard error median (SEM) of arboreal species
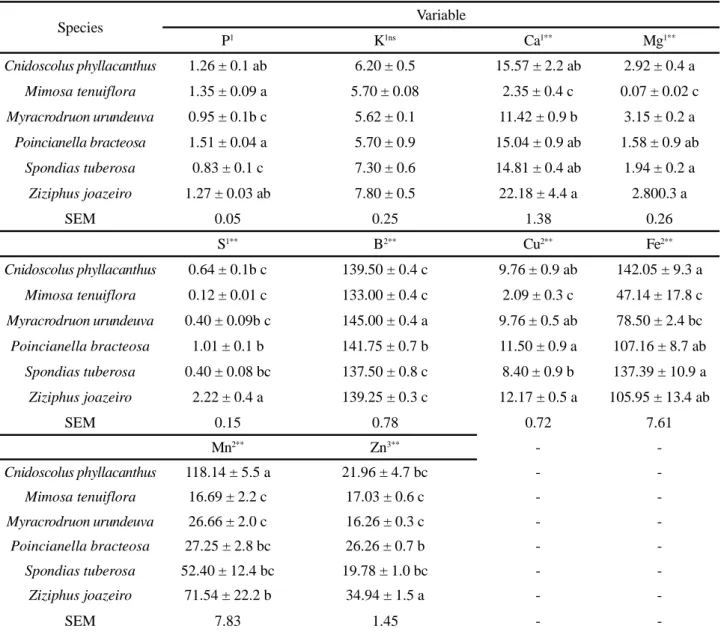
Columns means with different superscripts differ significantly (**0.01 and *0.05 of probability).1g.kg-1 MS;2mg.kg-1 MS
Table 2 - Composition of phosphorus (P), potassium (K), calcium (Ca), magnesium (Mg), sulfur (S), boron (B), copper (Cu), iron (Fe), manganese (Mn) and zinc (Zn) and standard error median (SEM) of arboreal species
Species Variable P1 K1ns Ca1** Mg1** Cnidoscolus phyllacanthus 1.26 ± 0.1 ab 6.20 ± 0.5 15.57 ± 2.2 ab 2.92 ± 0.4 a Mimosa tenuiflora 1.35 ± 0.09 a 5.70 ± 0.08 2.35 ± 0.4 c 0.07 ± 0.02 c Myracrodruon urundeuva 0.95 ± 0.1b c 5.62 ± 0.1 11.42 ± 0.9 b 3.15 ± 0.2 a Poincianella bracteosa 1.51 ± 0.04 a 5.70 ± 0.9 15.04 ± 0.9 ab 1.58 ± 0.9 ab Spondias tuberosa 0.83 ± 0.1 c 7.30 ± 0.6 14.81 ± 0.4 ab 1.94 ± 0.2 a Ziziphus joazeiro 1.27 ± 0.03 ab 7.80 ± 0.5 22.18 ± 4.4 a 2.800.3 a SEM 0.05 0.25 1.38 0.26 S1** B2** Cu2** Fe2** Cnidoscolus phyllacanthus 0.64 ± 0.1b c 139.50 ± 0.4 c 9.76 ± 0.9 ab 142.05 ± 9.3 a Mimosa tenuiflora 0.12 ± 0.01 c 133.00 ± 0.4 c 2.09 ± 0.3 c 47.14 ± 17.8 c Myracrodruon urundeuva 0.40 ± 0.09b c 145.00 ± 0.4 a 9.76 ± 0.5 ab 78.50 ± 2.4 bc Poincianella bracteosa 1.01 ± 0.1 b 141.75 ± 0.7 b 11.50 ± 0.9 a 107.16 ± 8.7 ab Spondias tuberosa 0.40 ± 0.08 bc 137.50 ± 0.8 c 8.40 ± 0.9 b 137.39 ± 10.9 a Ziziphus joazeiro 2.22 ± 0.4 a 139.25 ± 0.3 c 12.17 ± 0.5 a 105.95 ± 13.4 ab SEM 0.15 0.78 0.72 7.61 Mn2** Zn3** - -Cnidoscolus phyllacanthus 118.14 ± 5.5 a 21.96 ± 4.7 bc - -Mimosa tenuiflora 16.69 ± 2.2 c 17.03 ± 0.6 c - -Myracrodruon urundeuva 26.66 ± 2.0 c 16.26 ± 0.3 c - -Poincianella bracteosa 27.25 ± 2.8 bc 26.26 ± 0.7 b - -Spondias tuberosa 52.40 ± 12.4 bc 19.78 ± 1.0 bc - -Ziziphus joazeiro 71.54 ± 22.2 b 34.94 ± 1.5 a - -SEM 7.83 1.45 - -Species Fractions TC1** A+B12** B22** C2** Cnidoscolus phyllacanthus 751.8 ± 16.3 c 405.1 ± 35.6 c 166.9 ± 15.6 a 428.0 ± 49.3 bc Mimosa tenuiflora 690.2 ± 12.1 d 384.8 ± 24.0 bc 72.4 ± 22.9 b 542.8 ± 37.4 a Myracrodruon urundeuva 813.0 ± 12.1 ab 555.6 ± 4.9 a 149.5 ± 13.0 a 294.9 ± 8.3 d Poincianella bracteosa 777.3 ± 8.7 bc 474.6 ± 17.5 b 132.6 ± 10.0 a 392.8 ± 17.8 c Spondias tuberosa 835.1 ± 18.9 a 376.6 ± 9.7 c 68.7 ± 17.0 b 554.7 ± 22.8 a Ziziphus joazeiro 755.2 ± 4.8 c 356.6 ± 8.1 c 153.4 ± 39.2 a 490.0 ± 43.1 ab SEM 10.02 15.75 8.94 20.60
Columns means with different superscripts differ significantly (**0.01 and *0.05 of probability).1g.kg-1 DM;2g.kg-1 TC. Standard error median (SEM)
The crude protein (CP) concentration was observed in larger amounts in M. tenuiflora (174.9 g.kg-1 DM), Z.
joazeiro (150.6 g.kg-1 DM), P. bracteosa (145.0 g.kg-1
DM) and C. phyllacanthus (143.2 g.kg-1 DM), followed
by Myracrodruon urundeuva (111.1 g.kg-1 DM) and S.
tuberosa (91.7 g.kg-1 DM) (Table 4). Neves et al. (2014)
and Nunes et al. (2016), also in vegetative phenological stage, observed values of CP above 110 g.kg-1 DM, which
confirms the potential use of these forage species as protein sources for ruminant feed, particularly in tropical regions. It should be noted that the formulation of diets considering only the feed CP content without the knowledge of its availability may hinder the efficiency of synthesis of rumen microorganisms. It is important to note that the CP contents presented, despite being considered a quality parameter for forages, had significant portions attached to the fiber, i.e., unavailable for micro-organisms. Similarly, the presence of tannins and lignin tend to increase neutral detergent insoluble protein (NDIP) and acid detergent insoluble protein (ADIP) (LICITRA; HERNANDEZ; Van SOEST, 1996; NUNES et al., 2016). The highest proportion of neutral detergent insoluble protein (NIDP) was observed for the forages M. tenuiflora,
S. tuberosa, M. urundeuva and Z. joazeiro, with
836.7, 812.1, 773.9 and 685.4 g.kg-1 CP, respectively,
while the lowest concentration was observed for C.
phyllacanthus (190.9 g.kg-1 CP). The highest ADIP
content was obtained for S. tuberosa (581.3 g.kg-1 CP),
i.e., approximately 58 % of the protein present in its composition was unavailable.
For the fractioning of nitrogenous compounds, higher proportions of fraction A (NPN) were observed
for C. phyllacanthus (375.5 g.kg-1 CP). The fraction
B1+B2 had higher concentrations in P. bracteosa (481.5) and C. phyllacanthus (433.6) (Table 4). For the fraction B3, the highest amount was found for M. tenuiflora
and M. urundeuva (434.5 and 376.4 g.kg-1 CP). For
the fraction C, there was a higher concentration in S.
tuberosa, with 581.3 g.kg-1 CP in its composition, and
a lower concentration in C. phyllacanthus (153.2 g.kg-1
CP) (Table 4).
The highest percentage of fraction A (nitrogenous compounds) indicates the possibility of using this forage as a source of nitrogen readily available for rumen microorganisms. The high amount of N in the fraction A of C. phyllacanthus is noteworthy when associated with the availability of carbohydrates in the fraction A+B1. This is a fraction that presents a fast ruminal degradation, characterizing a synchrony of nutrient degradation rates in the rumen when using these forages, as recommended by the Cornell Net Carbohydrate and Protein System (CNCPS). Thus, when a forage has a high protein content and most of this protein is in fast degradation fractions, it is necessary to supply a carbohydrate source with a high ruminal degradation rate so that the microbial synthesis in the rumen is efficient. The fraction B3 is associated with cell walls with a slow degradation rate in the rumen (LICITRA; HERNANDEZ; Van SOEST, 1996). Thus, it has a larger passage, being a potential source of amino acids in the small intestine to be absorbed by the animal.
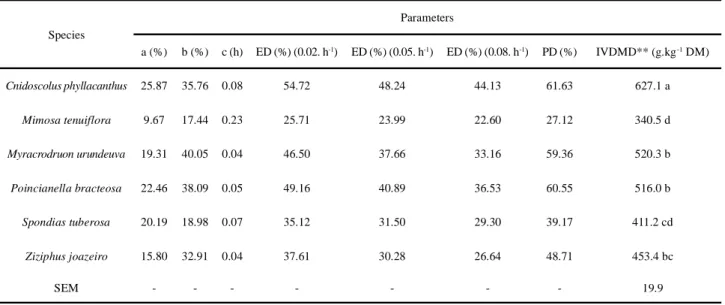
The degradation parameters a, b and c correspond to the percentage of compounds which can be soluble (a), compounds that are insoluble but can be degraded by microorganisms according to incubation time (b), and c corresponds to the degradation rate of insoluble compounds according to incubation time (t). The degradation potential (Dp) ranged from 27.12% (M. tenuiflora) to 61.63% (C. phyllacanthus) (Table 5).
As for digestibility, the highest value was 627.1 g.kg-1 DM (C. phyllacanthus) and the lowest value was
340.5 g.kg-1 DM (M. tenuiflora) (Table 5). Pereira et al.
(2012), working with hay the C. phyllacanthus found 636.6 g.kg-1 DM digestibility. The degradation curves of
Columns means with different superscripts differ significantly (**0.01 and *0.05 of probability).1g.kg-1 DM;2g.kg-1 CP. Standard error median (SEM)
Table 4 - Mean of nitrogen compounds fractions of arboreal species
Species Fractions
CP1** A2** B1+B22** B32** C2**
Cnidoscolus phyllacanthus 143.2 ± 11.3 b 375.5 ± 38.6 a 433.6 ± 28.3 a 37.7 ± 12.5 d 153.2 ± 24.1 d
Mimosa tenuiflora 174.9 ± 2.2 a 29.0 ± 1.4 c 134.3 ± 96.9 b 434.5 ± 63.0 a 402.2 ± 32.8 b
Myracrodruon urundeuva 111.1 ± 6.5c 14.3 ± 6.6c 211.8 ± 53.8b 376.4 ± 87.3ab 397.5 ± 50.7b
Poincianella bracteosa 145.0 ± 6.6 b 127.3 ± 27.4 b 481.5 ± 33.3 a 127.6 ± 20.8 cd 263.6 ± 17.9 cd
Spondias tuberosa 91.7 ± 9.7 c 34.4 ± 5.7 c 153.5 ± 28.2 b 230.8 ± 73.4 bcd 581.3 ± 56.2 a
Ziziphus joazeiro 150.6 ± 7.2 ab 110.0 ± 28.7 b 204.6 ± 23.0 b 318.5 ± 41.8 abc 366.9 ± 20.9 bc
the species evaluated showed distinct behaviors (Figure 1), reflecting the peculiarities of the composition of each species.
The low percentages of in vitro dry matter degradability (IVDDM) of M. tenuiflora and S. tuberosa are related to higher levels of LDA and fraction C of TC, although all plants were in the same phenological state, but presented early maturation of tissues., which influences nutritional value more than any other factor. As the plant matures, it tends to decrease the production of potentially digestible components, such as soluble carbohydrates
ED = effective degradability for passage rate equal to 0.02, 0.05 and 0.08 per hour; PD = potential degradability represented by the sum of a and b. Columns means with different superscripts differ significantly significantly (**0.01 and *0.05 of probability). – Unvalued. Standard error median (SEM)
Table 5 - Degradation and in vitro digestibility parameters of dry matter of arboreal species
Species Parameters a (%) b (%) c (h) ED (%) (0.02. h-1) ED (%) (0.05. h-1) ED (%) (0.08. h-1) PD (%) IVDMD** (g.kg-1 DM) Cnidoscolus phyllacanthus 25.87 35.76 0.08 54.72 48.24 44.13 61.63 627.1 a Mimosa tenuiflora 9.67 17.44 0.23 25.71 23.99 22.60 27.12 340.5 d Myracrodruon urundeuva 19.31 40.05 0.04 46.50 37.66 33.16 59.36 520.3 b Poincianella bracteosa 22.46 38.09 0.05 49.16 40.89 36.53 60.55 516.0 b Spondias tuberosa 20.19 18.98 0.07 35.12 31.50 29.30 39.17 411.2 cd Ziziphus joazeiro 15.80 32.91 0.04 37.61 30.28 26.64 48.71 453.4 bc SEM - - - 19.9
Figure 1 - Dry matter degradability curves of arboreal species in function of in vitro incubation time
and proteins, and increase the production of cell wall constituents. As a result, a decrease in IVDDM and dry matter intake by animals is expected. Habib et al. (2016), evaluated plants of the same genus (Ziziphus) and found dry matter digestibility values close to this one.
Regarding in vitro gas production, the fermentation of TC generated the highest final volume of gas for
C. phyllacanthus (203.0 mL.g-1 DM), followed by P.
bracteosa (197.91 mL.g-1 DM) (Table 6), in relation
to the others, demonstrating a greater availability of nutrients for rumen microorganisms. The contribution of fibrous carbohydrates (FC) in gas production was 86.0% (Z. joazeiro), 69.13% (M. urundeuva), 54.73% (C. phyllacanthus), 29.69% (M. tenuiflora), 24.09% (S.
tuberosa) and 17.94% (P. bracteosa).
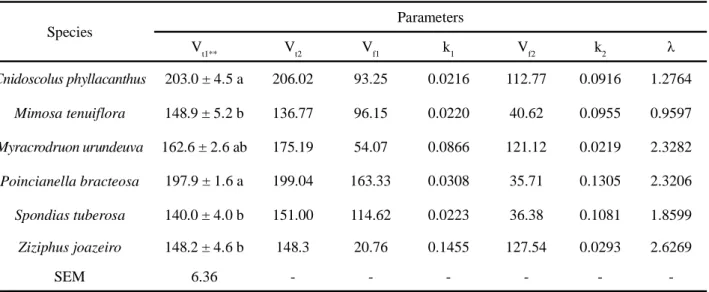
The total volume of gases observed (Vt1) was
close to that found by the bicompartmental model (Vt2), proving the model adjustment. The lowest volume of gases produced by the fermentation of TC of M.
tenuiflora, Z. joazeiro and S. tuberosa may have been
caused because 54, 49 and 55% of the TC, respectively, were present in the fraction C, which is not degradable by ruminal microorganisms. During the early events of ruminal degradation, soluble nutrients are responsible for the greatest volume of gases produced, i.e., the A+B1 fraction is responsible for the initial volume (Vf1) of gases produced from its degradation, which promotes a greater gas production specific rate (k1).
The greatest gas volumes produced by the fermentation of NFC were verified for P. bracteosa and
S. tuberosa. The lowest digestion rate (k2) estimated for the FC of M. urundeuva leads us to infer that other factors may be related to k2, such as intermediaries of lignin synthesis and/or the presence of tannins. Although the presence of secondary compounds of
Figure 2 - Volume of gases produced during in vitro incubation of arboreal species
Vt1 = total volume (mL.g -1 DM); V
t2 = total volume (mL.g
-1 DM) found using the model; V
f1 = volume (mL) of gas produced by the degradation of the
fraction A+B1 of the Cornell System (NFC); k1 = specific rate (h) of production of gases by the degradation of the fraction A+B1 (NFC); Vf2 = volume
(mL) of gases produced by the degradation of the fraction B2 of the Cornell System (FC); k2 = specific rate (h) of production of gases by the degradation
of the fraction B2 (FC); λ = latency (h). Columns means with different superscripts differ significantly (**0.01 and *0.05 of probability). – Unvalued. Standard error median (SEM)
Table 6 - Parameters for in vitro gas production of arboreal species obtained by the bicompartimental logistic model
Species Parameters Vt1** Vt2 Vf1 k1 Vf2 k2 λ Cnidoscolus phyllacanthus 203.0 ± 4.5 a 206.02 93.25 0.0216 112.77 0.0916 1.2764 Mimosa tenuiflora 148.9 ± 5.2 b 136.77 96.15 0.0220 40.62 0.0955 0.9597 Myracrodruon urundeuva 162.6 ± 2.6 ab 175.19 54.07 0.0866 121.12 0.0219 2.3282 Poincianella bracteosa 197.9 ± 1.6 a 199.04 163.33 0.0308 35.71 0.1305 2.3206 Spondias tuberosa 140.0 ± 4.0 b 151.00 114.62 0.0223 36.38 0.1081 1.8599 Ziziphus joazeiro 148.2 ± 4.6 b 148.3 20.76 0.1455 127.54 0.0293 2.6269 SEM 6.36 - - -
-the evaluated species is still not well characterized, it is known that significant levels of tannins can affect fermentation, ruminal microbiota and suppress methanogenesis (BHATTA et al., 2012; DURMIC et al., 2017; PAL et al., 2015).
CONCLUSIONS
1. Cnidoscolus phyllacanthus had the highest predominance of the fractions A+B1 (NFC) of carbohydrates and the fraction A (NPN) of nitrogenous compounds, with a synchrony in the availability of these fractions;
2. Cnidoscolus phyllacanthus, Myracrodruon urundeuva and Poincianella bracteosa showed the highest gas production;
3. In face of all values presented, all the evaluated species present satisfactory nutritional value, especially in the case of animal production in a Semiarid environment.
ACKNOWLEDGMENTS
We appreciate the support of the Bank of Northeastern Brazil (BNB) and of the Coordination for the Improvement of Higher Education Personnel (CAPES) in Brazil (project financing).
REFERENCES
ASSOCIATION OF OFFICIAL ANALYTICAL CHEMISTS. Official methods of analysis of AOAC international. 15 th ed. Virginia: AOAC, 1990. 684 p.
BHATTA, R. et al. Nutrient content, in vitro ruminal fermentation characteristics and methane reduction potential of tropical tannin-containing leaves. Journal of the Science of Food and Agriculture, v. 92, n. 15, p. 2929-9235, 2012. DURMIC, Z. et al. Differences in the nutrient concentrations,
in vitro methanogenic potential and other fermentative traits
of tropical grasses and legumes for beef production systems in northern Australia. Journal of the Science of Food and Agriculture, v. 97, n. 12, p. 4075-4086, 2017.
HABIB, G. et al. Nutritive value of common tree leaves for livestock in the semi-arid and arid rangelands of Northern Pakistan. Livestock Science, v. 184, p. 64-70, 2016.
HOLDEN, L. A. Comparison of methods of in vitro dry matter digestibility for ten feeds. Journal of Dairy Science, v. 82, n. 8, p. 1791-1794, 1999.
IBGE. Censo Agro 2017. Disponível em: https://censoagro2017. ibge.gov.br/templates/censo_agro/resultadosagro/pecuaria. html. Acesso em: 20 fev. 2019.
LICITRA, G.; HERNANDEZ, T. M.; Van SOEST, P. J. Standardization of procedures for nitrogen fractionation of ruminant feeds. Animal Feed Science and Technology, v. 57, p. 347-358, 1996.
MALAVOLTA, E.; VITTI, G. C.; OLIVEIRA, S. A. Avaliação do estado nutricional das plantas: princípios e aplicações. 2. ed. Piracicaba: Potafos, 1997. 319 p.
NEVES, A. L. A. et al. Tabelas nordestinas de composição de alimentos para bovinos leiteiros. Brasília: Embrapa, 2014. 184 p.
NUNES, A. T. et al. Plants used to feed ruminants in semi-arid Brazil: a study of nutritional composition guided by local ecological knowledge. Journal of Arid Environments, v. 135, p. 96-103, 2016.
ØRSKOV, E. R.; McDONALD, I. The estimation of protein degradability in the rumen from incubation measurements weighted according to rate of passage. Journal of Agricultural Science, v. 92, p. 499-503, 1979.
OWENS, F. N.; BASSALAN, M. Ruminal fermentation.
In: MILLEN, D.; DE BENI ARRIGONI, M.; LAURITANO
PACHECO, R. (ed.). Rumenology. Switzerland: Springer, 2016. p. 66-102.
PAL, K. et al. Evaluation of several tropical tree leaves for methane production potential, degradability and rumen fermentation in vitro. Livestock Science, v. 180, p. 98-105, 2015.
PEREIRA, E. S. et al. Determination of the proteins and carbohydrates fractions and estimative of the energy value of forages and by-products in Brazilian Northeast. Semina: Ciências Agrárias, v. 31, n. 4, p. 1079-1094, 2010.
PEREIRA, V. L. A. et al. Valor nutritivo e consumo voluntário do feno de faveleira fornecido a ovinos no Semiárido pernambucano. Revista Caatinga, v. 25, n. 3, p. 96-101, 2012.
SANTANA, D. F. Y. et al. Caracterização da caatinga e da dieta de novilhos fistulados, na época chuvosa, no Semiárido de Pernambuco. Revista Brasileira de Zootecnia, v. 40, n. 1, p. 69-78, 2011.
SCHOFIELD, P.; PITT, R. E.; PELL, A. N. Kinetics of fiber digestion from in vitro gas-production. Journal of Animal Science, v. 72, n. 11, p. 2980-2991, 1994.
SENGER, C. C. D. et al. Evaluation of autoclave procedures for fibre analysis in forage and concentrate feedstuffs. Animal Feed Science and Technology, v. 146, p. 169-174, 2008. SNIFFEN, C. J. et al. A net carbohydrate and protein system for evaluating cattle diets: II carbohydrate and protein availability. Journal of Animal Science, v. 70, n. 7, p. 3562-3577, 1992.
SOUZA, C. et al. Disponibilidade e valor nutritivo da vegetação de Caatinga no Semiárido norte riograndense do Brasil. Revista Holos, v. 3, p. 196-204, 2013.
THEODOROU, M. K. et al. A simple gas production method using a pressure transducer to determine the fermentation kinetics of ruminant feeds. Animal Feed Science and Technology, v. 48, p. 185-197, 1994.
This is an open-access article distributed under the terms of the Creative Commons Attribution License TILLEY, J. M. A.; TERRY, R. A. A two-stage technique for the
in vitro digestion of forage crops. Journal British of Grassland
Society, v. 18, n. 2, p. 104-111, 1963.
VALENTE, T. N. P. et al. Evaluation of ruminal degradation profiles of forages using bags made from different textiles. Revista Brasileira de Zootecnia, v. 40, n. 11, p. 2565-2573, 2011.
Van SOEST, P. J. Use of detergents in the analysis of fibrous feeds. I. Preparation of fiber residues of low nitrogen content. Journal of the Association of Official Agricultural Chemists, v. 46, n. 5, p. 825-829, 1963a.
Van SOEST, P. J. Use of detergents in the analysis of fibrous feeds. II. A rapid method for the determination of fiber and lignin. Journal of the Association of Official Agricultural Chemists, v. 46, n. 5, p. 829-835, 1963b.