Matilde Costa
BENTHIC COMMUNITIES IN SHIPWRECKS ALONG THE
PORTUGUESE CONTINENTAL COAST
Matilde Costa
BENTHIC COMMUNITIES IN SHIPWRECKS ALONG THE
PORTUGUESE CONTINENTAL COAST
Mestrado em Biologia Marinha
Trabalho efectuado sob a orientação de:
Professora Doutora Ester Serrão
Doutora Joana Boavida
BENTHIC COMMUNITIES IN SHIPWRECKS ALONG THE
PORTUGUESE CONTINENTAL COAST
Declaração de autoria de trabalho
Declaro ser a autora deste trabalho, que é original e inédito. Autores e trabalhos consultados estão devidamente citados no texto e constam da listagem de referências incluída.
________________________________________________________ (Matilde Costa Correia)
© Matilde Costa
A Universidade do Algarve reserva para si o direito, em conformidade com o disposto no Código do Direito de Autor e dos Direitos Conexos, de arquivar, reproduzir e publicar a obra,
independentemente do meio utilizado, bem como de a divulgar através de repositórios científicos e de admitir a sua cópia e distribuição para fins meramente educacionais ou de
investigação e não comerciais, conquanto seja dado o devido crédito ao autor e editor respectivos
i
AGRADECIMENTOS
Queria em primeiro lugar agradecer à Professora Ester Serrão, que permitiu a concretização deste projecto, aceitando orientá-lo e guiá-lo sempre que necessário! Em segundo lugar, agradecer à Joana Boavida e ao Diogo Paulo, por terem confiado e acreditado em mim. Obrigada por terem estado sempre presentes, por me terem orientado sempre que necessário e por tudo o que me ensinaram sobre mergulho e ciência!
Obrigada ao Dr. Jorge Assis por toda a disponibilidade e simpatia ao longo desta tese, por ter ajudado e aconselhado sempre que necessário. Ao Dr. Jorge Gonçalves e à Dra. Mercedes González-Wangüemert por terem auxiliado com a identificação das espécies.
Um obrigada enorme aos voluntários que integraram as equipas de mergulho responsáveis pelas amostragens: Diogo Paulo e Joana Boavida (outra vez), Delfim Machado, Paulo Cordeiro e Carolina Mourato. Um agradecimento em particular à Carolina que além de diving buddy foi amiga, com quem discuti estatística, inglês, referências e coisas da vida!
Obrigada à equipa que me acompanhou fora de água durante este ultimo ano: Jethro van't Hul, Pauline Raimbault, Nils Willenbrink, Susann Lüneburg, Nicole Gilotay, Mariana Santos, David Alves e Adriana Moreira. Tudo isto teria sido terrivelmente mais difícil sem vocês!
Por fim, obrigada à Eliana, patrocinadora de todas as minhas loucuras e aventuras, que sempre teve (e continua a ter) quase tanto entusiasmo por biologia quanto eu.
maggie and milly and molly and may went down to the beach (to play one day)
and maggie discovered a shell that sang so sweetly she couldn’t remember her troubles, and
milly befriended a stranded star whose rays five languid fingers were;
and molly was chased by a horrible thing which raced sideways while blowing bubbles: and
may came home with a smooth round stone as small as a world and as large as alone.
For whatever we lose (like a you or a me) it’s always ourselves we find in the sea.
ii
Abstract
Shipwrecks are the most conspicuous type of artificial reefs. Besides their impact on local biodiversity, they have a major impact on the diving industry, being some of the preferred diving sites worldwide. Artificial reefs have been used for a long time with various purposes across different regions. There are multiple studies about their effect on fish and benthic communities, but there is little research focusing on shipwrecks specifically. This thesis is the first survey of shipwrecks on the Portuguese coastline, comparing their benthic communities with adjacent natural reef communities, and analysing the spatial distribution patterns within each shipwreck. Four shipwrecks and four nearby natural reefs between Sesimbra and Tavira were sampled with video-transects. The data were divided into two datasets: one dataset included densities of organisms that could be individually counted and the other included percent cover of morphological groups that could not be individually assessed (e.g., algae and incrusting fauna). The density analysis revealed similar communities between shipwrecks along the coastline despite their different ages. Surprisingly, in most cases shipwrecks had different communities from natural rocky reefs, with 40 to 70% of biodiversity not coming from the local reefs. Also unexpectedetly, there were almost no differences between vertical and horizontal surfaces or between the exposed and protected sides of the wrecks, but intact (vs fragmented) parts of the shipwrecks harbour more biodiversity. Even though shipwreck age is likely to influence the observed colonization stage, it is hypothesized that a maximum of biodiversity is quickly reached, and thereafter a dynamic equilibrium is established, with the number of species remaining approximately constant, despite species compositional changes over time. Age also reduces the differences between artificial and natural reefs, making them more similar in therms of biodiversity. Overall, if remaining structurally in a good condition, shipwrecks can increase the local macrobenthic biodiversity.
iii
Resumo
Os naufrágios representam provavelmente o tipo de recife artificial mais conspícuo. Além do impacto nos ecossistemas e biodiversidade locais, constituem sítios de mergulho muito populares por todo o mundo. O impacto que naufrágios podem ter na indústria do mergulho é imenso. No geral, recifes artificiais são estruturas feitas pelo Homem que podem assumir várias formas, desde barcos a cubos de betão feitos propositadamente para serem afundados no mar. Em diferentes áreas, recifes artificiais têm funções diferentes, entre as quais gestão das pescas, prevenir a pesca de arrasto, compensação de perda de habitat e proteger habitats costeiros. Os recifes artificiais podem ter impactos positivos ou negativos nos ecossistemas. Consequências entre as quais mudanças no hidrodinamismo da área, alterações nas distribuições de sedimento e nas comunidades biológicas podem ser positivas ou não.
Esta tese representa o primeiro registo das comunidades bentónicas dos naufrágios na costa Portuguesa. Escolheram-se quarto naufrágios, um na costa oeste (Sesimbra) e três na costa sul (em Sagres, Portimão e Tavira): River Gurara, Torvore, Oliveira e Carmo e Titan. Por cada naufrágio amostraram-se também recifes rochosos locais, de modo a comparar as comunidades em cada tipo de recife: natural e artificial. Os objectivos principais deste projecto foram registar pela primeira vez as comunidades que habitam os naufrágios e criar uma base de dados disponível online, acessível a qualquer pessoa, que possa ser consultada e actualizada em estudos futuros sobre colonização de recifes artificiais. As hipóteses a testar foram: 1) Os naufrágios têm comunidades bentónicas diferentes uns dos outros e estas diferenças deverão estar relacionadas com os diferentes estados de colonização dos naufrágios devido às diferentes idades; 2) A biodiversidade deve aumentar com a idade do naufrágio, devido aos estados de colonização mais avançados; 3) Naufrágios com mais de oito anos (idade baseada num estudo prévio) devem apresentar comunidades semelhantes às dos recifes rochosos locais; 4) As partes intactas dos naufrágios devem possuir mais biodiversidade que as partes fragmentadas; 5) Os lados dos naufrágios mais expostos às correntes devem possuir mais biodiversidade que os lados mais protegidos; 6) Superfícies verticais nos naufrágios devem possuir mais biodiversidade que as superficies horizontais, devido à taxa de sedimentação mais elevada nas superficies horizontais que acaba por sufocar organismos filtradores.
iv O registo das comunidades bentónicas foi feito usando video-transectos em mergulho. Um estudo preliminar feito num dos naufrágios indicou que era necessário realizar no mínimo três transectos para amostrar a diversidade dos recifes , embora tenham sido feitos mais transectos em alguns locais de estudo. No total foram feitos 16 transectos nos quarto naufrágios, seis num, quarto noutro e três nos dois restantes. Cada recife natural foi amostrado com três transectos. Os dados foram divididos em duas bases de dados: uma com a densidade de organismos (número de invidíduos por metro quatrado) e a outra com percentagem de cobertura de animais incrustantes e algas. As hipóteses foram testadas através de análises de variâncias multivariadas (PERMANOVA). Os resultados significativos foram analisados recorrendo a NMDS e análises SIMPER.
No geral, as análises de densidades mostraram resultados mais claros do que as análises de percentagem de cobertura. Os naufrágios da costa portuguesa aqui analisados têm na maioria dos casos comunidades bentónicas semelhantes. Os únicos significativamente diferentes foram o River Gurara e o Oliveira e Carmo. Estas diferenças estão provavelmente relacionadas com as diferentes idades dos naufrágios. Naufrágios podem ser habitats semelhantes a ilhas, em que a biodiversidade aumenta durante os primeiros anos até ao máximo possível dado o ambiente local. A partir deste ponto a colonização de novas espécies continua a acontecer, mas através de um equilíbrio dinâmico no qual algumas espécies se extinguem enquanto novas espécies aparecem. Factores como distúrbios físicos, relacionados com pesca de arrasto por exemplo, também podem contribuir para uma atenuação das diferenças entre o resto dos barcos.
Em alguns dos casos, os naufrágios têm comunidades semelhantes às dos recifes naturais da área. No geral, 40% da biodiversidade dos naufrágios não está presente nos recifes naturais locais, o que permite explorar a hipótese de que naufrágios são habitats disponíveis para serem colonizados por espécies que não ocorrem nos recifes naturais locais, levando a um aumento de biodiversidade local. Naufrágios mais antigos têm comunidades mais semelhantes às naturais. Comparativamente, o naufrágio mais antigo (99 anos) tem 44% de espécies em comum com o recife rochoso amostrado, enquanto o naufrágio mais recente (4 anos) só tem 20% em comum com o recife natural. Na maioria dos casos, os testes mostraram diferenças significativas entre naufrágios e recifes rochosos.
Na comparação entre as comunidades bentónicas presentes em estruturas verticais e horizontais dos naufrágios, houve algumas diferenças, principalmente nas percentagens de
v cobertura mas sem um padrão de segregação biológica aparente. Esta semelhança estará provavelmente relacionada com o facto de as estruturas verticais e horizontais não terem uma extensão suficientemente grande para permitir o desenvolvimento de grupos de organismos diferentes. Na comparação entre os lados expostos e protegidos das correntes, a ausência de diferenças entre lados expostos e protegidos pode dever-se a uma colonização homogénea em todo o naufrágio sem uma zonação provocada pelas correntes, ou a uma suposição errada de haver um lado do navio mais exposto que outro.
As estruturas intactas dos naufrágios albergam muito mais biodiversidade que as partes fragmentadas dos barcos, o que pode ser um indicador de que naufrágios intactos e em boas condições albergam comunidades mais diversas e consequentemente mais saudáveis.
Uma das conclusões mais importantes desta tese foi a criação de um “catálogo” das espécies que se podem encontrar nos naufrágios da costa portuguesa. Este catálogo estará disponível online para que possa ser consultado pelo público em geral e referenciado pela comunidade científica em futuros estudos sobre colonização em recifes artificiais. Além da informação já recolhida, deu-se início ao desenvolvimento de um projecto (Project Baseline) com base em mergulhadores recreativos voluntários que se disponibilizarão a desenvolver um registo fotográfico contínuo destes naufrágios ao longo do tempo, permitindo um estudo sobre colonização a longo prazo e também com o objectivo de chamar a atenção da comunidade não científica para a importância destes naufrágios.
Palavras Chave: Recifes Artificiais; recifes naturais; biodiversidade macrobentónica; video-transectos
vi Index AGRADECIMENTOS ... i Abstract ... ii Resumo ... iii Index ... vi
Figure Index ... viii
Table Index ... x
1. Introduction ... 1
1.1 Overview – Shipwrecks and Artificial Reefs ... 1
1.2 Impacts of Artificial Reefs ... 2
1.3 Colonization of Artificial Reefs ... 3
1.4 Exposure to Currents ... 4
1.5 Surface Inclination ... 4
1.6 Objectives ... 5
2. Materials and Methods ... 6
2.1 Sampling Locations ... 6
2.1.1 Sesimbra ... 7
2.1.1 Algarve... 7
2.2 Data collection ... 8
2.3 Data Analysis ... 9
2.3.1 Comparing shipwrecks communities ... 10
2.3.2 Comparing shipwrecks with natural rocky reefs ... 11
2.3.3 Zonation within shipwrecks ... 12
2.4 Pilot Study ... 12
3. Results ... 15
3.1 Comparison between shipwrecks ... 15
3.1.1 Comparing shipwrecks communities ... 15
3.1.2 Comparing shipwrecks with natural rocky reefs ... 19
3.1.3 Zonation within shipwrecks ... 23
4. Discussion ... 31
4.1 Comparing shipwreck communities... 31
4.2 Comparing shipwrecks with natural rocky reefs ... 34
4.3 Zonation within shipwrecks ... 37
vii References ... 41 Appendixes ... 49
viii
Figure Index
Figure 1 - Map of the sampling sites, 1 – River Gurara and Paredes do Cabo; 2 – Torvore and Falésia; 3 – Oliveira e Carmo and Ponta da Piedade; 4 – Titan and Pedra da Cacela. ... 6 Figure 2 - Species accumulation curves for River Gurara. Top left: number of new species per minute of video (individually counted organisms); Top right: number of new species per minute of video (incrusting organisms and algae); Bottom right: number of new species per minute of video (individually counted organisms) in the port side; Bottom right: number of new species per minute of video (individually counted organisms) in the starboard side. ... 13 Figure 3 - Species accumulation curves for Paredes do Cabo. Top: number of new species per minute of video (non-colonial organisms); Bottom: number of new species per minute of video (incrusting organisms and algae). ... 14 Figure 4 - Index of taxonomic distinctness. Lines indicate average and 95% confidence interval. ... 17 Figure 5 - On top: NMDS on the Bray–Curtis square-root-transformed densities of benthic organisms in all of the Shipwrecks; On the bottom: NMDS on the Bray–Curtis square-root-transformed percent cover of benthic organisms in all of the shipwrecks. ... 18 Figure 6 - NMDS on the Bray–Curtis square-root-transformed densities of benthic organisms in all the shipwrecks and adjacent rocky reefs. ... 21 Figure 7 - On top: NMDS on the Bray–Curtis square-root-transformed densities of benthic organisms in River Gurara and Paredes do Cabo; On the bottom: NMDS on the Bray–Curtis square-root-transformed densities of benthic organisms in Oliveira e Carmo and Ponta da Piedade. ... 22 Figure 8 - On the top left: NMDS on the Bray–Curtis square-root-transformed percent covers of benthic organisms in Oliveira e Carmo and Ponta da Piedade; On the top right: NMDS on the Bray–Curtis square-root-transformed percent cover of benthic organisms in Torvore and Falésia (the figure is unclear about the number of samples because they are overlapped; Torvore was sampled with 31 snapshots and Falésia with 29); On the bottom left: NMDS on the Bray-Curtis square-root-transformed percent cover of benthic organisms in Titan and Pedra da Cacela; On the bottom right: NMDS on the Bray-Curtis square-root-transformed percent cover of benthic organisms in River Gurara and Paredes do Cabo. ... 23 Figure 9 - NMDS on the Bray–Curtis square-root-transformed densities of benthic organisms on intact and fragmented structures in River Gurara. ... 25
ix
Figure 10 - On top: NMDS on the Bray–Curtis square-root-transformed percent cover of benthic organisms on intact and fragmented structures in River Gurara. On the bottom: NMDS on the Bray–Curtis square-root-transformed percent cover benthic organisms on intact and fragmented structures in Torvore. ... 25 Figure 11 - On top: NMDS on the Bray–Curtis square-root-transformed percent cover of benthic organisms on the exposed and protected sides of River Gurara. On the bottom: NMDS on the Bray–Curtis square-root-transformed percent cover benthic organisms on the exposed and protected sides of Titan. ... 27 Figure 12 - NMDS on the Bray–Curtis square-root-transformed densities of benthic organisms in horizontal and vertical sructures of Oliveira e Carmo. ... 29 Figure 13 - On top: NMDS on the Bray–Curtis square-root-transformed percent cover of benthic organisms vertical and horizontal surfaces of River Gurara; In the middle: NMDS on the Bray–Curtis square-root-transformed percent cover of benthic organisms vertical and horizontal surfaces of Titan; On the bottom: NMDS on the Bray-Curtis square-root-transformed percent cover of benthic organisms in vertical and horizontal surfaces in Torvore. ... 30 Figure 14 - The best represented taxonomical groups in the shipwrecks (from top to bottom, left to right): Mytilidae, Scorpaena sp., Holothuria sp., Aiptasia mutabilis, Gorgoniidae e Actinothoe sphyrodeta. ... 32
x
Table Index
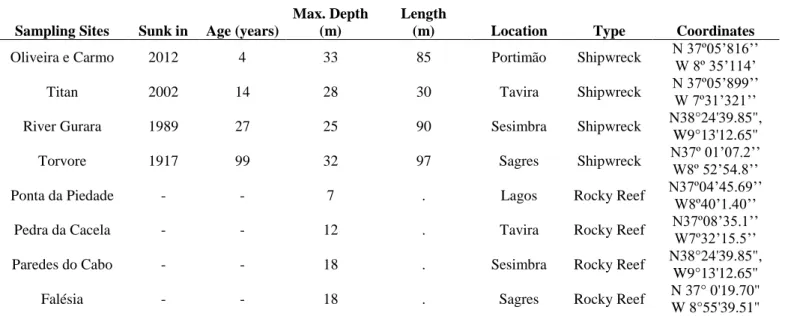
Table 1 - List of sampling sites, with the date of the sinking, the age of the shipwrecks, the maximum depth of each site, their location and coordinates. ... 6 Table 2 - List of the number of snapshots used for percent cover analysis per site ... 10 Table 3 - List of the all the taxa mean densities (individual per m2) sampled in the shipwrecks... 16 Table 4 - PERMANOVA pairwise test based on a Bray–Curtis similarity matrix of square-root transformed benthic organisms densities... 18 Table 5 - PERMANOVA pairwise test based on a Bray–Curtis similarity matrix of square-root transformed benthic percent covers. ... 18 Table 6 - List of the all the taxa mean densities (individual per m2) sampled in the rocky reefs. ... 20 Table 7 - PERMANOVA tests based on a Bray–Curtis similarity matrix of square-root transformed benthic organisms densities in shipwrecks and in the adjacent rocky reefs. ... 20 Table 8 - PERMANOVA tests based on a Bray–Curtis similarity matrix of square-root transformed percent cover organisms densities in shipwrecks and in the adjacent rocky reefs. ... 21 Table 9 - PERMANOVA tests based on a Bray–Curtis similarity matrix of square-root transformed benthic organisms densities in intact and fragmented structures in River Gurara and Torvore. ... 24 Table 10 - PERMANOVA tests based on a Bray–Curtis similarity matrix of square-root transformed benthic organisms percent cover in intact and fragmented structures in River Gurara and Torvore. ... 24 Table 11 - PERMANOVA tests based on a Bray–Curtis similarity matrix of square-root transformed percent cover of benthic organisms in the exposed and protected sides of the shipwrecks... 26 Table 12 - PERMANOVA tests based on a Bray–Curtis similarity matrix of square-root transformed benthic organisms densities in vertical and horizontal surfaces in each shipwreck. ... 28 Table 13 - PERMANOVA tests based on a Bray–Curtis similarity matrix of square-root transformed benthic organisms percent cover in vertical and horizontal surfaces in each shipwreck. ... 28 Table 14 - Density of the taxa found exclusively in shipwrecks ... 35
1
1. Introduction
1.1 Overview – Shipwrecks and Artificial Reefs
Shipwrecks represent the most charismatic and valued type of artificial reef structures for SCUBA divers (Blout, 1981; Stolk et al. 2005), which frequently associate artificial reefs specifically with shipwrecks. A general definition for artificial reefs is that they are man-made structures placed on the sea bottom, including a variety of structures that goes from sunken vessels to specially designed structures of limestone, steel, and concrete, built to become long lasting artificial reefs. Most SCUBA divers are aware that artificial reefs are structures that provide habitat for marine populations (Stolk et al. 2005), and some are known to sustain even more density and variety of biota than natural reefs in the area (Clark and Edwards, 1999; Diamant et al. 1986; Wilhelmsson et al. 1998).
Recreational SCUBA diving is usually considered a marine ecotouristic activity, representing just a small part of the greater anthropogenic impact on the marine environment, and at a certain point it was possibly the fastest growing recreation activity in the world (Dignam, 1990; Orams, 1999; Tabata, 1992), with a constant growth in the number of operators and participants. There is some evidence that points out the inappropriate divers behaviour and the high volume of dives as a stress factor for marine flora and fauna (Davis and Tisdell, 1995; Harriott et al. 1997; Hawkins and Roberts, 1993; Medio et al., 1997). Artificial reefs come into place here as an alternative diving site, removing the pressure from the natural reefs (Polak and Shashar, 2012).
In Europe, artificial reefs started being placed in the bottom of the sea during the second half of the 1900s and since then multiple types of structures have been sunken by several countries, most of which in the Mediterranean Sea (Jensen, 2002). Across different countries, artificial reefs have the purpose of contributing to fisheries management, prevent trawling, protect coastal habitats (Baine, 2001) and develop touristic activities related with the diving industry (Stolk et al. 2009). By 2011, Europe had 3422 artificial reefs deployed (Fabi et al. 2011).
In Portugal the largest artificial reef project was responsibility of IPMA (Instituto Português do Mar e da Atmosfera). They developed an artificial reef complex with an estimated area of influence of 70 km2, implemented in southern Portugal in 1990. Two pilot artificial reefs were installed to assess the environmental impact and fishing yields of the reef as well as its usefulness for managing fish stocks and increasing coastal resources. After this pilot project,
2 artificial reefs were recognized as a tool for the integrated management of coastal areas in Portugal (Santos 1997). Five larger artificial reefs were deployed in the same area between 1998 and 2010, making it one of the largest reef system in Europe (Fabi et al. 2011). Between 2012 and 2013 there was a private initiative to sink four warships in the south coast to create new diving sites. The area is named Ocean Revival Park and the warships rest on the bottom of the sea in the shores of Portimão, south Portugal. Other than these sunken concrete blocks and vessels, there are multiple structures along the whole Portuguese shore that have created artificial reef habitats (vessels, cranes and bombers). Lists and descriptions of these artificial reefs can be found in diving centers websites (Subnauta, Haliotis and Submania), as they are usually used as diving sites.
1.2 Impacts of Artificial Reefs
The impact that an artificial reef has on its surrounding ecosystem depends, amongst others, on its durability. The durability of artificial structures depends on their overall condition: not becoming buried by sediment in the seabed and/or not being severely damaged by hydrodynamic forces and corrosion over time are key to maintain structures in good condition. Naturally, the type of material used for the construction of artificial reef structures also influences its durability. However, in the particular case of shipwrecks, their “lifespan” depends substantially on the hydrodynamic forces of the region and on the assemblages that live on it. For example, fouling organisms prevent direct exposure of steel to seawater, therefore enhancing even further the durability of the structure (Gabriele et al., 1999; Sun et al., 2003).
Other than the durability of the structure, the amount of time it takes for an artificial reef to reach the same level of biodiversity as the natural habitats in that area should also been taken into consideration (Dunford et al. 2004). Even though artificial reefs have been frequently used as a compensatory tool for marine habitat loss (Seaman 2007), previous research showed that young reefs cannot actually provide biodiversity levels and assemblage structures similar to the ones from natural reefs (Walker et al. 2007, Simon et al. 2013). Other studies indicate that the period of time until biodiversity levels on the artificial reef became similar to the ones on the natural reef can be between eight and 25 years (Burt et al. 2011; Perkol-Finkel et al. 2006). Comparing artificial with natural reefs is important in order to assess the performance of the artificial reefs, but this comparative analysis is complicated due to differences in reef size, heterogeneity, age and degree of isolation (Svane and Petersen, 2001). The lack of research comparing biodiversity between older artificial and natural
3 habitats makes it very hard to predict the effectiveness of this frequent compensatory measure for habitat loss.
Several case studies point to a positive effect of artificial reefs in biodiversity increase and conservation (e.g., Marzialetti et al. 2002; Ponti et al. 2002), but that is not always the case. Artificial reef deployment without proper planning may have negative impacts. These impacts include changes in hydrodynamic forces and consequent alteration in the distribution of sediment and biological communities, as well as changes of benthic settlement patterns in the area (Gonçalves et al. 2007; Danovaro et al. 2002). The presence of artificial reefs or even just the proximity to one may impact the soft-bottom sediment benthic assemblages living in that area. It also can modify the distribution and composition of the available food sources and even the biological interactions between different parts of the food web (Danovaro et al. 2002). Negative impacts may also include some types of pollution, such as ecosystem exposure to chemical contaminants that resulted from leeching of the artificial reef structures, especially due to lack of planning such as in the case of a shipwreck, or the degradation and fragmentation of the structure itself, due to lack of robustness, causing damage to sensitive ecosystems (OSPAR Commission 2008).
1.3 Colonization of Artificial Reefs
Colonization of new marine habitats generally happens through the dispersal and settlement of larvae and spores (Roberts et al.1997). It depends on various factors such as the structure age (Nicoletti et al. 2007; Relini et al. 1994), depth and light availability (Relini et al. 1994), slope (Knott et al. 2004; Boaventura et al. 2006), rates of sedimentation and orientation of the reef in relation to prevailing currents (Baynes and Szmant 1989). Overall, barnacles, polychaetes, bivalves, hydroids and bryozoans are known to be pioneer species, quickly occupying the majority of the available area of a new habitat (Ardizzone et al. 1989; Bailey-Brock 1989; Relini et al. 1994; Hatcher 1998; Boaventura et al. 2006; Moura et al. 2006). Authors have shown changes in pioneering species abundance over time, given the colonization of more competitive species. For example, barnacle abundance is expected to decrease due to the colonization of sponges that are generally slower to recruit to new habitats (Thanner et al. 2006). These more competitive species are usually slow-growing and long-lived, appearing frequently during the later stages of community succession (Bailey-Brock 1989; Boaventura et al. 2006). However, once established (after at least 5 years), they can dominate artificial reefs (Thanner et al. 2006).
4 Predicting long-term colonization patterns on artificial reef structures is challenging due to the influence and interaction of many environmental and biological variables. Yet, some studies point to differences between young shipwreck communities, when compared with local natural reef communities. For example, solitary species such as barnacles and bivalves has been found to dominate in recently sunken shipwrecks (Walker et al. 2007). Over the long-term, one study found that the development of the benthic community in the new (artificial) substratum was composed by five distinctive phases (Nicoletti et al. 2007): 1) recruitment of Pioneer species (during the first month); 2) mussel (Mytilus galloprovincialis) dominance in the first two years; 3) regression of mussels on the third and fourth years; 4) absence of mussels in ten years’ time, and 5) dominance of Bryozoans bioconstruction twenty years after the artificial reef deployment.
1.4 Exposure to Currents
Currents and wave action are known to influence the colonization of artificial habitats (Grove and Sonu, 1985), because currents carry nutrients, organic matter and planktonic larvae across artificial reefs, and remove sediment from the structures (McAllister 1981; Baynes and Szmant 1989) enabling further settlement of spores and larvae. It has been observed that artificial reefs that are perpendicular to prevailing currents are more productive, and that currents influence growth forms, abundance and diversity of corals (Mathews, 1981; Roberts et al. 1981; Done, 1983). Even zones with strong currents and high turbulence allow the growth of healthy communities of corals (Roberts et al. 1997). A previous study (Baynes and Szmant 1989) suggested that to increase benthic growth on an artificial habitat, a maximization of the surface area exposed to laminar current flow and of the vertical surfaces would be necessary.
1.5 Surface Inclination
Surface inclination can influence the development of benthic communities because of its impact on sedimentation rates and on light exposure (Sebens 1986; Glasby 2001; Irving & Connell 2002). The accumulation of sediments is usually higher on horizontal surfaces, increasing the possibility of smothering sessile organisms (Baynes & Szmant 1989) and preventing effective settlement of recruits. Horizontal surfaces are also more exposed to light than vertical surfaces (Brakel 1929). Light can influence epibenthic organism abundance in different ways: 1) many sessile invertebrate larvae display photonegative behavior immediately before settlement, showing a preference to settle on shaded substrate (Dybernm 1962; Thorsonm 1962; Olson, 1983); 2) different light intensities might indirectly harm an
5 organism by benefiting its competitors; 3) low light intensities can be stressful for photosynthetic organisms.
1.6 Objectives
There have been studies along the Portuguese coastline regarding natural reefs (Gonçalves et al. 2008; Boavida et al. 2016 a, b) and artificial reefs (Santos et al. 2005; Moura et al. 2006), but only one on one of the shipwrecks (Coelho et a. 2012). Through the use of videos to sample biodiversity, this thesis was the first survey to characterize the macrobenthic community on Portuguese shipwrecks along the continental coastline between Sesimbra and Tavira. Rocky reefs located close to the shipwrecks were sampled to assess if wrecks and natural reefs support similar assemblages and to try to ascertain the source populations responsible for the colonization of the shipwrecks.
The main purpose of this study was to create a biodiversity “baseline” database which could be used as a reference for studies on the colonization of artificial habitats, and to gather knowledge which could allow for proper planning of deployment and management of artificial structure projects. Four shipwrecks were sampled along the Portuguese west and south coasts and the expectations were that: 1) Macrobenthic communities should differ between shipwrecks, with differences related to their different ages and locations; 2) Biodiversity should increase with the shipwrecks age due to the more advanced state of succession in the colonization process; 3) Shipwrecks older than eight years should have communities similar to the ones on natural rocky reefs; 4) The intact parts of a shipwreck should harbour more biodiversity than the degraded parts; 5) The shipwreck side more exposed to the sea currents should have more biodiversity; 6) Vertical surfaces in the shipwrecks should have more biodiversity than the horizontal surfaces, due to smothering of filtering organisms by sediment deposition on the horizontal surfaces.
6
2. Materials and Methods 2.1 Sampling Locations
There are two distinct sampling regions, both belonging to the Portuguese continental coast. One on the West coast, in Sesimbra, while the other sampling region is the South coast, Algarve (Figure 1 locates the four sampling locations in the coastline). The list of sampled shipwrecks, natural rocky reefs and respective information can be consulted in Table 1.
Figure 1 - Map of the sampling sites, 1 – River Gurara and Paredes do Cabo; 2 – Torvore and Falésia; 3 –
Oliveira e Carmo and Ponta da Piedade; 4 – Titan and Pedra da Cacela.
Table 1 - List of sampling sites, with the date of the sinking, the age of the shipwrecks, the maximum depth of
each site, their location and coordinates.
Sampling Sites Sunk in Age (years)
Max. Depth (m)
Length
(m) Location Type Coordinates
Oliveira e Carmo 2012 4 33 85 Portimão Shipwreck N 37º05’816’’
W 8º 35’114’
Titan 2002 14 28 30 Tavira Shipwreck N 37º05’899’’
W 7º31’321’’
River Gurara 1989 27 25 90 Sesimbra Shipwreck N38°24'39.85",
W9°13'12.65"
Torvore 1917 99 32 97 Sagres Shipwreck N37º 01’07.2’’
W8º 52’54.8’’ Ponta da Piedade - - 7 . Lagos Rocky Reef N37º04’45.69’’ W8º40’1.40’’
Pedra da Cacela - - 12 . Tavira Rocky Reef N37º08’35.1’’ W7º32’15.5’’
Paredes do Cabo - - 18 . Sesimbra Rocky Reef N38°24'39.85",
W9°13'12.65"
Falésia - - 18 . Sagres Rocky Reef N 37° 0'19.70"
7
2.1.1 Sesimbra
River Gurara and Paredes do Cabo are both inside the Prof. Luiz Saldanha Marine Park (in Parque Natural da Arrábida). This area has some unique features: it is located near the northern limit of one of the main upwelling systems in the North Atlantic (Wooster et al., 1976), and it is a biogeographic and oceanographic transition zone between warm and cold temperate waters, being protected from the North and Northwest winds by the Arrábida’s ridge (e.g. Gonçalves et al., 2002). Subtidal rocky reefs in this area are dominated by boulders originated from the erosion of the cliffs and by a bedrock with fissures and crevice, creating a complex diversity of macro and microhabitats (Horta e Costa et al. 2013).
The two sampling sites in Sesimbra were the stern of the shipwreck River Gurara and the rocky reef right next to it (0.6 km away), known as Paredes do Cabo. River Gurara was a Nigerian cargo motor vessel, 175 m long, which sunk and broke in half due to a storm in 1989, near Cape Espichel. It is partially destroyed, but it is still possible to navigate on the wreck and recognize the different parts of the ship. Paredes do Cabo, the name of the diving spot, refers to the rocky wall area of the cliff, with an average depth of 15 m.
2.1.1 Algarve
The continental shelf of the Portuguese South coastline encompasses an oceanographic transition zone due to the combined influence of the North Atlantic and Mediterranean currents, reason why the benthic fauna in this area is classified as Atlantic-Mediterranean. Some areas (i.e. Sagres) are known to be highly hydrodynamic, and this force can actually have an ecosystem structuring influence up to 10 m of depth (Dolbeth et al. 2007).
The sampling sites in the South Coast are Sagres, Portimão, Lagos and Tavira. Sagres is the western most part of Algarve, with a complex substrate, comprised mainly of boulders that are an extension from the land cliffs into the ocean, ending in a sandy seabed. Portimão and Lagos, between Sagres and Tavira, have much gentler slopes, with rocky reefs that present a low relief and are interspersed with patches of sediment (Boavida et al. 2016a) that varies between sandy and muddy. Tavira’s coastline is composed of sandy beaches, with a very gentle slope, low relief rocky reefs and a sandy seabed.
The two sampling sites in Sagres were Falésia, the rocky reef next to the cliff, and Torvore, a Norwegian steam ship that sunk during the First World War due to explosive charges, which is 4.34 km away from Falésia. Although very damaged, many parts of the structure are still easily recognizable. The shipwreck is at a depth between 28 and 32 m, set on a sandy and
8 muddy bottom. The rocky reef, Falésia, is a habitat relatively protected from waves, right next to the harbor, composed primarily by boulders, with a maximum depth around 18 m.
The two sampling sites in Portimão and Lagos were the Corvette Oliveira e Carmo (Portimão) and the rocky reef in Ponta da Piedade (Lagos), 9 km away. Oliveira e Carmo is an 85 m long ship that sunk in 2012, as part of the Ocean Revival Park (www.oceanrevival.org) and now rests in a 33 m deep muddy/sandy bottom with its full structure almost completely intact. Ponta da Piedade is a shallow had a maximum depth of 7 m.
The two sampling sites in Tavira were Titan and the rocky reef Lage da Cacela, 5.5 km away. Titan sunk in 2002, while placing concrete blocks of artificial reefs. It is still completely intact, 30 m long and 18 m wide and rests on a sandy bottom at 28 meters deep. Lage da Cacela has a maximum depth of 12 m, and is composed by several rocks completely surrounded by sand, with a main rock being very long and with a rift.
2.2 Data collection
The surveys were done using video-transects while SCUBA diving. Each transect was 30 m long and took on average 4 minutes to record. Even though the pilot study (described in section 2.4) allowed an estimation of the minimum number of transects needed to sample the species richness on each type of reef, the sampling ended up being opportunistic: if it was possible to do more than the minimum number of transects (three), depending on the amount of gas left or pn being able to go back to the site a second time, than more transects were made. River Gurara ended up being sampled with six transects, Oliveira e Carmo with four, Titan and Torvore with three. The rocky reefs were all sampled with three video-transects each. The system used for filming included cameras GoPro Hero 3 and 4, two lasers separated by 7.4 cm (projecting a light in the video which was used as scale) and a video light with 3600 lumens of intensity.
As it has been explained before, the same diver was responsible for the videos through all the dives, but the diving teams varied between two and three people along the sampling. At least one more diver was required to be present to ensure safety. The second (and third diver when present) were positioned behind the diver, so no sediment was lifted in a way which could affect the image of the video and the impact in benthic fishes and crustaceans was reduced (not “scaring” them off). During the dives of the pilot study, the support diver was responsible for laying a line, using a reel, so the transects were precisely 30 m. After several
9 dives, the swimming speed of the diver recording the videos became constant (7.5 meters per minute), and there was no need of laying the transect line from that point on. This was a big advantage because the task of laying the transect line underwater was very time consuming. Due to the lack of natural light at the shipwrecks depth, a lantern was used so all the videos were lit by an external light, which was positioned on an angle which allowed for the lightning of the whole vision field of the camera. The structures being filmed were not always leveled, so keeping a perfectly parallel positioning of the camera and the correct angle of the lantern required constant adjustments along the dive. When it was necessary to capture more details, the diver with the camera would stop and even go back if necessary.
2.3 Data Analysis
The underwater videos were viewed in Windows Media Players, without image editing. The data collected was divided in two distinctive databases. One database included taxa in which organisms or colonies could be individually counted, like gorgonians or sea stars. The other database included incrusting organisms like sponges and the algae morphological groups, which for most part could not be individually counted. Algae were not identified in taxa but in morphological groups (Steneck and Dethier, 1994) due to the difficulty of identifying in the videos smaller species or algae that occurred in large patches.
The data used for density analysis was counted directly from the videos into the database. Densities (number of individuals per m2) required an estimation of the sampled area, which was made using the laser lights. As it has been explained before, the lasers projected two light points into the video, which had a constant distance of 7.4 cm between each other. Using the same screenshots used for percent cover analysis (explained in the next paragraph), the average width of the area filmed was calculated using the software Coral Point Count with Excel extensions, and multiplied by the total length sampled in that site (number of transects x 30 m).
Percent cover was analyzed through a subsample of the videos. Systematic snapshots of the video-transects every 10 seconds, using GOM Player software. Only snapshots that corresponded to images completely parallel to the object (part of the wreck or rock) were used, therefore not all sites were sampled with the same number of snapshots (Table 2). The snapshots were then analyzed with CPCe (Coral Point Count with Excel extensions) to estimate the taxa percent cover.
10
Table 2 - List of the number of snapshots used for percent cover analysis per site
Sampling Sites Number of Snapshots
Oliveira e Carmo 32 Titan 31 River Gurara 95 Torvore 31 Ponta da Piedade 34 Pedra da Cacela 29 Paredes do Cabo 24 Falésia 30
2.3.1 Comparing shipwrecks communities
Diversity indexes were performed to allow a comparison between communities. The following were computed using BiodiversityR package in R: Shannon-Wienner, Simpson and the taxonomic distinctness index (Kindt et al. 2005). The taxonomic distinctness index, besides focusing on the distribution of abundances amongst species, also focuses on the taxonomic relatedness of species in the samples (Clark & Warwick 2001), unlike the Shannon-Wienner and Simpson indexes, which only consider the number of species present and their abundance (Clarke & Warwick, 2001). The taxonomic distinctness index is regarded as one of the most accurate indicators in biodiversity analyses (Clarke & Warwick, 2001).
Shannon-Wienner (H’) - It is based on the species abundances ratio, taking into account the evenness and the species richness, and pi is the ratio of individuals of the species i
Simpson index (D) – considers that biodiversity is inversely related with the probability of randomly finding two individuals of the same species. pi is the ratio of individuals of the species i:
Data was previously transformed with square-roots and converted to a Bray–Curtis similarity matrix. Data transformation is used frequently when the measured variable does not have a normal distribution or when there are different standard deviations in the different groups of samples. The square-root transformation is usually applied in situations involving counts.
11 Bray-Curtis index is generally used with abundance or count data (Greenacre and Primicerio, 2013). To test differences in benthic assemblages, a permutation multivariate ANOVA was performed (PERMANOVA with 9.999 permutations and α set at 0.008; Anderson, 2001), with pairwise comparison. The site was the only factor, which was fixed and had four levels. The α is set at 0.008 and not at 0.05 as it is commonly seen in ecology statistics due to the Bonferroni correction, in which the p-values are divided by the number of comparisons (Wright, 1992). For every PERMANOVA test with significant differences, an analysis of dispersion (PERMDISP) was made.
PERMANOVA significant results were further analyzed by NMDS (Nonmetric multidimensional scaling) and SIMPER (Similarity Percentages analysis), to determine which species have the biggest role in the dissimilarities between sites.
PERMANOVA is a non-parametric method for multivariate analysis of variance, widely used in ecology, which tests differences in the composition and relative abundances of species in samples. PERMANOVA is used in situations in which the simultaneous responses of potentially non-independent variables (usually abundances of species in an assemblage) have been measured (Anderson, 2001). NMDS is a flexible ordination technique which can be applied in multiple scenarios and it aims to represent the position of communities in multidimensional space, as way of easing the interpretation of the data. The SIMPER analysis assays the contribution of each species to the similarities or dissimilarities between groups. PERMANOVA, PERMDISP, NMDS and SIMPER were computed in PRIMER 6 with PERMANOVA+ (Anderson et al., 2008). Tables of all PERMDISP and SIMPER analysis can be found in the Appendixes.
The workflow was constant across all hypothesis testing: data transformations, similarity matrixes, multivariate testing and analysis of significant results were performed the same way as in the shipwrecks community comparisons.
2.3.2 Comparing shipwrecks with natural rocky reefs
The data was treated in a similar way as in the previous chapter (divided in two sets, one with densities and other with percent covers). Data was previously transformed with square-roots, and converted to a Bray–Curtis similarity matrix. To test differences between assemblages in shipwrecks and rocky reefs, several PERMANOVA were performed (9,999 permutations and α set at 0.05), one per shipwreck-reef pair. The reef type was the only factor, which was fixed
12 and had 2 levels (shipwreck or natural reef). PERMANOVA significant results were further analyzed by NMDS and SIMPER
2.3.3 Zonation within shipwrecks
The zonation (here defined as community differentiation between habitats with distinct characteristics) within the shipwrecks was tested through three fixed factors: integrity, protection and orientation. Integrity focused on the good condition of the wreck and had two levels, intact or fragmented. Protection was related with the exposure of the wreck to the sea currents, and its two levels were exposed or protected. Orientation was related with the structures of the wrecks, and its two levels were vertical and horizontal.
The data was treated in a similar way as in the two previous chapters. Data was previously transformed with square-roots, and converted to a Bray–Curtis similarity matrix. To test differences in benthic assemblages on the different zones within the same shipwreck (integrity, exposure and orientation), a permutation multivariate ANOVA was used (PERMANOVA with 9,999 permutations and a set at 0.05). Significant results were further analyzed by NMDS and SIMPER
2.4 Pilot Study
River Gurara and Paredes do Cabo were the first sites to be sampled so they could be used for a pilot study. The choice of sampling these sites first was opportunistic: they were the easiest to get to. The main purpose of this pilot study was to assess the appropriate sampling effort: the minimum number of video-transects needed to estimate species richness. It also had the purpose of refining some aspects of the method use to sample the macrobenthic assemblages (video-transects), like the adequate distance between the camera and the bottom while filming, the most appropriate swimming speed and the best position for the lantern. The third purpose was to attempt to do a preliminary assessment of the factors with a possible impact in structuring the communities.
This preliminary analysis lead to a few species accumulation curves (Figure 2 and 3). These accumulation curves show the number of new taxa sampled per minute of video. Overall, three transects (12 minutes of video in total) were enough to sample the species richness in the shipwreck, considering that each transect had a length of 30 meters and took an average of 4 minutes to record. There was a necessity of a higher sampling effort on the port side of River, likely related with two factors: the position of the shipwreck, which exposes more the
13 port side to the sea currents, and the difference of integrity between sides (the port side has many more structures still completely intact than the starboard side). In this case and for the rest of the shipwrecks in the study, we considered that the side of the shipwreck facing the coastline was more protected from the sea currents, while the side facing the open ocean was more exposed. The species accumulation curves for the port and starboard sides indicate that 8 minutes (two transects) were enough to sample most of the biodiversity on the port side, and four minutes (one transect) was enough to sample the starboard side. For Paredes, the natural reef, the minimum of minutes needed to sample most of the species richness is not clear, but 12 minutes (three transects) were estimated to be enough (Figure 3).
Something to consider is that the average of minutes per transect depends on the diver performing the video-transects: different divers will have different speeds. All the dives in this project were done with the same diver being responsible for recording the video-transects, to ensure their comparability. If this is not the case, then the species accumulation curves should relate the number of new taxa per transect and not per minute of video.
Figure 2 - Species accumulation curves for River Gurara showing the number of new species per minute of
video. Top left: individually counted organisms; Top right: incrusting organisms and algae; Bottom right: individually counted organisms in the port side; Bottom right: individually counted organisms in the starboard side.
14
Figure 3 - Species accumulation curves for Paredes do Cabo showing the number of new species per minute of
15
3. Results
3.1 Comparison between shipwrecks 3.1.1 Comparing shipwrecks communities
The survey of the four shipwrecks recorded a total of 30 taxa (Table 3 does not include the taxa analyzed through percent cover, Bryozoa, Cnidaria, Porifera and Balanidae) and six morphological groups of algae (corticated foliose, corticated macrophytes, crustose, filamentous, foliose algae, leathery macrophytes), during approximately 68 minutes of video and 126 snapshots. The shipwrecks had very similar values for alpha diversity (a variation from 11 to nine taxa), and the highest number of algae morphological functional groups was recorded in River Gurara, followed by Titan, Torvore and Oliveira e Carmo. The best represented taxa groups were Aiptasia mutabilis, Actinothoe sphyrodeta, Gorgoniidae, Holothuria sp., Mytilidae and Scorpaena sp. (Figure 14).
The various diversity indexes estimated do not present consistent results. The taxonomic distinctness index (∆+) indicated that all samples are within the 95% confidence interval (Figure 3). The highest taxonomic distinctness was observed in Oliveira e Carmo (92.84), followed by River Gurara (90.38), Torvore (90.32) and Titan (77.09). Other indexes (Shannon and Simpson) indicate that River has the most diverse community (1.76 and 0.79), followed by Torvore (1.14 and 0.59), Oliveira (0.35 and 0.17) and in the end, Titan (0.22 and 0.07).
16
Table 3 - List of the all the taxa mean densities (individual per m2) sampled in the shipwrecks. Gorgoniidae and
Holothuria sp. are in bold because the densities were estimated at this level, but in some cases it was possible to
identify at specie and genus level, therefore they are listed bellow but without a density value.
Taxa Filo Torvore
River
Gurara Titan
Oliveira e Carmo
Actinopterygii spp. 1 Chordata 0 0 0 0.01
Actinothoe sphyrodeta Cnidaria 0 0.34 59.57 2.91
Aiptasia mutabilis Cnidaria 0 0.22 0.53 0
Alcyonium sp. Cnidaria 0 0.02 0 0
Alicia mirabilis Cnidaria 0 0.02 0.02 0.01
Ascidiacea sp. Chordata 0 0.07 0.09 0
Cancer pagurus Arthropoda 0 0 0.02 0
Cerianthus membranaceus Cnidaria 0.11 0 0 0
Conger conger Chordata 0.07 0 0.02 0
Diaphorodoris luteocincta Mollusca 0 0.01 0 0
Echinaster (Echinaster) sepositus Echinodermata 0.23 0 0 0 Felimare sp. Mollusca 0 0.01 0 0 Gobius spp. 1 Chordata 0 0.02 0 0 Gorgoniidae Cnidaria 1.75 0.31 1.19 0.03 Eunicella spp. 1 - - - - - Eunicella spp. 2 - - - - - Leptogorgia Sarmentosa - - - - - Holothuria sp. Echinodermata 1.47 0.30 0 0 Holothuria arguinensis - - - - - Holothuria forskali - - - - - Holothuria mamata - - - - -
Marthasterias glacialis Echinodermata 0.08 0 0 0.01
Mytilidae Mollusca 0 0 0 31.52
Palinurus elephas Arthropoda 0.06 0 0 0
Parablennius gattorugine Chordata 0 0 0 0.01
Parablennius pilicornis Chordata 0 0 0.02 0
Parablennius sp. Chordata 0 0 0.04 0.06
Parablennius spp. 1 - - - - -
Parablennius spp. 2 - - - - -
Paracentrotus lividus Echinodermata 0 0 0 0.03
Paramuricea clavata Cnidaria 0.06 0 0 0
Scorpaena notata Chordata 0 0 0.02 0
Scorpaena sp. Chordata 0.09 0 0.57 0.16
17
Figure 4 - Index of taxonomic distinctness. Lines indicate average and 95% confidence interval.
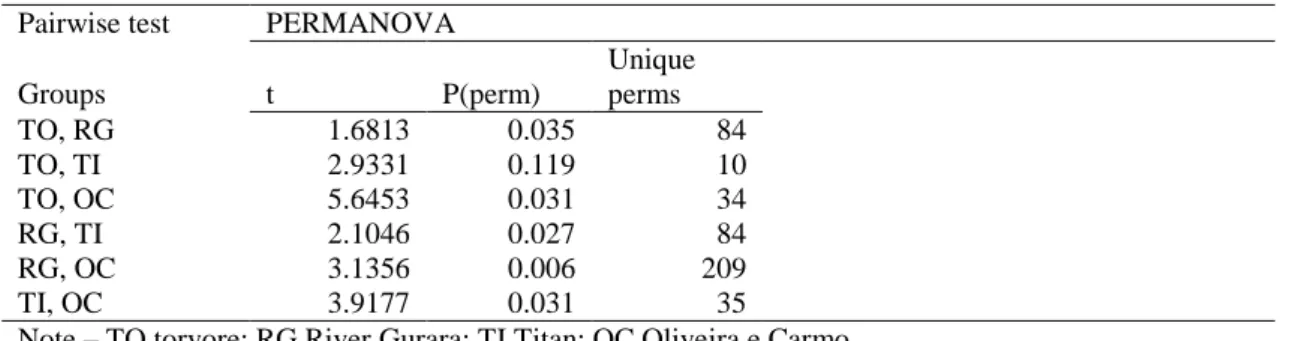
Only two shipwrecks had densities significantly different from each other: River Gurara and Oliveira e Carmo (P = 0.006). The remaining shipwrecks had no significant differences between them (P > 0.008; Table 4). The NMDS showed an Oliveira community very distant from the rest: transects are isolated from all the others, showing a distinctive community. River Gurara transects are by far the most disperse in the figure, showing a higher diversity than in any other wreck (Figure 3). The SIMPER analysis showed that the taxa most responsible for differences between the two wrecks were Mytilidae, Actinothoe shyrodeta, Holothuria sp. and Gorgoniidae. The first two were more abundant in Oliveira e Carmo, and the second two on River Gurara. Tables for all SIMPER analyses are found in the Appendixes.
The four shipwrecks had percent covers significantly different from each other (P = 0.001) (Table 5). In this case and in multiple situations across all the results, PERMADISP suggested that the differences found by PERMANOVA were caused by a dispersion effect in the samples (when P > 0.05) (Appendixes Tables 24 to 40). However, in all of those cases, PERMANOVA should be robust to such an effect (Anderson, 2001; Anderson et al., 2008). The NMDS here suggests that Oliveira transects are slightly less isolated, but a differentiation between transects in all the shipwrecks is still obvious (Figure 5). The SIMPER analysis shows that hydroids and algae assemblages, crustose algae and Balanidae are consistently the taxa responsible for the differenciation between shipwrecks: the same assemblages are recorded across all shipwrecks, but their abundance varies considerably, setting the communities apart.
18
Table 4 - PERMANOVA pairwise test based on a Bray–Curtis similarity matrix of square-root transformed
benthic organisms densities. Pairwise test PERMANOVA
Groups t P(perm) Unique perms TO, RG 1.6813 0.035 84 TO, TI 2.9331 0.119 10 TO, OC 5.6453 0.031 34 RG, TI 2.1046 0.027 84 RG, OC 3.1356 0.006 209 TI, OC 3.9177 0.031 35
Note – TO torvore; RG River Gurara; TI Titan; OC Oliveira e Carmo
Table 5 - PERMANOVA pairwise test based on a Bray–Curtis similarity matrix of square-root transformed
benthic percent covers.
Pairwise test PERMANOVA
Groups t P(perm) Unique perms OC, RG 8.984 0.001 999 OC, TI 8.7072 0.001 997 OC, TO 9.4426 0.001 998 RG, TI 5.2794 0.001 999 RG, TO 2.0971 0.001 999 TI, TO 5.5216 0.001 999
Figure 5 - NMDS on the Bray–Curtis square-root-transformed data of benthic organisms in all of the
19
3.1.2 Comparing shipwrecks with natural rocky reefs
The survey of the four natural rocky reefs recorded a total of 24 taxa (Table 6) and seven morphological groups of algae, during approximately 55 minutes of video and 114 snapshots. From the 30 taxa sampled in the shipwrecks, 43% (13) were found in common with the rocky reefs.
The densities of benthic assemblages differed significantly between the oldest and youngest shipwrecks (River Gurara and Oliveira e Carmo) and their adjacent rocky reefs (P = 0.036; P = 0.024) (Table 7). The NMDS with data from all the wrecks and rocky reefs shows two clearly differentiated groups, with all wrecks assemblages being clearly separated from the rocky reefs (Figure 6). The NMDS of Oliveira e Carmo (the youngest wreck) and its nearby rocky reef shows a stronger differentiation between wreck and rocky reef than that of River Gurara (the oldest; Figure 7). The SIMPER analysis shows that Paracentrotus lividus, Actinothoe sphyrodeta, Gorgoniidae and Holothuria sp. are the taxa most responsible for the differences between River Gurara and its adjacent rocky reef. P. lividus is only present on the rocky reef. A. sphyrodeta, Gorgoniidae and Holothuria sp. were more abundant on the shipwreck. In Oliveira e Carmo, Mytilidae, Anemonia viridis, A. sphyrodeta and P. lividus were the main responsible for the differences between wreck and rocky reef. Mytilidae and A. sphyrodeta were much more abundant on the wreck, while P. lividus and A. viridis were more abundant on the rocky reef.
The percent cover of benthic assemblages differed significantly between all of the shipwrecks and the adjacent rocky reefs (PERMANOVA P = 0.001 for all) (Table 8). All NMDS suggest a clear differentiation between shipwrecks and rocky reefs (Figure 8). The SIMPER analysis shows that hydroids, algae assemblages and crustose algae are consistently the taxa responsible for most of the differences between shipwrecks and natural reefs, with hydroids and algae assemblages being constantly more abundant on the rocky reefs. The crustose algae are sometimes more abundant on the wrecks and other times more abundant in the rocky reefs.
20
Table 6 - List of the all the taxa mean densities (individual per m2) sampled in the rocky reefs.
Taxa
Paredes do Cabo
Pedra da
Cacela Falésia Ponta da Piedade
Actinothoe sphyrodeta 0 2.38 0 0 Aiptasia mutabilis 0 3.57 4.10 0 Anemonia viridis 0 2.55 0.17 4.84 Ascidiacea sp. 0 0 0.02 0 Blenniidae 0 0.02 0 0 Diaphorodoris luteocincta 0.03 0 0 0 Felimare sp. 0 0 0.02 0 Gobius auratus 0 0.02 0 0 Gobius xanthocephalus 0 0 0.02 0 Gorgoniidae 0 4.71 1.83 0 Gymnangium montagui 0 0 0.02 0 Holothuria sp. 0.20 0.02 0.53 0.67 Palinurus elephas 0 0 0.02 0 Parablennius pilicornis 0 0 0.02 0 Parablennius sp. 0 0.057 0 0.02 Paracentrotus lividus 1.90 2.52 0.075 1.23 Sabella spallanzanii 0 0.02 0 0 Sabellida 0 0.06 0 0 Serpula sp. 0 0.02 0 0 Scorpaena maderensis 0 0.02 0 0.02 Scorpaena porcus 0 0.15 0 0 Scorpaena sp. 0 0.08 0 0 Sphaerechinus granularis 0 2.12 0.21 0 Octopus vulgaris 0 0.02 0 0
Table 7 - PERMANOVA tests based on a Bray–Curtis similarity matrix of square-root transformed benthic
organisms densities in shipwrecks and in the adjacent rocky reefs.
Source PERMANOVA
df SS MS Pseudo-F P(perm) Unique
perms
Torvore vs Falésia
Type 1 5826.7 5826.7 6.1567 0.098 10
Residuals 4 3785.6 946.4
Total 5 9612.3
River Gurara vs Paredes do Cabo
Type 1 6760.6 5826.7 3.3882 0.036 28
Residuals 6 11972 946.4
Total 7 18733
Titan vs Pedra da Cacela
Type 1 5978.1 5978.1 6.1021 0.098 10
Residuals 4 3918.7 989.68
Total 5 9869.8
Oliveira e Carmo vs Ponta da Piedade
Type 1 15176 15176 31.946 0.024 35
Residuals 5 2375.3 475.07
21
Table 8 - PERMANOVA tests based on a Bray–Curtis similarity matrix of square-root transformed percent
cover organisms densities in shipwrecks and in the adjacent rocky reefs.
Source PERMANOVA
df SS MS Pseudo-F P(perm) Unique
perms
Torvore vs Falésia
Type 1 10705 10705 13.743 0.001 998
Residuals 59 45959 778.97
Total 60 56664
River Gurara vs Paredes do Cabo
Type 1 22721 22721 19.669 0.001 998
Residuals 54 62381 1155.2
Total 55 85102
Titan vs Pedra da Cacela
Type 1 51449 51449 53.546 0.001 999
Residuals 58 55728 960.83
Total 59 1.078x10⁵
Oliveira e Carmo vs Ponta da Piedade
Type 1 1.139x10⁵ 1.139x10⁵ 139.68 0.001 998
Residuals 72 587261.7265x105 815.64
Total 73
Figure 6 - NMDS on the Bray–Curtis square-root-transformed densities of benthic organisms in all the
22
Figure 7 - On top: NMDS on the Bray–Curtis square-root-transformed densities of benthic organisms in River
Gurara and Paredes do Cabo; On the bottom: NMDS on the Bray–Curtis square-root-transformed densities of benthic organisms in Oliveira e Carmo and Ponta da Piedade.
23
Figure 8 - On the top left: NMDS on the Bray–Curtis square-root-transformed percent covers of benthic
organisms in Oliveira e Carmo and Ponta da Piedade; On the top right: NMDS on the Bray–Curtis square-root-transformed percent cover of benthic organisms in Torvore and Falésia (the figure is unclear about the number of samples because they are overlapped; Torvore was sampled with 31 snapshots and Falésia with 29); On the bottom left: NMDS on the Bray-Curtis square-root-transformed percent cover of benthic organisms in Titan and Pedra da Cacela; On the bottom right: NMDS on the Bray-Curtis square-root-transformed percent cover of benthic organisms in River Gurara and Paredes do Cabo.
3.1.3 Zonation within shipwrecks Integrity
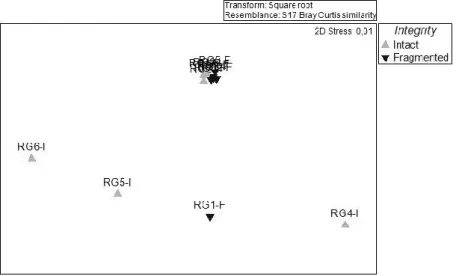
Benthic assemblage densities differed significantly between fragmented and intact structures in one of the shipwrecks (River Gurara, P =0.048) (Table 9). The NMDS shows the transects of the fragmented structures with very little differentiation, constituting just a small part of the total diversity that exists on the intact structures (Figure 9). The SIMPER analysis shows that Holothuria sp., Actinothoe sphyrodeta, Ascidiacea sp.and Gorgoniidae are responsible for most of the differences between intact and fragmented structures in River Gurara. Holothuria sp.and Ascidiacea sp. were more abundant on the fragmented parts of the shipwreck, while Actinothoe sphyrodeta and Gorgoniidae were more abundant on the intact parts.
24 The percent cover data of benthic assemblages were significantly different between intact and fragmented structures in both cases (River Gurara P = 0.001, Torvore P = 0.004) (Table 10). Both NMDS show some differentiation between fragmented and intact structures assemblages, but in Torvore the transects of the fragmented parts show a higher diversity than in Titan. Also, in both cases, the transects that sampled the fragmented parts of the wrecks seem to only have a fragment of the total diversity that can be found in the intact parts of the structure (Figure 10). The SIMPER analysis shows that Hydroids and algae assemblages and crustose algae still are the taxa responsible for most of the differences, and this will be constant along the protection and orientation analyses.
Table 9 - PERMANOVA tests based on a Bray–Curtis similarity matrix of square-root transformed benthic
organisms densities in intact and fragmented structures in River Gurara and Torvore.
Source PERMANOVA
df SS MS Pseudo-F P(perm) Unique
perms River Gurara Integrity 1 6831.7 6831.7 1.9809 0.048 114 Residuals 10 34487 3448.7 Total 11 41319 Torvore Integrity 1 703 703.77 0.73424 0.68 10 Residuals 4 3834 958.5 Total 5 4537.8
Table 10 - PERMANOVA tests based on a Bray–Curtis similarity matrix of square-root transformed benthic
organisms percent cover in intact and fragmented structures in River Gurara and Torvore.
Source PERMANOVA
df SS MS Pseudo-F P(perm) Unique
perms River Gurara Integrity 1 12633 12633 12.988 0.001 998 Residuals 29 28206 972.63 Total 30 40839 Torvore Integrity 1 5118.4 5118.4 6.3074 0.004 999 Residuals 29 23533 811.48 Total 30 28651
25
Figure 9 - NMDS on the Bray–Curtis square-root-transformed densities of benthic organisms on intact and
fragmented structures in River Gurara.
Figure 10 - On top: NMDS on the Bray–Curtis square-root-transformed percent cover of benthic organisms on
intact and fragmented structures in River Gurara. On the bottom: NMDS on the Bray–Curtis square-root-transformed percent cover benthic organisms on intact and fragmented structures in Torvore.
26
Protection
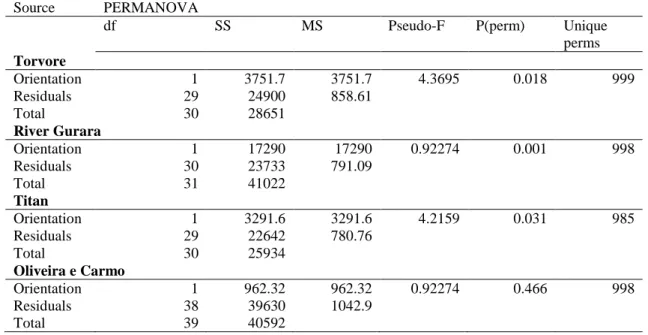
Benthic assemblages densities did not differ significantly between exposed and protected structures in any of the shipwrecks, but the percent cover differed significantly in two of the shipwrecks (P = 0.002 in River Gurara; P = 0.006 in Titan) (Table 11). The NMDS actually shows that exposed and protected transects do not have much differentiation, but with some observations being clearly apart from the rest of the group (Figure 11).
Table 11 - PERMANOVA tests based on a Bray–Curtis similarity matrix of square-root transformed percent
cover of benthic organisms in the exposed and protected sides of the shipwrecks.
Source PERMANOVA
df SS MS Pseudo-F P(perm) Unique
perms Torvore Protection 1 1759.3 1759.3 2.083 0.172 999 Residuals 28 23649 844.62 Total 29 25409 River Gurara Protection 1 11346 11346 11.47 0.002 999 Residuals 30 29677 989.22 Total 31 41022 Titan Protection 1 3348.1 2248.1 4.299 0.006 999 Residuals 29 22585 778.81 Total 30 25934 Oliveira e Carmo Protection 1 67057 670.57 0.62344 0.597 998 Residuals 37 39797 1975.6 Total 38 40468