Cellular/Molecular
Activation of Adenosine A
2A
Receptors Induces TrkB
Translocation and Increases BDNF-Mediated
Phospho-TrkB Localization in Lipid Rafts:
Implications for Neuromodulation
Nata´lia Assaife-Lopes,
1,2Vasco C. Sousa,
1,2Daniela B. Pereira,
3Joaquim A. Ribeiro,
1,2Moses V. Chao,
3and Ana M. Sebastia˜o
1,21Institute of Pharmacology and Neuroscience, Faculty of Medicine, and2Unit of Neuroscience, Institute of Molecular Medicine, University of Lisbon, 1649 – 028 Lisbon, Portugal, and3Molecular Neurobiology Program, Skirball Institute of Biomolecular Medicine, Department of Physiology and Neuroscience, New York University School of Medicine, New York, New York 10016
Brain-derived neurotrophic factor (BDNF) signaling is critical for neuronal development and transmission. Recruitment of TrkB
recep-tors to lipid rafts has been shown to be necessary for the activation of specific signaling pathways and modulation of neurotransmitter
release by BDNF. Since TrkB receptors are known to be modulated by adenosine A
2Areceptor activation, we hypothesized that activation
of A
2Areceptors could influence TrkB receptor localization among different membrane microdomains. We found that adenosine A
2Areceptor agonists increased the levels of TrkB receptors in the lipid raft fraction of cortical membranes and potentiated BDNF-induced
augmentation of phosphorylated TrkB levels in lipid rafts. Blockade of the clathrin-mediated endocytosis with monodansylcadaverine
(100
M) did not modify the effects of the A
2Areceptor agonists but significantly impaired BDNF effects on TrkB recruitment to lipid rafts.
The effect of A
2Areceptor activation in TrkB localization was mimicked by 5
Mforskolin, an adenylyl cyclase activator. Also, it was
blocked by the PKA inhibitors Rp-cAMPs and PKI-(14 –22), and by the Src-family kinase inhibitor PP2. Moreover, removal of
endoge-nous adenosine or disruption of lipid rafts reduced BDNF stimulatory effects on glutamate release from cortical synaptosomes.
Lipid raft integrity was also required for the effects of BDNF on hippocampal long-term potentiation at CA1 synapses. Our data
demonstrate, for the first time, a BDNF-independent recruitment of TrkB receptors to lipid rafts induced by activation of
adeno-sine A
2Areceptors, with functional consequences for TrkB phosphorylation and BDNF-induced modulation of neurotransmitter
release and hippocampal plasticity.
Introduction
The neurotrophin brain-derived neurotrophic factor (BDNF) is
essential in the regulation of neuronal survival and
differentia-tion. Abundant evidence has now established that BDNF is also
involved in the modulation of synaptic transmission and
plastic-ity (Poo, 2001; Chao, 2003). BDNF activates the TrkB tyrosine
kinase receptor and the p75 receptor, which belongs to the tumor
necrosis factor receptor family. We and others have reported that
TrkB receptor function is modulated by activation of adenosine
A
2Areceptors (Lee and Chao, 2001; Dio´genes et al., 2004;
Mojsilovic-Petrovic et al., 2006; Fontinha et al., 2008; Tebano et
al., 2008). This TrkB/A
2Areceptor cross talk has two
conse-quences, which may operate independently: (1) facilitation of
BDNF-induced actions on synaptic transmission and plasticity
by A
2Areceptor agonists; and (2) direct phosphorylation and
activation of TrkB receptors, in the absence of BDNF, a process
called transactivation. Notably, transactivation of TrkB receptors
usually requires longer exposure to A
2Aagonists than facilitation
of synaptic actions of BDNF.
Adenosine is an important modulator of the nervous system
that acts via activation of G-protein-coupled receptors A
1, A
2A,
A
2B, and A
3(Fredholm et al., 2003; Sebastiao and Ribeiro, 2009a).
Adenosine receptors are distributed widely in the nervous
sys-tem, where the high-affinity A
1and A
2Areceptors are responsible
for the fine tuning of neurotransmitter release and modulation of
other signaling molecules (Sebastiao and Ribeiro, 2009a).
Lipid rafts are cholesterol- and sphingolipid-rich membrane
microdomains that concentrate specific proteins and lipids.
Although protein affinity for these domains is not totally
under-Received Nov. 16, 2009; revised April 14, 2010; accepted April 22, 2010.
This work, N.A.L., V.C.S., and D.B.P. were supported by Fundac¸a˜o para a Cieˆncia e a Tecnologia (SFRH/BD/21374/ 2005 for N.A.L., SFRH/BD/21359/2005 for V.C.S., and SFRH/BPD/11528/2002 for D.B.P.) and by the European Union [European Cooperation in Science and Technology (COST) COST B30 concerted action, Neural Regeneration and Plasticity (NEREPLAS)]. We thank Regeneron Pharmaceuticals for the gift of brain-derived neurotrophic factor, the Institute of Physiology of the Faculty of Medicine of Lisbon for the animal house facility, Ana Rita Costenla for help with the long-term potentiation experiments, W. W. Anderson (University of Bristol, Bristol, UK) for the gift of the electrophysiology data analysis (long-term potentiation) program, and Cristina Casalou from Centro de Investigac¸a˜o em Patobiologia Molecular (CIPM), Instituto Português de Oncologia (IPO), for access to the ultracentrifuge.
Correspondence should be addressed to Ana M. Sebastia˜o, Institute of Pharmacology and Neuroscience, Institute of Molecular Medicine, Avenida Professor Egas Moniz, Edificio Egas Moniz, piso 1B, 1649-028 Lisbon, Portugal. E-mail: [email protected].
DOI:10.1523/JNEUROSCI.5695-09.2010
stood, it is known that palmitoylated, myristoylated, and
glycosylphosphatidylinositol-anchored proteins are enriched in
these domains (Simons and Toomre, 2000; Pike, 2003). Lipid
rafts have been implicated in the regulation of signal transduction
in multiple cell types, including neurons, by promoting close
proximity or segregation of signaling molecules (Fielding and
Fielding, 2004; Lim and Yin, 2005). There is now increasing
evi-dence that lipid rafts are essential for BDNF signaling, and both
TrkB and p75 receptors can be localized in these domains (Wu et
al., 1997; Higuchi et al., 2003; Suzuki et al., 2004). Translocation
of TrkB receptors to lipid rafts is regulated by BDNF, and is
required for its effects on glutamate release and synaptic fatigue
(Suzuki et al., 2004), and for activation of the phospholipase C
(PLC) pathway (Pereira and Chao, 2007).
In this work, we investigated whether adenosine A
2Areceptor
activation affects TrkB receptor localization in lipid rafts and how
BDNF actions on glutamate release and long-term potentiation
(LTP) are affected by removal of endogenous adenosine and
dis-ruption of lipid rafts. We show that A
2Areceptor activation
induced TrkB translocation and increased BDNF-induced
phospho-TrkB (pTrkB) receptors in lipid rafts. Moreover, our
results suggest that the mechanisms used by A
2Areceptor agonists
to induce TrkB translocation are different from those used by
BDNF, and involve cAMP and Src-family kinase activation.
Fi-nally, lipid raft disruption abolished the potentiating effects of
BDNF on glutamate release and LTP.
Materials and Methods
Materials. Cell culture media, Alexa Fluor 488-coupled goat anti-rabbit antibody and Alexa Fluor 594-coupled cholera toxin subunit B were obtained from Invitrogen. BDNF was a kind gift of Regeneron
Pharma-ceuticals. 4-[2-[[6-Amino-9-(N-ethyl-b-D
-ribofuranuronamidosyl)-9H-purin-2-yl]amino]ethyl]-benzene propanoic acid hydrochloride (CGS 21680), 4-(2-[7-amino-2-(2-furyl) [1,2,4]triazolo[2,3-a][1,3,5] triazin-5-ylamino]ethyl)phenol (ZM 241385), forskolin, 3-(4-chloro-phenyl)1-(1,1-dimethylethyl)-1H-pyrazolo[3,4-d]pyrimidin-4-amine (PP2), protein kinase inhibitor-(14 –22)-amide, myristoylated (PKI 14 –
22), and (5S,10R)-(
⫹)-5-methyl-10,11-dihydro-5H-dibenzo[a,d]cyclo-hepten-5,10-imine maleate (MK-801) were from Tocris Cookson. Adenosine deaminase (ADA; EC 3.5.4.4) was from Roche. Mouse anti-TrkB antibody was from BD Biosciences. Anti-phospho-Trk (pTyr-490) was from Cell Signaling Technology. Rabbit anti-TrkB antibody was from Millipore. The antibodies for Fyn and HRP-coupled anti-mouse and anti-rabbit secondary antibodies were from Santa Cruz
Biotechnol-ogy. [3H]ZM 241385 and ECL plus reagent were obtained from GE
Healthcare. Ultra Clear centrifuge tubes were from Beckman. Bradford reagent was from Bio-Rad. All other reagents were purchased from Sigma.
Neuronal cortical cultures. Cortical neurons were dissected from E18 Sprague Dawley embryos, obtained from Harlan Interfauna Iberica, as described previously (Pereira and Chao, 2007). Animals were handled according to the European Community guidelines and Portuguese law on animal care. Dissection was performed in cold HBSS medium supple-mented with 0.37% glucose under sterile conditions. The cortices were trypsinized for 15 min, centrifuged, and resuspended in MEM
supple-mented with 10% FBS, 2 mMglutamine, 1 mMsodium pyruvate, 0.37%
glucose, and 25 U/ml penicillin/streptomycin. Cells were dissociated, counted, and plated in poly-L-lysine-coated dishes at a density of 105
cells/cm2. On the following day, medium was changed to Neurobasal
medium supplemented with 0.5 mMglutamine, 2% B27, 25 U/ml
peni-cillin/streptomycin, and 25Mglutamate. On day in vitro (DIV) 4, half the medium was replaced by the above-mentioned solution (excepting glutamate) with 5-fluoro-2-deoxyuridine. On the day of the experiment, cells were starved for 4 h in MEM containing 0.37% glucose, 2 mM
glu-tamine, and 10MMK-801. Twenty nanomolar CGS21680 and 50 nM
ZM241385 were added for 30 min, followed by addition of 20 ng/ml
BDNF for 5 or 40 min, as indicated. Inhibitors were added 15 min before CGS 21680 and/or BDNF incubation and remained present until cell
lysis. Methyl--cyclodextrin (MCD) was the only exception, being
present only 15 min before incubation with CGS 21680.
Lipid raft isolation. Lipid rafts were isolated as described previously (Pereira and Chao, 2007). Briefly, cortical neurons (DIV 7–11) were lysed in TNE buffer (150 mMNaCl, 50 mMTris-HCl, pH 8.0, and 5 mMEDTA)
containing 0.5% Triton X-100, and supplemented with protease and
phosphatase inhibitors (2g/ml leupeptin, 2 g/ml aprotinin, 1 mM
sodium orthovanadate, 10 mMsodium fluoride, and 1 mM
phenylmeth-ylsulfonyl fluoride). After solubilization for at least 20 min at 4°C, the lysates were combined with a 60% Optiprep solution to yield a 35% Optiprep mixture. This solution was placed in the bottom of the ultra-centrifuge tube and overlaid with 8 ml of a 30% Optiprep solution in lysis buffer followed by 3 ml of lysis buffer. Samples were centrifuged for 6 h at 36,400 rpm in a Beckman XL-90 ultracentrifuge, using an SW41Ti rotor, at 4°C. After discarding the first 1 ml, eight fractions (from top to bot-tom) were collected and equal volumes of each fraction were applied in an 8% SDS-PAGE gel.
Immunocytochemistry. The protocol used has been previously de-scribed by Harder et al. (1998), with minor modifications. DIV 6 –7 cortical neurons were starved for 4 h before CGS 21680 (20 nM)
treat-ment for 30 min. Cortical neurons were then incubated with a rabbit anti-TrkB antibody (1:500) and Alexa Fluor 594-coupled cholera toxin
subunit B (2g/ml) for 1 h at 12°C in MEM with 50 mMHEPES and 2
mg/ml BSA, pH 7.3. Cells were washed and incubated with the Alexa Fluor 488-coupled anti-rabbit antibody for 45 min (1:300) under the same conditions. Fixation was done with 4% paraformaldehyde for 5 min followed by cold methanol for 5 min. Images were taken using a Zeiss LSM 510 confocal microscope and analyzed with the help of the ImageJ software. Copatching was quantified as the percentage of TrkB receptor clusters colocalized with GM1 patches. In each experiment, 10 cells per condition were analyzed.
Isolation of synaptosomes. The 3- to 5-week-old Wistar rats were de-capitated under halothane anesthesia, and synaptosomes were prepared as described previously (Canas et al., 2004). Briefly, the cortices were dissected in an ice-cold Krebs’ solution composed of (in mM) NaCl 124,
KCl 3, NaH2PO41.2, NaHCO325, MgSO41, CaCl22, and glucose 10,
that had been previously gassed with 95% O2and 5% CO2, pH 7.4. The
cortices were homogenized in an ice-cold isosmotic sucrose solution (0.32M, containing 1 mMEDTA, 1 mg/ml bovine serum albumin, and 10
mMHEPES, pH 7.4), and centrifuged at 3,000⫻ g for 10 min; the
super-natant was centrifuged again at 14,000⫻ g for 12 min. The whole proce-dure was conducted at 4°C. The pellet was resuspended in 45% Percoll in KHR solution consisting of (in mM) NaCl 140, EDTA 1, HEPES 10, KCl
5, and glucose 5, and was centrifuged at 14,000 rpm for 2 min. The synaptosomal fraction corresponds to the top buoyant layer and was collected from the tube. Percoll was removed by two washes with a KHR solution; synaptosomes were then kept on ice and used within 3 h.
Glutamate release from synaptosomes. Synaptosomes were resuspended in 2 ml of oxygenated Krebs’ medium and allowed to equilibrate for 5 min at 37°C. From this time onward, all solutions applied to the synap-tosomes were kept at 37°C and continuously gassed with 95% O2and 5%
CO2. Synaptosomes were loaded with 0.2M[3H] glutamate (specific
activity was 30 – 60 Ci/mmol) for 5 min and equally layered onto perfu-sion chambers over Whatman GF/C filters (flow rate, 0.6 ml/min;
cham-ber volume, 90l). In the cholesterol oxidase experiments, 2 U/ml
enzyme were incubated with the synaptosomes for 1 h at 37°C in oxygen-ated Krebs’ solution before glutamate incubation. After a 20 min wash-out period, samples were continuously collected for 40 min in 2 min intervals. A high-K⫹solution (15 mM, isomolar substitution of Na⫹by
K⫹in the Krebs’ solution) was added for 2 min in the 5th [first stimula-tion period (S1)] and 29th [second stimulation period (S2)] minutes to stimulate glutamate release. BDNF (20 ng/ml) was added from the ninth minute onward, and its effect was quantified as percentage changes of the S2/S1ratio compared with the S2/S1ratio in the absence of BDNF in the same synaptosomal batch and under similar drug conditions. The S2/S1
ratio was calculated as the area under the curve corresponding to the amount of tritium released due to S2over the amount of tritium released
due to S1, after subtraction of basal release
(av-eraged tritium content of the 2 samples before stimulation and 2 samples after stimulation on returning to basal levels). To evaluate the influ-ence of a drug on the effect of BDNF, that drug was added 10 min after starting the washout period and remained present until the end of experiments, being therefore present during S1
and S2. In the case of exogenously added
cho-lesterol, MCD–cholesterol complexes were
perfused only during the first 10 min of the washout period. None of the drugs affected the S2/S1ratio, when compared with the S2/S1ratio
in the absence of any drug.
Acutely prepared hippocampal slices. The 3–5-week-old rats were decapitated under halothane anesthesia. Hippocampal dissection was per-formed in ice-cold Krebs’ solution, previously gassed with 95% O2and 5% CO2, as described
above. Four hundred-micrometer-thick slices were cut perpendicularly to the long axis of hip-pocampus with a McIlwain tissue chopper, and allowed to recover functionally and energet-ically for at least 1 h in a resting chamber, filled with oxygenated Krebs’ solution, at room temperature.
High-frequency stimulation of acutely prepared slices. Groups of four hippocampal slices were placed in 100l chambers and continuously per-fused (0.5 ml/min) with oxygenated Krebs’ solu-tion at 30°C. After 1 h, slices were field stimulated using a high-frequency stimulation protocol. Trains of 100 Hz were applied for 50 ms, every 2 s, for 1 min (150 pulses). Thirty minutes after stim-ulation, slices were homogenized in detergent-free TNE buffer containing protease and phosphatase inhibitors (as above). Triton X-100 (final concentration 0.5%) was added to the ho-mogenate, and after 1 h incubation at 4°C, lipid rafts were isolated in discontinuous Optiprep gradients, as described above. When 1 U/ml ADA was used, it was added to the perfusion solution 30 min before the high-frequency stimulation and remained present up to the end of the exper-iment. Using the same stimulation and perfusion conditions, it has been previously shown that considerable amounts of ATP and adenosine were released and detected in the bath after stim-ulation (Cunha et al., 1996a).
LTP. After a 1 h recovery period, as described above, one hippocampal slice was transferred to a recording chamber for submerged slices (1 ml plus 5 ml dead volume), where it was
continu-ously superfused at a flow rate of 1.5 ml/min with Krebs’ solution at 32°C; all drugs were added to this superfusion solution. Perfusion tubes were coated with 0.1 mg/ml BSA before experiments to avoid adsorption of BDNF to the tubes. Evoked field EPSPs (fEPSPs) were recorded extracellularly through a microelectrode filled with 4MNaCl (2– 4 M⍀ resistance) placed in the
stra-tum radiastra-tum of the CA1 area. Two independent pathways of Schaffer col-lateral/commissural fibers were stimulated (rectangular pulses of 0.1 ms duration) alternately once every 20 s by two bipolar concentric wire elec-trodes placed on the Schaffer fibers in the stratum radiatum, in the CA1 area (see Fig. 10 A). The initial intensity of the stimulus (80 –150 mA) was ad-justed to obtain a submaximal fEPSP slope with a minimum population spike contamination, of similar magnitude in both pathways. The averages of eight consecutive fEPSPs from each pathway were obtained and quanti-fied as the slope of the initial phase of the potential. Recordings were ob-tained with an Axoclamp 2B amplifier (Molecular Devices), digitized, and continuously stored on a personal computer with the LTP program
(Anderson and Collingridge, 2001). The independence of the two pathways was tested by evaluating paired-pulse facilitation (50 ms interval) across both pathways,⬍10% facilitation usually being observed. When a higher facilita-tion was observed, the slice was discarded. LTP was induced after obtaining a stable recording of fEPSP slope in the two pathways for at least 30 min, by theta burst stimulation, consisting of one train of 15 bursts (200 ms inter-burst interval), with four pulses (100 Hz) each (Fontinha et al., 2008). LTP was quantified as the percentage change in the average slope of the fEPSP taken from 50 to 60 min after LTP induction in relation to the average slope of the fEPSP measured during the 10 min that have preceded the induction of LTP. One hour after LTP induction in one of the pathways, BDNF (20 ng/ml) was added to the superfusion solution and was delivered continu-ously to the slices. LTP was induced in the second pathway no less than 30 min after BDNF perfusion, based on the stability of fEPSP slope values. The effect of BDNF on LTP was evaluated by comparing the magnitude of LTP in the first pathway in the absence of BDNF (control pathway), and with the
A
D
B
C
E
F
G
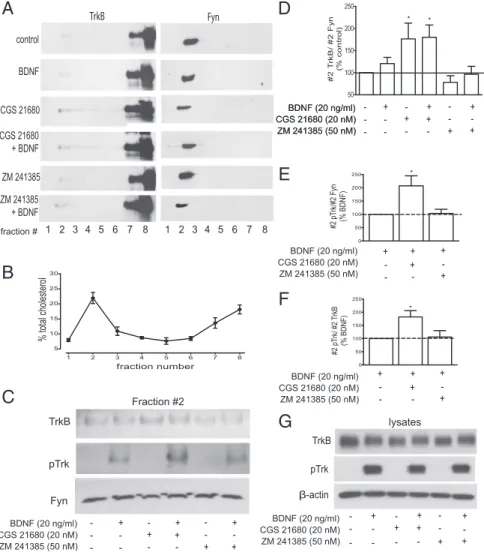
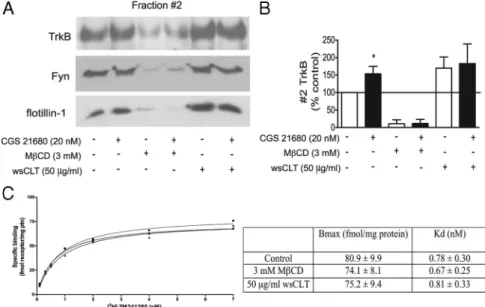
Figure 1. Activation of adenosine receptors enhances the levels of TrkB full length and potentiates BDNF-induced pTrkB localization in lipid rafts. On DIV 8 –11, cortical neurons were starved for 4 h and incubated with/without 20 nMCGS 21680 or 50 nMZM 241385 for 30 min
before 5 min incubation with 20 ng/ml BDNF, as indicated. Lysates were prepared in 0.5% Triton X-100-containing buffer and fractioned in a discontinuous Optiprep gradient, as described in Materials and Methods. A, Equal volumes of each gradient fraction were probed for TrkB (1:200) and Fyn (1:400). Note that Fyn, a lipid raft marker, was only detected in fraction 2, which therefore was considered the lipid raft-containing fraction. B, Quantification of cholesterol content in each gradient fraction. Fraction 2 was highly enriched in cholesterol, containing⬃22% of total cholesterol. C, Representative Western blot analysis of the lipid raft fraction (fraction 2) obtained from the Optiprep density gradients. Antibodies used were TrkB (1:200), pTrk (pY490, 1:750), and Fyn (1:400). D, Quantitative analysis of TrkB staining in fraction 2, normalized by Fyn staining in this fraction; 100% represents staining in the absence of any drug. E, F, Quantification analysis of BDNF-induced changes in fraction 2 pTrk, normalized by fraction 2 Fyn (E) or by total TrkB (F ) in cells preincubated with CGS 21680orZM241385,asindicatedbeloweachbar.OnehundredpercentcorrespondtothestainingobtainedinthepresenceofBDNFalone.
G, Analysis of TrkB and pTrk staining in total lysates of cells treated with/without CGS 21680, ZM 241385, or 20 ng/ml BDNF, as indicated.
magnitude of LTP in the second pathway in the presence of BDNF (test
pathway); when BDNF was tested in the presence of 1 mMMCD, MCD
was added at least 30 min before LTP induction in the first pathway and remained in the bathing solution until the end of the experiment. Each pathway was used as control or test on alternate days. This protocol allows the comparison between the effects of BDNF on LTP under different exper-imental conditions, keeping as an internal control the magnitude of LTP under the same drug condition and slice, but in the absence of BDNF.
Immunoblotting. Lysates were denatured with 5⫻ sample buffer (350
mMTris, 30% glycerol, 10% SDS, 600 mMdithiothreitol, and 0.012%
bromophenol blue, pH 6.8), and equal volumes were loaded into gels. Proteins were run in SDS-PAGE gels, transferred to polyvinylidene di-fluoride membranes, and blocked for 1 h at room temperature with 5% nonfat milk in TBS with 0.1% Tween-20 (TBS-T). Incubations with the primary antibodies were performed overnight at 4°C, all of them diluted in 3% BSA in TBS-T and 0.02% sodium azide. HRP-coupled secondary antibodies were diluted in blocking buffer and incubated for 1 h at room temperature. Detection of proteins was made with ECL plus Western blotting detection.
Radioligand binding. [3H] ZM 241385 binding was performed as
de-scribed previously (Dio´genes et al., 2007) with minor modifications. Briefly, 3– 4-week-old rat cortices were dissected as described above and centrifuged at 1000⫻ g for 10 min at 4°C. The supernatant was centrifuged again at 14,000⫻ g for 12 min, and the pellet was resuspended in 50 mMTris-HCl, pH 7.4, with 1 mMEDTA and 2 mMEGTA, and incubated with 2 U/ml ADA for 30 min at 37°C. Membranes were precipitated and resuspended in 50 mM
Tris-HCl, pH 7.4, with 2 mMMgCl2and 4 U/ml ADA. A total of 110 –200g
of protein was incubated with 0.1–7 nM[3H] ZM 241385 for 60 min at room
temperature, in a final volume of 300l. Specific binding was calculated by subtraction of the nonspecific binding, defined in the presence of 2M
xanthine amine congener. Reaction was stopped by addition of cold incuba-tion buffer followed by vacuum filtraincuba-tion through glass fiber filters (Filter-MAT for receptor binding, Skatron Instruments) using a semiautomatic cell harvester from Skatron Instruments. The samples were transferred to scin-tillation vials, and radioactivity was measured by a liquid scinscin-tillation ana-lyzer (Tri Carb 2900TR, PerkinElmer). Membrane protein content was measured using the Bio-Rad protein assay (Bradford, 1976).
Cholesterol measurements. Cholesterol content from the gradient fractions was analyzed using a colorimetric assay (Sepu´lveda et al., 2006) with minor modifications. Briefly, lipids were extracted by mixing 200l of samples from each gradient fraction with 1 ml of chloroform/methanol (2:1), trans-ferred to a glass tube and dried under nitrogen. Reaction was started by adding 0.75 ml of acetic acid (glacial) and 0.5 ml of 2.5% ferric chloride in
85% phosphoric acid to the tube. After 30 min, absorbance was measured at 550 nm. Standard curves with cholesterol allowed direct quantifica-tion of cholesterol levels in each fracquantifica-tion.
Data analysis. All data are expressed as mean⫾ SEM from the indicated number of experiments. Statistical significance was determined using one-way ANOVA followed by Bonferroni correction for multiple comparisons. When only two means were analyzed, a Student’s t test analysis was per-formed. Values of p⬍ 0.05 were considered to represent statistically significant differences.
Results
Adenosine A
2Areceptor activation
induces TrkB translocation to lipid
rafts and potentiates BDNF-induced
phospho-TrkB levels in this membrane
microdomain
To study the role of adenosine A
2Arecep-tors in TrkB receptor distribution in
dif-ferent membrane domains, isolation of
lipid rafts from membranes of cultured
cortical neurons was performed based on
their relative insolubility in nonionic
de-tergents (see Materials and Methods). The
low density of Triton X-100-insoluble lipid rafts allowed their
subsequent separation by density gradient fractionation. Eight
gradient fractions were collected, and equal volumes of each
frac-tion were analyzed by Western blotting, as shown in Figure 1 A.
Lipid rafts were localized in fraction 2 (from top to bottom), as
demonstrated by the presence of the lipid raft marker Fyn in this
fraction. The remaining membranes were found in the bottom
fractions of the gradient (Fig. 1 A, fractions 7 and 8). Because lipid
rafts are domains enriched in cholesterol, its levels were
deter-mined for each fraction. Fraction 2 contained
⬃22% of the total
cholesterol present in the gradient, being highly enriched in this
lipid compared with its neighboring fractions (Fig. 1 B).
Choles-terol was also found in the bottom fractions (Fig. 1 B, 13 and 18%,
respectively, of total cholesterol in fractions 7 and 8), which
pos-sess the majority of cellular membranes, but no staining of the
lipid raft marker Fyn (Fig. 1 A).
The role of adenosine A
2Areceptors on TrkB localization was
studied by treating cortical neurons with the A
2Aselective agonist
CGS 21680 or with the A
2Areceptor antagonist ZM 241385. For a
better comparison, we analyzed in the same gel fraction 2 samples
from cells incubated under different conditions, as shown in
Fig-ure 1C. When cells were treated with CGS 21680 (20 n
M) for 30
min, there was a marked increase in TrkB staining in fraction 2
(176
⫾ 35% of the control, p ⬍ 0.05, n ⫽ 6) (Fig. 1D). This
incubation time with the A
2Areceptor agonist clearly induced
maximal translocation of TrkB receptors to lipid rafts
(supple-mental Fig. 1, available at www.jneurosci.org as supple(supple-mental
material). Therefore, a 30 min preincubation time with CGS
21680 before the addition of BDNF was always used while
evalu-ating the influence of A
2Areceptors on the effect of BDNF on
TrkB receptor translocation.
The A
2Areceptor antagonist ZM 241385 (50 n
M) did not
in-fluence TrkB receptor sublocalization in lipid rafts (88
⫾ 15% of
the control, p
⬎ 0.05, n ⫽ 6) (Fig. 1D). As expected, the effect of
CGS 21680 was completely prevented by preincubation with ZM
241385 (88
⫾ 17% of the control, p ⬎ 0.05, n ⫽ 3). We then
investigated the influence of A
2Aagonists and antagonists on the
effects of BDNF in TrkB receptor localization and
phosphoryla-Figure 2. CGS 21680 treatment increases copatching between TrkB receptors and cholera toxin subunit B (Chol. Tox. B). A, Alexa Fluor 594-coupled cholera toxin subunit B (2g/ml) and an anti-TrkB receptor antibody (1:500) raised against the extracellular domain of TrkB receptors were used in the copatching experiments of cultured cortical neurons. TrkB receptor patches were labeled with an Alexa Fluor 488-coupled goat anti-rabbit antibody (1:300). B, Quantification of the percentage of TrkB receptors copatched with cholera toxin subunit B. Results are expressed as mean⫾ SEM of five independent experiments. *p ⬍ 0.05, compared with control.
tion after a short (5 min) incubation time with BDNF. Treatment
with BDNF (20 ng/ml) for 5 min did not significantly change
TrkB localization but induced the phosphorylation of TrkB
re-ceptors in the lipid raft fraction (Fig. 1C). While a preincubation
for 30 min with CGS 21680 (20 n
M) alone had no effect on lipid
raft TrkB phosphorylation, it resulted in an increased
phosphor-ylation of TrkB receptors in lipid rafts in response to BDNF
treat-ment for 5 min (Fig. 1C). This increase was observed when the
pTrkB signal was normalized either to Fyn (207
⫾ 38% of the
BDNF condition, p
⬍ 0.05, n ⫽ 5) (Fig. 1E) or to total TrkB
(182
⫾ 24% of the BDNF condition, p ⬍ 0.05, n ⫽ 5) (Fig. 1F).
This suggests that CGS 21680 facilitates BDNF-induced increase
of the proportion of phosphorylated, and hence active, TrkB
re-ceptors in the lipid rafts. The A
2Aantagonist ZM 241385 (50 n
M)
did not modify BDNF-induced pTrkB staining in the lipid rafts
(Fig. 1C).
Importantly, A
2Areceptor activation with CGS 21680 or
blockade with ZM 241385 did not modify (112
⫾ 13% and 114 ⫾
11% of the control, respectively, p
⬎ 0.05, n ⫽ 3) TrkB
phosphor-ylation or expression in total lysates (Fig. 1G), suggesting that A
2Areceptors act specifically as modulators of TrkB receptor
localiza-tion in lipid rafts.
To image TrkB receptors in lipid rafts at membranes of
corti-cal neurons, we performed copatching experiments between
TrkB receptors and the subunit B of cholera toxin. This subunit
of cholera toxin specifically binds to the GM1 gangliosides
present in lipid rafts, so that the coalescence of cross-linked lipid
microdomains induced by this toxin allows a specific imaging of
lipid rafts (Harder et al., 1998; Guirland et al., 2004). As shown in
Figure 2, a significant proportion (33
⫾ 5%, n ⫽ 5) of TrkB
receptors copatch with cholera toxin B in cortical membranes.
CGS 21680 (20 n
M) treatment induced a significant increase in
the degree of colocalization (48
⫾ 5%, p ⬍ 0.05, n ⫽ 5) (Fig. 2)
between TrkB receptors and the subunit B of cholera toxin.
The results described above show that after a short (5 min)
incubation time with BDNF the neurotrophin itself has only a
minor influence on TrkB translocation to lipid rafts. Adenosine
A
2Areceptor activation relocates TrkB receptors in the
mem-brane and facilitates TrkB receptor phosphorylation in lipid rafts.
We next examined how CGS 21680 influences the kinetics of
BDNF-mediated TrkB translocation and phosphorylation in
lipid rafts. As shown in Figure 3, the proportion of pTrkB over
total TrkB was already maximal after 5 min of BDNF incubation.
Facilitation of pTrkB localization in lipid rafts by adenosine A
2Aagonists was also maximal after a short (5 min) incubation time
with BDNF. For longer incubation times, the ability of CGS
21680 to increase the pTrkB/TrkB ratio in lipid rafts markedly
diminishes, being virtually null after BDNF incubation for 40
min (Fig. 3B). However, even at prolonged incubations with
BDNF (40 min), total TrkB and pTrkB staining was more
pro-nounced in the presence of CGS 21680 (Fig. 3 A, C,D).
A
2Areceptors are not required for BDNF-induced TrkB
translocation to lipid rafts
To characterize in more detail the cross talk between adenosine
A
2Aand TrkB receptors, in the next series of experiments neurons
were incubated with BDNF for 40 min, i.e., in conditions where
BDNF per se has a marked effect on TrkB translocation to lipid
rafts. Treatment of cortical neurons with BDNF (20 ng/ml) for 40
min significantly increased TrkB levels in fraction 2 (164
⫾ 17%
of the control, p
⬍ 0.01, n ⫽ 6) (Fig. 4B,C). Activation of
aden-osine receptors also resulted in an increase up to 140
⫾ 6% of the
control in TrkB staining in lipid rafts ( p
⬍ 0.05, n ⫽ 6) (Fig.
4 B, C). When BDNF was applied for 40 min in the presence of
CGS 21680, TrkB staining was increased up to 224
⫾ 20% of the
control (Fig. 4C), approximately the sum of the effect of each
drug alone, suggesting the existence of two different pathways
involved in TrkB translocation by BDNF and CGS 21680.
Fur-thermore, incubation with an A
2Areceptor antagonist, ZM
241385 (50 n
M), for 30 min before BDNF addition did not modify
( p
⬎ 0.05, n ⫽ 5) (Fig. 4C) BDNF-induced TrkB translocation to
Figure 3. Time course of TrkB receptor phosphorylation in lipid rafts by BDNF. A, Lipid raft (fraction 2) analysis of pTrk and TrkB staining in lipid rafts from cells incubated with BDNF for 1– 40 min in the absence or presence of the A2Areceptor agonist CGS 21680 (20 nM), as
indi-cated. Fraction 2 was probed for pTrk, TrkB, and Fyn. B, C, Densitometry analysis of fraction 2 pTrk staining, normalized by total fraction 2 TrkB (B) and fraction 2 Fyn (C). D, Densitometry analysis of fraction 2 TrkB staining, normalized by fraction 2 Fyn. Results are expressed as mean⫾SEMofthree(1and20min)oreight(5and40min)experiments.*p⬍0.05,compared with BDNF alone.
lipid rafts, indicating that A
2Areceptors are not required for this
process.
When the levels of pTrkB in lipid rafts were analyzed, CGS
21680 pretreatment resulted in a 40% increase (Fig. 4 D) in pTrkB
staining in lipid rafts in response to BDNF (vs BDNF alone).
However, this reflects the augmented number of TrkB receptors
in these domains induced by CGS 21680 treatment, because the
fraction of pTrkB/TrkB is not modified by CGS 21680 (Figs. 3B,
4 E). Blockade of A
2Areceptors with ZM 241385 (50 n
M, 30 min)
did not induce any significant change in BDNF-induced pTrkB
levels in fraction 2 (Fig. 4 B, D), further indicating that A
2Arecep-tors potentiate, but are not required, for BDNF-induced TrkB
phosphorylation in lipid rafts.
No effects of the A
2Areceptor agonist CGS 21680 and
antag-onist ZM 241385 on TrkB expression or BDNF-induced (20 ng/
ml, 40 min) TrkB phosphorylation were observed in the analysis
of total lysates (95
⫾ 9% and 107 ⫾ 7% of the control,
respec-tively, p
⬎ 0.05, n ⫽ 3) (Fig. 4F).
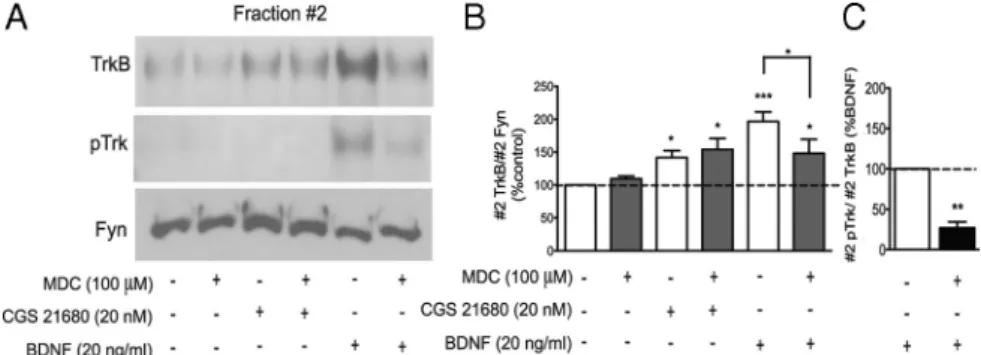
CGS 21680 and BDNF use different mechanisms to recruit
TrkB receptors to lipid rafts
BDNF-induced TrkB translocation to lipid rafts requires TrkB
receptor phosphorylation and internalization (Suzuki et al.,
2004; Pereira and Chao, 2007). It is also known that most of the
activated Trk receptor internalization takes place through
clathrin-coated pits (Grimes et al., 1996; Du et al., 2003; Zheng et
al., 2008). Although a 30 min incubation with CGS 21680 did not
induce TrkB phosphorylation on its own (Fig. 1C), we
investi-gated the need of TrkB internalization for CGS 21680-induced
TrkB translocation to lipid rafts, using the clathrin-dependent
endocytosis inhibitor monodansylcadaverine (MDC) (Haigler et
al., 1980; Ivanov, 2008). Alone, MDC did not significantly affect
TrkB localization (Fig. 5). Interestingly, MDC did not prevent
CGS 21680-induced recruitment of TrkB receptors to lipid rafts
(Fig. 5), suggesting that the mechanism used by A
2Areceptors to
translocate TrkB receptors to lipid rafts dos not require
internal-ization through clathrin-coated pits. For comparison and as a
positive control, we evaluated the influence of MDC on
induced TrkB translocation. In the presence of MDC,
BDNF-induced TrkB translocation to lipid rafts was significantly
attenuated (Fig. 5). As expected, BDNF-induced enhancement of
pTrkB levels in lipid rafts was markedly reduced in MDC-treated
neurons (Fig. 5 A, C).
The effects of CGS 21680 on TrkB translocation involve cAMP
and Src-family tyrosine kinase activation
Since A
2Areceptor-induced translocation of TrkB receptors to
lipid rafts is independent of TrkB phosphorylation and
internal-ization (Fig. 5), occurring through a process different from that
used by BDNF, we further evaluated the mechanisms involved in
this process. Adenosine A
2Areceptors are primarily coupled to
G
s-proteins, and most of its actions involve activation of adenylyl
cyclase. We first investigated the role of cAMP for CGS
21680-induced TrkB translocation by using forskolin, a known adenylyl
cyclase activator (Awad et al., 1983). As shown in Figure 6 A, D,
forskolin (5
M) mimicked the effect of CGS 21680 in inducing
TrkB translocation to lipid rafts. In cells incubated in the
pres-ence of forskolin, CGS 21680 did not cause a further
enhance-ment of TrkB staining in fraction 2 (Fig. 6 A, D). We then
investigated the role of protein kinase A, one of the main cAMP
effectors, on CGS21680-induced TrkB translocation to lipid
rafts. We used Rp-cAMPs, an inactive analog of cAMP that
in-A
B
C
D
E
F
Figure 4. A2Areceptors are not required for maximal BDNF-induced TrkB translocation to lipid rafts. On DIV 7–11, cortical neurons were starved for 4 h before treatment with/without 20 nMCGS
21680, 50 nMZM 241385, and/or 20 ng/ml BDNF (40 min), as indicated. A, Equal volumes of each density gradient fraction were immunoblotted for TrkB and the lipid raft marker Fyn. B, Staining of lipid raft fraction 2. Membranes were probed for TrkB, pTrk, and Fyn. C, Densitometry analysis of TrkB staining in lipid rafts (fraction 2), normalized by fraction 2 Fyn. D, E, Densitometric analysis of the pTrk staining in fraction 2 normalized by Fyn (D) and total TrkB (E). One hundred percent correspond to pTrk staining in the presence of BDNF alone. F, Total lysates were treated as described in Materials and Methods, lysed, and probed for TrkB, pTrk, and-actin.InC,D,andE,resultsareexpressedasmean⫾SEMofsixindependentexperiments.*p⬍0.05;**p⬍0.01;***p⬍0.001, compared with 100%, unless otherwise indicated.
hibits activation of PKA by substrate
com-petition (Lochner and Moolman, 2006).
In cells incubated with Rp-cAMPs (100
M), the effect of CGS 21680 on TrkB
re-ceptor translocation to lipid rafts was fully
prevented (Fig. 6 B, D), supporting a role
for PKA in this process. Moreover, the
PKA inhibitor peptide PKI-(14 –22) also
prevented the effect of CGS 21680 in TrkB
receptor recruitment to lipid rafts (Fig.
6 B, D). Unexpectedly, incubation with
H-89 (1
M) did not block the effect of
CGS21680 on TrkB localization (Fig.
6 B, D). This discrepancy might result
from an H-89-induced inhibition of other
kinases (Leemhuis et al., 2002; Lochner
and Moolman, 2006; Murray, 2008) that
might counteract the consequences of
PKA inhibition; alternatively, it may
re-sult from an inefficient inhibition of PKA
by the concentration of H-89 used, since
the IC
50for PKA inhibition by H-89 is
highly dependent on the intracellular ATP
concentration (Murray, 2008). Higher
concentrations of H-89 were not tested
due to lack of selectivity. Neither 100
MRp-cAMPs, 1
MPKI-(14 –22), nor 1
MH-89 per se influenced the levels of TrkB
on lipid rafts when added in the absence of
CGS 21680 (Fig. 6 D).
The possible involvement of other
transduction pathways that can also be
ac-tivated by A
2Aagonists, such as PLC (see
Fredholm et al., 2001) and Src-family
tyrosine kinases (Rajagopal and Chao,
2006), was also investigated. Figure 6C
shows the influence of the PLC inhibitor
U73122 (4
M) (Bleasdale et al., 1990) and
the Src-family tyrosine kinase inhibitor
PP2 (0.5
M) (Bain et al., 2003) on CGS
21680-induced TrkB translocation to
lipid rafts. The PLC inhibitor did not
prevent the CGS 21680 effect on TrkB
staining in fraction 2. Importantly, PP2
blocked the effect of CGS 21680 on TrkB
localization to lipid rafts, suggesting an
in-volvement of Src-family tyrosine kinases (Fig. 6C,D).
Influence of membrane cholesterol content on TrkB and
A
2Areceptors
To investigate the role of cholesterol and lipid raft integrity in
CGS 21680-induced TrkB translocation to lipid rafts, we used the
cholesterol-sequestering agent MCD (Simons and Toomre,
2000). Incubation of cortical neurons with 3 m
MMCD alone
decreased TrkB levels in the lipid rafts. This reduction in TrkB
staining was accompanied by a decrease of the lipid raft marker
proteins Fyn and flotillin-1 in fraction 2 (Fig. 7A). In the presence
of MCD, adenosine A
2Areceptor activation with CGS 21680 did
not induce any detectable increase in TrkB levels in fraction 2
(Fig. 7 A, B). These results show that MCD disturbed lipid raft
integrity and that under these conditions A
2Areceptor agonists
were no longer able to induce TrkB translocation.
Another approach was to use MCD–cholesterol complexes [50
g/ml cholesterol, or water-soluble cholesterol (wsCLT)] to load
cells with cholesterol. The M
CD/cholesterol ratio used was 6:1,
which is considered optimal for cell loading (Christian et al.,
1997). This treatment led to an increased TrkB partition to lipid
rafts, indicating that there is a cholesterol-dependent regulation
of TrkB receptor localization in membrane subdomains (Fig.
7A,B). Interestingly, in cholesterol-loaded cells, incubation with
CGS 21680 (20 n
M) did not cause a further enhancement of TrkB
receptor staining in the lipid raft faction (Fig. 7B), suggesting that
under conditions of high cholesterol and TrkB receptor localization
in lipid rafts A
2Areceptors are no longer able to promote further
TrkB receptor translocation.
To elucidate whether adenosine A
2Areceptor activation could
directly influence the amount of cholesterol in lipid rafts, we
mea-sured cholesterol content in the lipid raft fraction (fraction 2) and the
nonraft fractions (fractions 7 and 8) after CGS 21680 treatment. No
Figure 5. Influence of clathrin-dependent endocytosis on CGS 21680-induced and BDNF-induced TrkB recruitment and phos-phorylation to lipid rafts. On DIV 7–11, cortical neurons were treated with 20 nMCGS 21680 for 30 min or 20 ng/ml BDNF for 40 min
in the presence or absence of the clathrin-dependent endocytosis inhibitor monodansylcadaverine (100M), where indicated. A,
Density gradient fraction 2 was immunoblotted and probed for TrkB, pTrk, and Fyn. B, Quantification of fraction 2 TrkB/fraction 2 Fyn. C, Quantification of fraction 2 pTrk/fraction 2 TrkB after BDNF treatment in the presence/absence of MDC, as indicated below each bar. Data are expressed as mean⫾ SEM of four to six independent experiments. *p ⬍ 0.05; **p ⬍ 0.01; ***p ⬍ 0.001, comparedwith100%,unlessotherwiseindicated.Notethattheclathrin-dependentendocytosisinhibitor,MDC,attenuatedBDNF-induced TrkB translocation to lipid rafts but did not influence CGS 21680-induced TrkB recruitment to these membrane domains.
A
D
B
C
Figure 6. SignalingpathwaysinvolvedinCGS21680-inducedTrkBtranslocationtolipidrafts.Culturedcorticalneuronswereincubated with/without20nMCGS21680for30mininthepresenceoftheadenylatecyclaseactivatorforskolin(5M),thePKAinhibitorH-89(1M),
the cAMP antagonist Rp-cAMPs (100M), the PKA inhibitor PKI-(14 –22) (1M), the phospholipase C inhibitor U73122 (4M), or the
Src-family kinase inhibitor PP2 (500 nM), as indicated. Cells were lysed and processed for lipid raft isolation. A–C, Fraction 2 obtained from
the density gradients of cells under different conditions was probed for total TrkB and Fyn, which was used as a loading control. B, D, Densitometry analysis of TrkB/Fyn staining obtained in A–C. Data are expressed as mean⫾SEMoffourtosixindependentexperiments. *p⬍0.05;**p⬍0.01;NS,nostatisticaldifference( p⬎0.05),comparedwith100%,exceptwhenotherwiseindicated.
changes were observed in the cholesterol levels present in the
raft fraction 2 (11.0
⫾ 1.1 in control and 11.6 ⫾ 0.9
g/ml
after CGS 21680, p
⬎ 0.05, n ⫽ 5) or in the nonraft fractions 7
and 8 (7.1
⫾ 0.4 in control and 7.8 ⫾ 0.5
g/ml after CGS
21680, p
⬎ 0.05, n ⫽ 5).
To examine the influence of lipid rafts on adenosine A
2Arecep-tors, saturation binding experiments were performed using the
se-lective A
2Aantagonist [
3H] ZM 241385. Membrane samples were
incubated in the presence of M
CD and MCD–cholesterol
com-plexes. As illustrated in Figure 7C, neither lipid raft disruption with 3
m
MM
CD nor cholesterol enrichment with 50 g/ml wsCLT
re-sulted in changes in the parameters for [
3H] ZM 241385 binding
( p
⬎ 0.05, n ⫽ 3). These results do not exclude the importance of
lipid rafts for optimal A
2Areceptor signaling, but strongly suggest
that ligand affinity and density of this receptor are conserved while
interfering with lipid raft integrity.
BDNF-induced facilitation of glutamate release depends on
endogenous adenosine and lipid raft integrity
The functional relevance of A
2A-induced TrkB translocation to
lipid rafts was first assessed by investigating the effect of BDNF on
glutamate release after extracellular adenosine depletion and
lipid raft disruption. Cortical synaptosomes were labeled with
[
3H]glutamate as previously described (Canas et al., 2004), and
neurotransmitter release was evoked twice (S
1and S
2) by
perfu-sion with 15 m
MKCl for 2 min (see Materials and Methods). In
control conditions, the S
2/S
1ratio was 0.79
⫾ 0.02 (n ⫽ 14); when
BDNF (20 ng/ml) was added before S
2, the ratio was increased to
1.05
⫾ 0.02 ( p ⬍ 0.01, n ⫽ 14), corresponding to a 33 ⫾ 3%
enhancement in evoked glutamate release (Fig. 8). To investigate
how endogenous extracellular adenosine influences this effect of
BDNF, synaptosomes were incubated with the
adenosine-degrading enzyme ADA, which was added before S
1and
re-mained in the perfusion up to the end of
sample collection (see Materials and
Methods). As shown in Figure 8 B, the
re-moval of endogenous adenosine with 1
U/ml ADA completely prevented the
ef-fect of BDNF on glutamate release. The
presence of ADA (1 U/ml) during S
1and
S
2did not affect the S
2/S
1ratio, which in
the control conditions was 0.81
⫾ 0.04
and in the presence of ADA was 0.84
⫾
0.05 ( p
⬎ 0.05, n ⫽ 3).
The relevance of lipid rafts was first
studied by perfusing synaptosomes with
MCD. Per se, 1 m
MMCD treatment
caused a slight increase (12
⫾ 3%, n ⫽ 3)
in the basal release of tritium but did not
influence S
2/S
1ratios (2.2
⫾ 2.5% change,
n
⫽ 3) or the amount of tritium released
in response to K
⫹stimulation (1.3
⫾ 4%
change, n
⫽ 3), indicating that K
⫹-evoked glutamate release was not
com-promised at this concentration of MCD.
In synaptosomes incubated with MCD,
the BDNF-induced enhancement of
glu-tamate release was significantly smaller
than in control conditions (Fig. 8C), thus
supporting a relevant role of lipid rafts in
BDNF-induced modulation of glutamate
release. However, BDNF was still able to
induce a small but significant increase on
release (Fig. 8C). This could be explained either by incomplete
disruption of lipid rafts with 1 m
MMCD or by involvement of
lipid raft-independent mechanisms in the effect of BDNF on
glu-tamate release. Higher concentrations of MCD (2–3 m
M)
caused a marked increase in basal release of tritium (data not
shown), probably due to compromised synaptosomal integrity,
precluding the possibility of testing higher concentrations of
MCD. Alternatively, we used cholesterol oxidase, an enzyme
that converts cholesterol into 4-cholesten-3-one, altering the
structure of rafts (He´rincs et al., 2005; Ivanov, 2008). As shown in
Figure 8C, preincubation of synaptosomes with 2 U/ml
choles-terol oxidase abolished the effect of BDNF on glutamate release
( p
⬍ 0.01, n ⫽ 4). Together, these data suggest that BDNF
enhances glutamate release through an adenosine- and lipid
raft-dependent mechanism.
Interestingly, cholesterol addition (MCD–cholesterol
com-plexes, 50
g/ml) did not modify ( p ⬎ 0.05, n ⫽ 6) the
facilita-tory action of BDNF on glutamate release, suggesting that either
the endogenous cholesterol levels were enough to trigger the
maximal effect of BDNF and/or synaptosomes were not able to
efficiently incorporate exogenously added cholesterol to their
membranes.
The presence of MCD (1 m
M), cholesterol oxidase (2 U/ml),
or wsCLT (50
g/ml) during S
1and S
2did not affect the S
2/S
1ratio. In the MCD experiments, the S
2/S
1ratio in the control
was 0.75
⫾ 0.02, and in the presence of MCD was 0.77 ⫾ 0.02
( p
⬎ 0.05, n ⫽ 6). In the cholesterol oxidase experiments, the
S
2/S
1ratio in the control was 0.81
⫾ 0.03, and in the presence of
cholesterol oxidase was 0.85
⫾ 0.04 ( p ⬎ 0.05, n ⫽ 5). In the
exogenous cholesterol experiments, the S
2/S
1ratio in the control
was 0.74
⫾ 0.03, and in the presence of excess cholesterol was
0.76
⫾ 0.03 ( p ⬎ 0.05, n ⫽ 6).
Figure 7. Effects of cholesterol depletion and loading on the partition of TrkB receptors to lipid rafts and on adenosine A2A
receptor binding properties. Cultured cortical neurons were treated with/without 20 nMCGS 21680 for 30 min after incubation with
3 mMMCD or MCD–cholesterol complexes (50 g/ml cholesterol, wsCLT). A, Lipid raft (fraction 2) analysis of the effect of
MCD on TrkB sublocalization after CGS 21680 treatment. MCD–cholesterol complexes were used to load cholesterol to mem-branes. B, Quantification of fraction 2 TrkB. C, Saturation curves for the specific binding of the A2Areceptor antagonist [
3H] ZM
241385 in cortical membranes from cells in control conditions (open circles), after incubation with MCD(closedsquares),orwith wsCLT (closed triangles) treatment. Data are expressed as mean⫾ SEM of three to four independent experiments. *p ⬍ 0.05, compared with 100%.
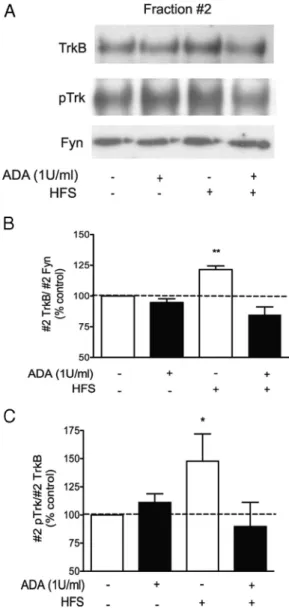
High-frequency stimulation of
hippocampal slices increases TrkB and
pTrkB receptor localization in lipid
rafts in an adenosine-dependent
manner
BDNF release is stimulated after increased
neuronal activity (Figurov et al., 1996),
but it is still not understood how such a
diffusible molecule preferentially
potenti-ates active synapses. Neuronal activity and
increased intracellular cAMP levels have
been shown to gate synaptic actions of
BDNF (Boulanger and Poo, 1999a,b;
Nagappan and Lu, 2005). Adenosine
con-centration is also markedly increased
un-der high-frequency neuronal firing due to
catabolism of endogenously released ATP
(Wieraszko et al., 1989; Cunha et al.,
1996a), and this ATP-derived adenosine
preferentially activates A
2Areceptors
(Cunha et al., 1996b). We have previously
demonstrated a potentiating effect of
BDNF on hippocampal LTP that requires
the activation of A
2Areceptors by
endog-enous adenosine (Fontinha et al., 2008),
supporting a role for A
2A-induced gating
of BDNF effects on synaptic plasticity.
Therefore, we hypothesized that
activity-derived activation of A
2Areceptors by
en-dogenous adenosine could induce TrkB
translocation to lipid rafts. To test this
hy-pothesis, hippocampal slices were
stimu-lated for 1 min using a high-frequency
paradigm that was shown to induce the
release of ATP and adenosine (see
Materi-als and Methods) (Cunha et al., 1996a).
After 30 min, the lipid rafts were isolated
from slice lysates and fraction 2 was
ana-lyzed by immunoblotting. As illustrated
in Figure 9, field stimulation of
hip-pocampal slices induced TrkB translocation to lipid rafts
(121.5
⫾ 3% of the control, p ⬍ 0.001, n ⫽ 6) (Fig. 9). Field
stimulation of hippocampal slices also induced a significant
in-crease in the pTrkB staining and the pTrkB/TrkB ratio in fraction
2 ( p
⬍ 0.05, n ⫽ 6) (Fig. 9). The role of endogenous adenosine in
high-frequency stimulation-induced recruitment of TrkB
recep-tors into lipid rafts was investigated by incubation of the slices
with the adenosine-degrading enzyme ADA (1 U/ml) from 30
min before the high-frequency stimulation until the end of the
experiment. Under these conditions, the effect of field
stimu-lation on both TrkB and pTrkB receptor localization was
com-pletely prevented (Fig. 9B), supporting the hypothesis that
adenosine released during intense synaptic activity plays a role
in targeting TrkB receptors to lipid rafts.
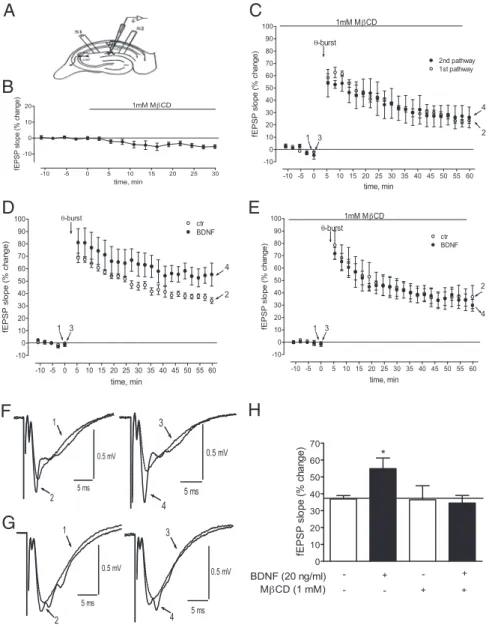
Lipid raft integrity is required for BDNF-induced facilitation
of long-term potentiation
Since extracellular adenosine is required for BDNF-induced
en-hancement of LTP (Fontinha et al., 2008) and for high-frequency
stimulation-induced TrkB translocation to lipid rafts (Fig. 9), we
investigated whether lipid rafts were required for the facilitation
of LTP induced by BDNF. The LTP-inducing protocol was
sim-ilar to that previously used to detect facilitatory actions of
endog-enous or exogendog-enous BDNF on LTP (Chen et al., 1999; Krama´r et
al., 2004; Fontinha et al., 2008). To evaluate the influence of lipid
raft disruption on the facilitatory effect of BDNF on LTP, MCD
was used at a low concentration to avoid marked changes in
synaptic integrity that could cause alterations in the synaptic
plasticity phenomena. Hippocampal slices were incubated with
MCD (1 m
M) for 30 min before and during the entire LTP
experiment. At this concentration, MCD had a very mild effect
on basal synaptic transmission (
⫺4.6 ⫾ 0.4%), as shown in
Fig-ure 10 B. Furthermore, in M
CD-treated slices, the magnitude of
LTP was similar to what was observed in other slices in the
ab-sence of MCD (Fig. 10H, open bars). Most importantly, the
magnitude of LTP in two consecutive pathways on the same slice
(see Materials and Methods) was similar in the presence of
M
CD throughout the entire LTP-inducing protocol ( p ⬎ 0.05,
n
⫽ 3) (Fig. 10C). This allowed us to study the modulatory role of
BDNF on LTP in slices that were perfused with M
CD
through-out the entire recording period. To evaluate the effect of
BDNF on LTP, we compared the magnitude of LTP in the first
pathway (in the absence of BDNF) with that in the second
pathway (in the presence of BDNF), in the same slice. The
effect of BDNF on LTP in the absence or presence of M
CD
was then compared.
A
B
C
Figure 8. BDNF increases glutamate release in an adenosine- and lipid raft-dependent manner. A, Averaged time course of [3H]
glutamate release from cortical synaptosomes. Synaptosomes were labeled with [3H] glutamate, and stimulation of
neurotrans-mitter release was induced twice, at 5–7 min (S1) and 29 –31 min (S2), as described in Materials and Methods. Samples were
collected every 2 min. BDNF (20 ng/ml) was added at 9 min and remained in the perfusion solution until the end of the experiments (closed circles). Control curves in the absence of any drug, performed in parallel with the same synaptosomal batch, are represented by the open circles. B, C, S2/S1ratios, calculated in each experiment from the time course curves, as described in Materials and
Methods. BDNF (20 ng/ml) was tested in the presence/absence of 1 U/ml ADA, 1 mMMCD, or 2 U/ml cholesterol oxidase
(Chol.Oxi.), as indicated below each bar. In each experiment, the S2/S1ratio obtained while BDNF was present during S2was
normalized, taking as 100% the S2/S1ratio obtained in parallel chambers under the same drug conditions but in the absence of
BDNF. Data are represented as mean⫾ SEM of three to six independent experiments. *p ⬍ 0.05; **p ⬍ 0.01; ***p ⬍ 0.001, compared with 100%, except when otherwise indicated.
As expected from previous reports (Fontinha et al., 2008),
BDNF (20 ng/ml) enhanced ( p
⬍ 0.05, n ⫽ 6) (Fig. 10D,H) the
magnitude of LTP in control slices (Fig. 10 D). In contrast, in
MCD-treated slices, the facilitatory effect of BDNF on LTP was
not observed ( p
⬎ 0.05, n ⫽ 5) (Fig. 10E,H), indicating that lipid
raft integrity is necessary for the facilitatory actions of BDNF on
hippocampal synaptic plasticity.
Discussion
The main finding of the present work is that adenosine A
2Are-ceptor activation increases the levels of TrkB rere-ceptors in lipid
rafts and potentiates BDNF-induced TrkB phosphorylation in
these membrane microdomains. Furthermore, relevant actions
of BDNF at synapses, such as facilitation of glutamate release and
synaptic plasticity, require both lipid raft integrity and A
2Arecep-tor activation. Altogether, our data suggest that A
2Areceptors
contribute to the translocation of TrkB receptors toward specific
membrane areas where TrkB activation and subsequent signaling
occurs. Noteworthy, this is the first evidence for
BDNF-independent TrkB translocation to lipid rafts.
Active A
2Areceptors were not required for BDNF-induced
recruitment of TrkB receptors, since the presence of an A
2Are-ceptor antagonist did not influence BDNF-induced translocation
to lipid rafts. Furthermore, the effects of the A
2Areceptor agonist
and of BDNF on TrkB translocation were additive. Inhibition of
clathrin-dependent endocytosis with MDC did not influence the
action of the A
2Areceptor agonist, but significantly reduced
BDNF-induced TrkB translocation to lipid rafts. Together, these
results strongly suggest that A
2Aagonists and BDNF act through
different mechanisms to recruit TrkB receptors to lipid rafts.
We observed that incubation of cells with BDNF for 5 min did
not recruit detectable amounts of TrkB receptors to lipid rafts;
however, under the same conditions, we could detect pTrkB
staining in these microdomains. This suggests that either BDNF
phosphorylates a small amount of TrkB receptors already present
in the lipid rafts and/or that BDNF-induced translocation of
pTrkB was not detectable in the analysis of total TrkB receptors.
Adenosine A
2Areceptor activation markedly increased the levels
of TrkB receptors in the lipid rafts and potentiated
BDNF-induced pTrkB staining in lipid rafts from cells incubated for a
short period (5 min) with BDNF. It is possible that the increased
concentration of TrkB receptors in lipid rafts induced by CGS
21680 leads to increased proximity and autophosphorylation of
TrkB receptors not fully phosphorylated by a short BDNF
expo-sure. In contrast, after BDNF treatment for 40 min TrkB
localiza-tion in lipid rafts is already high and probably maximally
activated. Accordingly, a further increase in TrkB concentration
in these membrane domains induced by A
2Areceptor activation
did not change the proportion of pTrkB (as a function of total
TrkB receptors) in lipid rafts. However, the total amount of
pTrkB receptors was higher in cells incubated for 40 min with
BDNF in the presence of the A
2Aagonist. Altogether, the data
suggest that activation of A
2Areceptors per se induces
transloca-tion to lipid rafts of TrkB receptors that are prone to be
phos-phorylated by BDNF. Additionally, A
2Areceptor-induced
clustering of TrkB receptors in lipid rafts may play a role in the
facilitatory effects of A
2Aagonists on TrkB receptor function at
synapses, since BDNF-induced TrkB phosphorylation in lipid
rafts may be facilitated as a consequence of increased receptor
proximity.
It is unlikely that the influence of A
2Areceptors on TrkB
trans-location is due to a facilitation of endogenous BDNF actions or
TrkB transactivation. This conclusion is supported by the lack of
detectable amounts of pTrkB receptors in lysates or in lipid rafts
isolated from cells incubated with the A
2Areceptor agonist (Fig.
1), whereas pTrkB receptors could be detected in lipid rafts
iso-lated from cells incubated with BDNF. Furthermore, the
inhibi-tor of clathrin-dependent endocytosis, MDC, differently affects
BDNF-induced and CGS21680-induced TrkB translocation.
Moreover, transactivation of TrkB receptors, i.e.,
phosphoryla-tion of TrkB receptors in the absence of BDNF, requires
pro-longed (2–3 h) exposure to A
2Areceptor agonists and mostly
involves intracellular TrkB receptors (Lee and Chao, 2001;
Rajagopal et al., 2004).
Although MDC treatment significantly attenuated
BDNF-induced TrkB translocation to lipid rafts, some receptors were
still recruited by BDNF in the presence of MDC. This may suggest
that BDNF is able to recruit some TrkB receptors to lipid rafts
independently of internalization through clathrin-coated pits.
Figure 9. High-frequency stimulation of hippocampal slices induces TrkB translocation and increases pTrk staining in lipid rafts in an adenosine-dependent manner. Hippocampal slices were superfused with 1 U/ml ADA, where indicated, 30 min before the high-frequency stimu-lation (HFS). HFS was applied for 1 min as described in Materials and Methods, and after 30 min slices were homogenized and lipid rafts were isolated by discontinuous Optiprep gradients. A, Fraction 2, containing lipid raft membranes, was immunoblotted for TrkB, pTrk, and Fyn, which was used as a loading control. B, Quantifications of fraction 2 TrkB/fraction 2 Fyn. C, Quantifi-cations of fraction 2 pTrk/fraction 2 Fyn. Data are represented as mean⫾ SEM of six indepen-dent experiments. *p⬍ 0.05, **p ⬍ 0.01, compared with 100%.
Alternatively, MDC treatment may not
have fully inhibited clathrin-dependent
endocytosis and/or compensatory
mech-anisms of receptor internalization may
ac-count for the effect of BDNF observed in
the presence of MDC.
Neither BDNF nor A
2Areceptor
acti-vation induced translocation of the
trun-cated TrkB receptors to lipid rafts,
suggesting that A
2Areceptors act on the
intracellular domain of TrkB receptors to
induce its recruitment to lipid rafts. The
tyrosine kinase Fyn is possibly one of the
mediators, as inhibition of Src-family
ki-nases prevented the influence of A
2Are-ceptors on TrkB translocation. Indeed,
Fyn can be activated by A
2Aagonists, and
it is known that Fyn is required for TrkB
localization in lipid rafts (Rajagopal and
Chao, 2006; Pereira and Chao, 2007). The
requirement of cAMP for the effect of
CGS 21680 on TrkB translocation
sug-gests that A
2Areceptors are operating
through the adenylyl cyclase/cAMP
transduction pathway. Accordingly, the
adenylyl cyclase activator forskolin
mimicked the effect of the A
2Areceptor
agonist on TrkB translocation.
Modifications of the cholesterol
con-tent in the cells by treatment with a
cholesterol-chelating compound, such as
MCD, or by the addition of cholesterol
fully prevented the effects of A
2Areceptor
agonists on TrkB translocation to lipid
rafts, indicating the need of optimal
cho-lesterol levels for this process. When cells
were loaded with excess cholesterol, TrkB
localization in lipid rafts was increased,
possibly due to alterations in size and/or
properties of the lipid rafts. This may
in-fluence TrkB partition on different
mem-brane domains, affecting the ability of A
2Areceptors to modulate their translocation.
Excess cholesterol, however, did not
in-crease BDNF-induced glutamate release,
which further supports the concept of a
tightly regulated cholesterol
concentra-tion in the lipid rafts for optimal particoncentra-tion
of proteins among these domains.
As previously observed in cultured
neurons (Suzuki et al., 2004), the
facilita-tory effect of BDNF on glutamate release
from acutely isolated nerve endings was
affected by lipid raft disruption.
More-over, we showed that lipid raft-disturbing drugs also prevent the
facilitatory action of BDNF on LTP. Additionally, removal of
endogenous extracellular adenosine or blockade of A
2Areceptors
prevented BDNF actions on glutamate release (present work),
syn-aptic transmission, and LTP (Dio´genes et al., 2004, 2007; Fontinha et
al., 2008). Together, this evidence strongly suggests that the
facilita-tory action of BDNF at glutamatergic synapses requires lipid raft
integrity as well as the presence of extracellular adenosine and A
2Areceptor activation.
As occurs with A
2Areceptor agonists (Dio´genes et al., 2004;
Fontinha et al., 2008) and cAMP (Boulanger and Poo, 1999b),
high-frequency neuronal firing triggers facilitatory actions of
BDNF at excitatory synapses (Figurov et al., 1996; Boulanger and
Poo, 1999b; Nagappan and Lu, 2005; Matsumoto et al., 2006).
We therefore investigated whether TrkB receptors could be
tar-geted to lipid rafts as a consequence of intense synaptic activity.
We observed that high-frequency stimulation of hippocampal
slices results in a higher density of both TrkB and pTrkB receptors
A
B
D
F
G
E
H
C
Figure 10. BDNF enhances long-term potentiation in a lipid raft-dependent manner. A, Schematic representation of a trans-verse hippocampal slice with the electrode configuration used to record fEPSPs in the CA1 apical dendritic layer (stratum radiatum) evoked by electric stimulation of two independent pathways of the Schaffer fibers, S0and S1. B–E, Averaged time course changes
in the fEPSP slope. The small inhibition of fEPSP caused by 1 mMMCD is illustrated in B. C–E, Changes in the fEPSP slope induced
by the theta burst (-burst)stimulationofslices(seeMaterialsandMethods),asindicatedbythearrowineachpanel.Zeropercent corresponds to the averaged slopes recorded for 10 min before MCD (B: before MCD, ⫺0.55 ⫾ 0.02 mV/ms; after MCD, ⫺0.51⫾0.01mV/ms;n⫽7)orthetaburststimulation(C:E,⫺0.49⫾0.02mV/ms;F,⫺0.49⫾0.02mV/ms;n⫽3;D:E, ⫺0.52⫾0.01mV/ms;F,⫺0.49⫾0.04mV/ms;n⫽4;E:E,⫺0.49⫾0.01mV/ms;F,⫺0.47⫾0.01mV/ms;n⫽4).F,G, recordings from representative experiments, where each trace represents the average of eight consecutive responses obtained before and after LTP induction, in the absence (F, left) or presence of BDNF (F, right), or in the presence of MCD (G, left) or MCD ⫹ BDNF (G, right). Recordings under same-day conditions, but before and 60 min after LTP induction are superimposed; recordings obtained before LTP are indicated by the dotted lines. All recordings in F were obtained from a single slice at the points indicated in D. All recordings in G were obtained from a single slice at the points indicated in E. Each recording is composed of the stimulus artifact, followed by the presynaptic volley, and the fEPSP. H, Comparison of the effect of BDNF on LTP in the absence or presence of MCD, as indicated. *p ⬍ 0.05, compared with the first column.

![Figure 8. BDNF increases glutamate release in an adenosine- and lipid raft-dependent manner.A, Averaged time course of [ 3 H]](https://thumb-eu.123doks.com/thumbv2/123dok_br/18154540.872290/9.877.326.805.93.541/figure-increases-glutamate-release-adenosine-dependent-manner-averaged.webp)