Faculdade de Ciências e Tecnologia
Departamento de Informática
Dissertação de Mestrado
Mestrado em Engenharia Informática
4Sensing - Decentralized Processing
for Participatory Sensing Data
(Heitor José Simões Baptista Ferreira nº 29207)
Faculdade de Ciências e Tecnologia
Departamento de Informática
Dissertação de Mestrado
4Sensing - Decentralized Processing for Participatory Sensing
Data
(Heitor José Simões Baptista Ferreira nº 29207)
Orientador:
Prof. Doutor Sérgio Marco Duarte
Co-orientador:
Prof. Doutor Nuno Manuel Ribeiro Preguiça
Trabalho apresentado no âmbito do Mestrado em Engen-haria Informática, como requisito parcial para obtenção do grau de Mestre em Engenharia Informática.
I would like to express my sincere gratitude to all those that contributed to this dissertation: First of all I would like to thank Professor Sérgio Duarte and Professor Nuno Preguiça for their attentive supervision and clear-minded guidance without whom this work would not be possible.
My thanks also go to my colleagues and Professors in DI/FCT/UNL for the friendly and supportive environment that made my stay in this Faculty enjoyable and productive.
I am also deeply grateful to my family and friends for all the support, encouragement and helping me keep a good sanity level.
Finally, I want to acknowledge the support from the project PTDC/EIA/76114/2006, Live-Feeds - Disseminação P2P de Conteúdos Web Syndication, that funded part of this work.
Participatory sensing representa um novo paradigma aplicacional, impulsionado por factores sociais e tecnológicos, que ganha actualmente importância como domínio de investigação. A sua aplicação é potenciada pela crescente disponibilidade de telemóveis equipados com sen-sores, como a câmara, GPS e acelerómetro, permitindo a aquisição e agregação de dados por iniciativa de um conjunto de utilizadores, cobrindo áreas alargadas sem os custos associados a uma rede de sensores de larga escala.
Embora exista um conjunto significativo de trabalhos de investigação nesta área, as soluções apresentadas assentam normalmente sobre sistemas centralizados. Nem sempre esta é uma abordagem indicada para este tipo de aplicações, por implicar o armazenamento de dados pri-vados sob um único domínio administrativo e também pelos custos financeiros que exige não serem adequados a iniciativas comunitárias.
Esta dissertação foca os aspectos da gestão de dados em aplicações participatory sensing
sobre uma infra-estrutura distribuída - e em particular o seu processamento - tomando em conta áreas relacionadas como redes de sensores, gestão de dados em sistemas peer-to-peer e pro-cessamento destreams. A solução apresentada aborda um conjunto de requisitos comuns de gestão de dados, desde a aquisição, processamento, armazenamento e pesquisa com o objectivo de facilitar o desenvolvimento de aplicações.
São propostas três arquitecturas alternativas - RTree, QTree e NTree - avaliadas compa-rativamente utilizando um caso de estudo - SpeedSense, uma aplicação que agrega dados de dispositivos móveis equipados com GPS, permitindo a monitorização e previsão do estado do trânsito num cenário urbano.
Palavras-chave: Sensoriamento participativo, processamento distribuído, data streaming, computação móvel
Participatory sensingis a new application paradigm, stemming from both technical and social drives, which is currently gaining momentum as a research domain. It leverages the growing adoption of mobile phones equipped with sensors, such as camera, GPS and accelerometer, en-abling users to collect and aggregate data, covering a wide area without incurring in the costs associated with a large-scale sensor network.
Related research in participatory sensing usually proposes an architecture based on a central-ized back-end. Centralcentral-ized solutions raise a set of issues. On one side, there is the implications of having a centralized repository hosting privacy sensitive information. On the other side, this centralized model has financial costs that can discourage grassroots initiatives.
This dissertation focuses on the data management aspects of a decentralized infrastructure for the support of participatory sensing applications, leveraging the body of work on participa-tory sensing and related areas, such as wireless and internet-wide sensor networks, peer-to-peer data management and stream processing. It proposes a framework covering a common set of data management requirements from data acquisition, to processing, storage and querying -with the goal of lowering the barrier for the development and deployment of applications.
Alternative architectural approaches - RTree, QTree and NTree - are proposed and evaluated experimentally in the context of a case-study application - SpeedSense - supporting the moni-toring and prediction of traffic conditions, through the collection of speed and location samples in an urban setting, using GPS equipped mobile phones.
Keywords: Participatory sensing, decentralized processing, data streaming, mobile comput-ing.
1 Introduction 1
1.1 Data Commons 2
1.2 Applications 2
1.2.1 Transportation 2
1.2.2 Mapping 3
1.2.3 Environment 3
1.2.4 Citizenship and Crisis Response 3
1.2.5 Entertainment 4
1.3 Problem Definition and Goals 4
1.4 Main Contributions 6
1.5 Document Structure 6
2 Models 7
2.0.1 Architecture 7
2.0.1.1 Core Services 7
2.0.1.2 Applications 8
2.0.2 Example Applications 8
2.0.2.1 SpeedSense 9
2.0.2.2 NoiseMap 9
2.0.2.3 PotholePatrol 9
2.1 Data Model 9
2.1.1 Data Representation 9
2.1.2 Streams 10
2.1.3 Data Acquisition 10
2.1.3.1 Sensor 10
2.1.3.2 Quality of Service 11
2.1.3.3 Sampling Modality 11
2.1.3.4 Sensor Tasking 11
2.1.3.5 Longevity 11
2.1.4 Virtual Tables 12
2.1.5 Queries 13
2.2 Pipeline Model 14
2.2.1 Stream Operators 14
2.2.1.1 Processor 14
2.2.1.2 GroupBy 15
2.2.1.3 TimeWindow 16
2.2.1.4 Set 16
2.2.1.5 Aggregator 16
2.2.2 Pipeline Structure 16
2.2.3 Classification and Filtering 17
2.3 Distribution Model 19
2.3.1 Persistence 21
2.3.2 Continuous Processing 21
2.3.3 Historical Processing 22
2.3.4 Virtual Table Derivation 22
2.4 Distribution Strategy 23
2.4.1 Homebase 23
2.4.2 Data Acquisition 24
2.4.3 Query Dissemination and Control 24
2.4.4 Query Processing 24
2.4.5 RTree 25
2.4.5.1 Data Acquisition 25
2.4.5.2 Query Dissemination 25
2.4.5.3 Query Processing 25
2.4.5.4 Persistence 26
2.4.5.5 Network Model 26
2.4.5.6 Network Dynamism 27
2.4.5.7 Overlapping Queries 27
2.4.6 QTree 27
2.4.6.1 Data Acquisition 28
2.4.6.2 Query Dissemination 29
2.4.6.3 Query Processing 29
2.4.6.4 Persistence 30
2.4.6.5 Network Model 30
2.4.6.6 Network Dynamism 31
2.4.6.7 Overlapping Queries 32
2.4.7 NTree 32
2.4.7.1 Data Acquisition 32
2.4.7.2 Query Dissemination 32
2.4.7.3 Data Aggregation 33
2.4.7.4 Multi-Level Aggregation 34
2.4.7.5 Persistence 35
2.4.7.6 Network Model 35
2.4.7.7 Network Dynamism 35
3 Prototype 37
3.1 Development Platform 37
3.2 Scope 37
3.3 Fixed Node Architecture 38
3.4 Virtual Table Services 39
3.4.1 Data Representation 39
3.4.2 Virtual Table Definition 40
3.4.2.1 Virtual Table Manager 41
3.4.3 Pipeline Component 42
3.4.4 Component Library 42
3.4.4.1 Processor 43
3.4.4.2 Triggered and Periodic Processors 44
3.4.4.3 Filter 45
3.4.4.4 Classifier 45
3.4.4.5 GroupBy 45
3.4.4.6 TimeWindow 46
3.4.4.7 Set 46
3.4.4.8 Aggregator 46
3.4.5 Pipeline Structure and Operation 47
3.4.5.1 Pipeline Assembly 48
3.5 Query Services 49
3.5.1 Query Interface 49
3.5.2 Query Setup and Processing 50
3.5.3 Query Execution 50
3.6 Network Services 51
3.7 Acquisition Services 52
4 Case Study and Experimental Evaluation 53
4.1 SpeedSense Application 53
4.1.1 Road Network Model 53
4.1.2 Data Acquisition and Mapping 54
4.1.3 TrafficSpeed 54
4.1.4 TrafficHotspots 56
4.2 Simulation 56
4.2.1 Traffic Model 57
4.2.2 Infrastructure 57
4.3 Experimental Evaluation 58
4.3.1 Acquisition Workload 59
4.3.2 Aggregation Load 60
4.3.3 Total Workload 62
4.3.5 Communication Load 65
4.3.6 Summary 67
5 Related Work 69
5.1 Data Management in Participatory Sensing 69
5.1.1 Infrastructure 69
5.1.2 Heterogeneous Sensors 70
5.1.3 Data Placement 70
5.1.4 Social Domain and Data Granularity 71
5.1.5 Querying 72
5.1.6 Processing 73
5.1.7 Data Aging 74
5.1.8 Privacy 75
5.2 Selected Works 76
5.2.1 MetroSense 76
5.2.2 CarTel 77
5.2.3 BikeNet 79
5.2.4 IrisNet 80
5.2.5 PoolView 82
5.2.6 Distributed Spatial Indexes 83
6 Conclusions and Future Work 85
6.1 Model 85
6.2 Distribution Strategy 86
6.3 Future Work 87
2.1 High-level Architecture 8
2.2 TrafficSpeed pipeline 17
2.3 TrafficSpeed distributed pipeline 21
2.4 RTree aggregation 26
2.5 Spatial subdivision in QTree with minimum occupancy of 2 nodes 28
2.6 Query dissemination and processing 29
2.7 QTree aggregation 30
2.8 Routing information in QTree 31
2.9 NTree data space partitioning 33
2.10 NTree aggregation 34
3.1 Fixed Node Runtime 38
3.2 Main Data Flows 39
3.3 Query Dissemination tree in RTree and NTree 51
4.1 Lisbon map rendering from OSM data 54
4.2 Traffic simulation 58
4.3 Acquisition Workload - 50 Nodes (Q1 and Q2) 59
4.4 Acquisition Workload - Q1 (50 and 500 nodes) 60
4.5 Aggregation Workload - 50 Nodes (Q1 and Q2) 61
4.6 Aggregation Workload - Q1 (50 and 500 nodes) 62
4.7 Total Workload - 50 Nodes (Q1 and Q2) 63
4.8 Total Workload - Q1 (50 and 500 nodes) 63
4.9 Detection Latency 64
4.10 Communication Load 66
5.1 Example exchange between a sensor and content consumer in Partisans [12] 73
5.2 Cartel system architecture [24] 78
5.3 BikeNet system overview [10] 79
5.4 A query processing example in IrisNet [19] 81
As the Web 2.0 paradigm emerged, with flagship services such as Wikipedia, YouTube and blogging, collaboration between global communities of Internet users started taking shape. The essential outcome was the dilution of the previously well established frontiers between content publishers and consumers. User generated content became the norm instead of the exception, as a reflection of a general need for communities to create their own discourse and meaning, instead of relying on the "ivory tower" of rooted institutions.
More recently, the principles that shaped Web 2.0 started spreading beyond culture to cit-izenship and government. The new discourse on data transparency, participation and collabo-ration on the public affairs, supported by networked services and applications, demonstrate the willingness for citizens to have an active role in shaping their lives and their community.
An essential outcome of these movements is the collaborative creation of new data sources that can be analyzed, mixed and visualized, creating new interpretations and new services. Par-ticipatory sensingtaps into this fertile ground and adds a mix of new technologies, allowing rich information to be extracted from the physical world. Multiple sensors are now commonly present in consumer electronics devices, thanks to miniaturization and commoditization. Mo-bile phones, in particular, have evolved into a generic computing platform and can now integrate a growing array of sensors, from camera, sound recorder and GPS, to accelerometer and prox-imity sensors. Together with their data communication capabilities, this makes these devices specially convenient to create advanced mobile sensing networks. Sensor readings can be com-bined and processed to create rich context information, such as user activity. Data from multiple sources can be aggregated, leveraging the massive adoption of mobile phones, to create a de-tailed view of physical reality over a wide area. Given its opportunistic nature, leveraging users inherent mobility and daily activities, this detailed view is possible without the prohibitive costs associated with the explicit deployment of a dense, wide area, sensing infrastructure. Emergent subjects, such as open-source hardware, personal fabrication and the DIY1 culture expand the range of possibilities (even beyond the atmosphere, given the successful DIY explorations with weather balloons at 30km altitude [25, 49]). The expected outcome from this new paradigm is the creation of rich data sets, a data commons, supporting new services, discourses and inter-pretations.
The following sections will give further context on the subject; Section 1.1 discusses the conditions for a successful implementation of a data commons stemming from participatory sensingapplications. Section 1.2, presents some deployed services and applications that illus-trate the principles described in this introduction.
1Do-It-Yourself
1.1
Data Commons
In essence,participatory sensingpotentiates the construction of a new data commons, built from the decentralized collection of data by citizens participating in urban sensing networks. It facil-itates open grassroots collaboration for the construction of meaning through data visualization, analysis and interrelation (mashups), crossing domains such as science, politics, citizenship and art. This data commons can be seen as a source for new public discourses over the previously invisible and for new forms of engagement in the public domain [7].
The successful establishment of this data commons requires a well designed ecosystem spanning technical, legal and social spheres. As the application domains shift from the scientific to the public realm and, consequently, the control model shifts form centralised to distributed, the new urban and participatory scenario for sensor networks raises new questions regarding the reliability of collected data and interpretation, as well as its social impact. Answers to data reliability can be endemic to the system, by using redundancy and agreement to filter out spurious data. Interpretation reliability could stem from an open "peer review" model, by providing discussion mechanisms and encouraging critical practices. A proper Intellectual Property rights framework should be put in place to spur innovation (similar in spirit to the Creative Commons approach for creative content)
Central to the successful growth of a data commons is the lowering of entry barriers that can alienate participation and innovation. Privacy concerns should be mitigated by the application of appropriate computer security, anonymization techniques and control over data granularity. An open infrastructure should facilitate the discovery, aggregation and republication of data sources to create new integrated analysis and visualizations. Finally, supporting frameworks and devel-opment models should reduce barriers represented by develdevel-opment efforts and infrastructural costs, while fluid user interfaces should facilitate active participation on data collection.
1.2
Applications
The purpose of this section is to briefly showcase some real-world examples illustrating princi-ples of (or related to)participatory sensing. Applications were chosen from academia, industry or community efforts, covering a wide spectrum of subjects, with the sole requirements that they represent services already deployed or being rolled-out.
1.2.1 Transportation
of the Mobile Millennium user base.
1.2.2 Mapping
The OpenStreetMap project [43] provides free geographic data, such as street maps and points of interest. The motivation underlaying the project stems from the legal and technical re-strictions subjacent to the available commercial services. Map data is gathered by the Open-StreetMap community, using simple equipment, such as GPS devices or GPS equipped mobile phones. Other sources of data include public domain aerial or satellite imagery, or even simple hand drawn maps [9]. On the aftermath of the Haiti earthquake of January 2010, a collaborative effort of hundreds of OpenStreeMap users resulted in the production, in 48 hours, of a detailed map of the affected areas that was used by search and rescue team on the ground [1, 42].
1.2.3 Environment
Four UK universities, led by the Imperial College London, launched recently a trial throughout UK for urban pollution monitoring using mobile and static sensors [2]. Small "electrochemical cells" can be carried by pedestrians and use their mobile phone for data upload. Heavier devices are designed to be deployed in cars or buses and also use the mobile phone network. The goal of the project is to understand how traffic generated pollution behaves in the urban environment by generating high-resolution spatial-temporal pollution maps.
PEIR [41]- Personalized Estimates of Environmental Exposure and Impact - from the CENS group, UCLA, is an extension of the "footprint calculator" concept that uses GPS traces acquired from the end-user’s mobile phone and matches this information with several data sources, in-cluding weather conditions and estimated traffic patterns. PEIR produces estimates of personal impact and exposure in four categories, including smog exposure and carbon footprint impact.
The Gulf Oil Mapping project is an effort by the Grassroots Mapping global community [36] (partially funded by the Legatum Center and the Center for Future Civic Media at MIT). The project involves the use of helium balloons, kites and other inexpensive technology, such as common digital cameras, to produce aerial imagery covering the oil spill in the Gulf of Mexico. The produced imagery will be released to the public domain for environmental and legal use.
1.2.4 Citizenship and Crisis Response
FixMyStreet [14] and SeeClickFix [47] are community services that allow users to report issues on public spaces with the intention to raise awareness, discuss and to prompt corrective measures. With FixMyStreet, based in the UK, users can report problems using a web interface or an iPhone (using the embedded camera and GPS), that are then forwarded by email to the local councils. SeeClixFix, based in the US, has a similar spirit, but acts as a broker between citizens, government and interested organizations. Users can report problems on a particular location, officials or organizations can create a watch area and be notified when problems are reported within that area.
1.2.5 Entertainment
CitySense [6], by Sense Networks, allows mobile phone users to locate night-life hot-spots in the San Francisco area. Years of historical localization data have been collected and analyzed to create a baseline of normal city activity. Using this baseline, real-time location data is used to infer and display unusually high activity areas, allowing users to find out where everyone is going. Besides, CitySense collects GPS data to infer behavior patterns, classifying users into "tribes" to produce (in a future version) a personalized night-life activity map.
1.3
Problem Definition and Goals
Although significant case-studies have already been conducted regarding participatory sens-ing, the solutions exposed are typically tailored to their specific application domains or based on assumptions, regarding the support infrastructure, that may prove hard to materialize. Pro-posed infrastructures usually center around one of two extremes. On one side lies a centralized approach, where a central back-end services the mobile node base. On the other extreme, a peer-to-peer infrastructure is composed exclusively of mobile nodes that cooperate and share resources.
Both extremes have their motivations and advantages. However, they also have relevant shortcomings that limit their applicability. A centralized infrastructure has the advantage of being simpler in terms of development models, implementation of rich features, system main-tenance and security enforcement. On the downside, three aspects are particularly relevant for participatory sensing applications. The collection and storage of personal, privacy sensitive, information under the administration of a central entity has relevant privacy implications. The second aspect refers to the creation of data silos where a central entity, and not the end-user base, owns the data and determines the possible usages. Finally, a centralized infrastructure supporting a large scale deployment requires a financial backing, thus hindering an important class of applications, emerging from community needs, where infrastructural and financial re-sources are not readily available.
spontaneous ad-hoc networks, without requiring a central back-end. However, the inherent resource limitations of mobile devices, and the management overhead introduced by a peer-to-peer system, limits the applicability of these systems.
4Sensing explores an hybrid approach with the goal of overcoming the problems identified above. A mixed infrastructure, where mobile nodes are connected to fixed computers structured in a peer-to-peer overlay network has strong advantages. It can be composed exclusively of personal computing resources, thus supporting grassroots initiatives; resource-heavy operations can be delegated to the fixed infrastructure, thus overcoming the limitations of mobile devices, and data is decentralized and not owned by a single entity.
Developing applications in the context of this hybrid architecture poses specific challenges regarding all aspects of data management - from acquisition, to processing and persistence. 4Sensing addresses these challenges, with the goal of providing a framework and development model that supports, and simplifies, the development of a wide range of participatory sensing applications. With this purpose, a set of data management requirements have been identified:
Data acquisition Central to a data management system is the ability for applications to ex-press their data needs - in terms of required sensors, tasking modalities, sampling rates, and delivery modes - abstracting from specific sensor platforms and hardware. Besides, applications should be able to integrate domain specific data processing tasks, such as filtering and event detection.
Data processing and aggregation A data management framework has to support a wide range of data processing operations, where data processing refers to any transformation activ-ities, such as extraction of features, filtering, computation of higher level inferences and aggregation. Data aggregation has an important role in data reliability and accuracy, miti-gating the effect of spurious data. It also supports summarization of storage intensive raw data and the inference of relevant statistical trends.
Querying A querying model must provide a unified data view, abstracting the complexity of a distributed system from the querying model. The data management system must trans-parently route queries to the relevant data sources and deliver results without exposing the network structure to applications.
Persistence Data persistence is an important tool that supports the access to historical informa-tion, the creation of models for higher order inferences and the analysis of trends based on past data. Challenges related to persistence include the balanced sharing of storage resources, dealing with storage capacity limits, and the ability to find data efficiently.
1.4
Main Contributions
This dissertation proposes a distributed data management model for the generic support of par-ticipatory sensingapplications, with the following contributions:
• A generic framework supporting the data life-cycle of applications based on geo-referenced data;
• A flexible decentralized model for data processing leveraging the advantages of a hybrid fixed/mobile infrastructure;
• The development and comparative evaluation of three alternative models for data distri-bution in an hybrid infrastructure - RTree, QTree and NTree.
1.5
Document Structure
This document is structured around six chapters, whose content is described below:
Chapter 1 - Introduction Presents the context of the participatory sensing domain, the moti-vations and underlying goals of this work and its main contributions;
Chapter 2 - Models Describes the proposed models, focusing on the application architecture, the data modeling aspects, data processing and distribution. Finally, the three distribution strategies - RTree, QTree, NTree are discussed in detail;
Chapter 3 - Prototype Presents the 4Sensing prototype, describing the main architectural com-ponents;
Chapter 4 - Case Study and Experimental Evaluation Presents SpeedSense - the case-study application implemented in a simulation environment - and the experimental evaluation performed over this simulation;
Chapter 5 - Related Work Presents research work related to the theme of this dissertation. The chapter starts by presenting data management issues and approaches to those issues found in the literature; the second part discusses selected works in more detail;
4Sensing applications use sensor data gathered by a community of users, profiting from their inherent mobility, creating a global view that incorporates the individual contributions of each user into a meaningful service. From a functional perspective, it can be broken down into data
acquisition,aggregation, andusage. Data acquisition refers to the process through which sensor data is gathered, and aggregation generally refers to the combined processing of data acquired by individual users, subordinated to the particular application requirements. Usage comprises the modes of display and interaction over data, through visualization (e.g., the production of visual maps over a geographic region), services (e.g., planning efficient driving routes taking into account the expected traffic conditions) or publishing - allowing external applications to combine data produced by the application in new ways (applicationmashups).
Applications are community driven, in the sense that they are created, managed and used by a community of users that are actively engaged and have an expressed interest in the services provided. Although several applications share a common framework, and possibly, resources and data, each application is self-contained, and has a well-defined base of participants. Users explicitly opt-in to engage in particular applications for which they are willing to contribute sensor data and computing resources. Thisparticipatorymodel contrasts with anopportunistic
approach (see [31]), where users participate as members of a sensing infrastructure and have limited awareness and control over which applications they are actively engaged with.
2.0.1 Architecture
Applications are supported by a distributed system consisting of a high number of mobile nodes equipped with sensors, and a fixed support infrastructure. A mobile node can be any mobile computing platform, typically a mobile phone, and is expected to be a limited environment in terms of computing power and battery life. Mobile nodes are connected to a fixed infrastructure, composed by a set of nodes structured in an overlay network, that supports the more resource intensive operations, such as data processing, routing and storage. Fixed nodes can be personal computers, virtual machines running in a utility computing infrastructure, or servers hosted by independent entities. Applications are hosted in this hybrid environment, supported by a service middleware running in both mobile and fixed nodes.
2.0.1.1 Core Services
Core services refers to the set of services supporting the domain applications, providing a data management framework and abstracting the distributed nature of the underlying system. Ser-vices are supported through both a fixed middleware layer and a mobile counterpart hosted on mobile nodes, and are exposed to applications through well defined interfaces.
On the fixed infrastructure, core services implement a set of constructs that allow applica-tions to define their data acquisition, processing and querying requirements, while on the mobile
Routing Overlay
Mobile Node
Fixed Node
App 1 Ctx App 1 Client
App 2 Ctx
Core Services
App 2 Client
Core Services App 1 Ctx App 2 Ctx
Figure 2.1: High-level Architecture
side, core services support data acquisition. A querying interface is exposed in both the mobile and fixed counterparts.
2.0.1.2 Applications
Applications can be broken down into client and service components. A client implements a user interface, supporting the interaction between user and service. It can be hosted on a mobile or desktop environment and interacts with the service component through a query interface. Ap-plication services define the apAp-plication logic regarding the complete data lifecycle - how data is acquired, processed, queried and stored - using the constructs provided by the core services. Services are supported byapplication contextsdeployed on mobile and fixed components.
2.0.2 Example Applications
2.0.2.1 SpeedSense
SpeedSense - the case-study used in this dissertation - assists drivers in urban areas, such as the Lisbon metropolitan region. It receives GPS data collected by mobile phones, carried by the community of users while driving as part of their daily routines. Based on this information, SpeedSense can infer current and predicted traffic conditions, and provide a set of services including up-to-date average driving speeds, route planning, and travel time estimation.
2.0.2.2 NoiseMap
NoiseMap, is a mashup application that builds a map of estimated noise levels across a city, using data published by SpeedSense. Noise levels are based on car density and average speed, being classified as low, average and high. The noise map is obtained by dividing space using a regular grid, obtaining the car density and speed for each grid cell and computing a scalar speed level from these values. The noise level classification is obtained from this scalar value according to predefined thresholds.
2.0.2.3 PotholePatrol
The PotholePatrol example is inspired by thePothole Patrolsystem [11]. The application uses data gathered from accelerometer and GPS sensors mounted on motor vehicles to detect road hazards such as potholes. Given the high sampling rates required by the application, a pothole detection algorithm runs on the mobile nodes, providing potential pothole locations. Detections gathered from several nodes are clustered in order to filter out spurious detections that are not corroborated by a certain number of nodes.
2.1
Data Model
2.1.1 Data Representation
Applications collectrawdata from sensors embedded in mobile devices that can be encoded in a wide range of formats, such as scalar values, image, video, and sound recording. Aggregate values, inferences and event detections are examples ofderiveddata that applications represent and manipulate. In an abstract form, data can be modeled as a tuple with a particular structure or
2.1.2 Streams
4Sensing applications manage a continuous flow of data resulting from sensing and data pro-cessing activities. Generally, a stream is a sequence of data tuples with a common structure and semantic. Regarding its origin, adata acquisition streamis a tuple sequence produced by mobile nodes according to asensor definition (explained in Section 2.1.3). SpeedSense bases its inferences on a GPS data acquisition stream - the sequence of GPS readings acquired by mobile nodes. The stream of average speeds over a time period is aderived streamobtained by averaging GPS readings.
Orthogonal to this definition, alive streamis an unbounded tuple sequence, created as data is acquired and delivered to the system, while astored streamis a finite tuple sequence repre-senting the past of a live stream up to the present moment in time. The stored stream for GPS readings, in a given moment in time, contains all the GPS reading delivered before and up to that moment. Similarly, in PotholePatrol, a pothole detection live stream could be addressed, al-though it does not have a strong relevance for the application; PotholePatrol relies on the stored detection stream to implement its clustering algorithm.
2.1.3 Data Acquisition
In order to cater for a broad spectrum of application domains, an acquisition framework must be flexible and allow applications to specify suitable acquisition modalities. For this effect, an acquisition model defines a set of dimensions, described in the following sections, that together characterize how data is fetched and, possibly, persisted. Applications express these modali-ties throughsensor definitions. Table 2.1 presents example definitions for the SpeedSense and PotholePatrol applications.
Application QoS Sampling Tasking Longevity SpeedSense (GPSReading) online periodic query-driven volatile PotholePatrol (PotholeDetector) deferred event-based application-driven persistent
Table 2.1: Example sensor definitions
2.1.3.1 Sensor
2.1.3.2 Quality of Service
Relative to acquisition latency - i.e., the time a sample takes to become available in the fixed infrastructure - applications can operate in two modes. Inonlinedata acquisition, latency is low, so that data is ready for usage shortly after acquisition. This is a requirement for applications that monitor the evolution of a phenomena as it happens, as is the case in SpeedSense and NoiseMap. Typically, this approach involves short-lived data and long standing (continuous) queries, that result in a data stream reflecting an evolving reality.
Other applications may be able to operate under more relaxed delivery requirements, where continuous connectivity is not always available, or is too costly. In this case, applications can operate according to adeferreddata acquisition model. Deferred acquisition is associated with opportunistic or intermittent connectivity, or disconnected operation models, where there is an unbounded lag between acquisition and availability. These applications normally focus on phenomena that are less dynamic, or use data to infer trends instead of a recent state.
2.1.3.3 Sampling Modality
Sampling can be characterized as periodic orevent driven. In the former case, acquisition is parameterized by a sampling rate, while in the latter, a virtual sensor is responsible for identi-fying relevant occurrences - as is the case of the pothole detector in PotholePatrol. Events can also be explicitly produced by users, acting as virtual sensors, as in Microblog [18] where users proactively submit georeferenced multimedia content.
2.1.3.4 Sensor Tasking
Sensor tasking refers to the process through which applications control mobile sensor activity. Applications may require data from a subset of the available mobile nodes, depending on which queries they are currently running. Thisquery-driven acquisition is relevant for online traffic monitoring in SpeedSense, where it is more cost-effective to acquire speed samples only in areas that are actually being monitored. In PotholePatrol, acquisition is application-driven - data is considered relevant independently of the running queries. This is usually the case in applications that operate in a deferred mode - since there is a lag between acquisition and querying, it is not possible to determine a priori which sensors are relevant. But this is not necessarily the case - in BikeNet [10] users can issue queries to task remote sensors, while responses are delivered when possible, according to an opportunistic connectivity model.
2.1.3.5 Longevity
2.1.4 Virtual Tables
Similarly to the relational paradigm, where a data set with a common schema is represented by a relation, or table - in 4Sensing, applications model data according tovirtual tables. A virtual table specifies a derived stream in terms of one, or more, input streams - either a set of data acquisition streams or another virtual table - and a stream transformation. The term virtual is used here because it names a construct that has a dual nature, depending on how data is queried, providing a common abstraction over current and past data. Acontinuousquery over a virtual table will produce a live stream that reflects the most recent acquired data, while an historical
query results in replaying past data - the stored stream. Continuous and historical queries are discussed further in Section 2.1.5.
Virtual tables can specify a stream by direct derivation from one or more sensor definitions. To provide the current average speed per street segment, SpeedSense defines theTrafficSpeed
table, as presented in Listing 2.1. This table specifies the stream of the current average speed and car density, per street segment - a sequence of tuples with the structure (segmentId, avgSpeed,
density) - obtained by averaging the data obtained from theGPSRedingacquisition feed. Note that temporal and spatial metadata is not explicitly represented. Alternatively, a stream can be derived indirectly through another table; to implement route planning, SpeedSense needs to know only about the congested streets - i.e., streets where speed is below a given threshold - assuming an average speed where a congestion has not been detected. The TrafficHotspots
table serves this purpose. It specifies a stream, derived from TrafficSpeed, where each tuple represents a traffic detection event. Stream derivation from sensor definition and from a virtual table is represented respectively by thesensorInputandtableInput declarations in Listing 2.1. For simplicity, only single table derivation is considered although the model can be extended for multiple-table derivation.
Listing 2.1Examples of virtual tables and respective input definitions
TrafficSpeed(segmentId, avgSpeed, density)
sensorInput(GPSReading)
TrafficHotpots(segmentId, avgSpeed, confidence)
tableInput(TrafficSpeed)
TrafficTrends(segmentId, avgSpeed, confidence)
tableInput(TrafficHotspots, stored)
PotholeDetection(clusterId, confidence)
sensorInput(PotholeDetector, stored)
NoiseLevel(cellId, noiseLevel)
tableInput(TrafficSpeed)
NoiseTrends(cellId, noiseLevel)
SpeedSense also supports planing for routes that will take place in the future, based on predicted traffic speeds - for instance, a user could request the best route to the airport on a monday morning. For this effect, SpeedSense can use past data to predict future conditions. Past hotspot detections, which convey average speeds per street segment, can be retrieved from the
TrafficHostpotsstored stream.TrafficTrendsderives from this stream using thestoredmodifier. The table does not have a continuous semantic since it represents historical data.
In PotholeDetection, there is little interest in the online detection of street anomalies. To be considered potholes, detections have to be corroborated by several vehicles, which typically occur in several moments over time. ThePotholeDetectionstable specifies a stored stream - it represents confirmed detections, given the historic of individual detections. Again, in this case there is no continuous semantic.
NoiseMap can display both an up-to-date map of noise levels, or a trend map based on past inferences. The NoiseLevel table derives from TrafficSpeed, where tuples represent average noise levels per cell based on live speed and density data.NoiseTrendsspecifies a stored stream based on theNoiseLevelhistory.
In the context of a particular virtual table, a base stream refers to the original source of data tuples - either a live acquisition stream of a stored stream - TrafficSpeed and Traffi-cHotspotshave GPSReadingas their base stream, while TrafficTrendshas the TrafficHotspots
stored stream as its base.
2.1.5 Queries
Applications access data by issuing queries, which express constraints over virtual tables. A query generates a tuple stream produced by the target virtual table, resulting from the applica-tion of the query restricapplica-tions over its base stream.
Queries can be either continuous or historicalin terms of how they access virtual tables.
Continuous access characterizes the usage of data as soon as it is delivered - through a live stream. Typical usages involve online monitoring and event detection over a phenomena that is changing in time. On the other side,historicalqueries access stored streams and are suitable for the inference of trends and patterns from data related to the past.
Continuous queries specify a spatial constraint - an area of interest, such as rectangular bounding box. The result of this type of query is the tuple stream produced by the target virtual table, where each tuple reflects a particular moment in time and has an associated timestamp. Successive tuples may reflect changes in the monitored phenomena occurring during query evaluation.
the tuples stored inTrafficHotspotswith timestamps in the specified range are considered. The query model assumes that every data tuple has associated spatial metadata, so that query re-strictions can be applied. For the assumption to hold, the stream transformations defined by a virtual table must guarantee that the resulting tuples have spatial metadata - an issue that will be addressed in Section 2.2.2.
2.2
Pipeline Model
As described in Section 2.1.4, an application data model is defined through virtual tables, in terms of input streams and stream transformations. A stream transformation is the outcome of applying a set of operators over an input stream, resulting in a derived stream. This transfor-mation can be modeled as a sequence of operators (apipeline), each performing a specialized function. When a query is issued, the target table input streams are instantiated (possible in-volving the instantiation of source tables) and fed into the associated pipeline, where they are processed in sequence by each operator - transforming, aggregating, filtering and classifying data - the output of the pipeline becoming the result of the query.
2.2.1 Stream Operators
A stream operator performs a particular function, such as data partitioning, aggregation, fil-tering, computation of higher order inferences or event detection. Each operator receives a stream of data tuples, producing a derived stream that becomes the input of the next operator. Operators are parametrized by one or more input and output types - that specify the expected at-tributes. They can operate over each tuple individually or over finite tuple sequences, modeled as a stream terminated by an end-of-stream indicator. Finite sequences originate from stored streams or from the decomposition of a live stream through application of thetimeWindowand
set operators. Operators can be stateless or store state information that is maintained during query evaluation. Output can be immediately produced as the result of input transformation -this is usually the case for stateless operators - or deferred until a condition. A filtering operator can output data only when a particular attribute has changed significantly relatively to previous tuples, and an aggregation operator will produce an aggregate tuple that results from processing a tuple set. The specific operators are described in the following sections, Listing 2.2 shows their pseudo-code representation that will be used later when pipeline listings are presented.
2.2.1.1 Processor
Theprocessor operator is the main extension basis for implementation of application specific processing, such as datamappingand unit conversion. Another example would be an interpola-tion operator that, given GPS and accelerometer readings, produces a single tuple using linear interpolation.
Listing 2.2Pseudo-code representation for stream operators
process<inputT1,out putT1,. . . ,inputTn,out putTn>
(processingFunction1,. . . ,processingFunctionn)
filter<inputT>(f ilterCondition)
classify<inputT,out putT>(classi f icationCondition,classi f ierFunction)
groupBy<inputT>(partitioningCondition,subPipeline)
timeWindow<inputT>(size: <size>,slide: <slide>)
set<inputT>(mode: change | eos,partitioningCondition)
aggregate<inputT,out putT>(
min|max|count|sum|avg(attribute1,aggAttribute1)
. . .
min|max|count|sum|avg(attributen,aggAttributen)
)
a given condition is satisfied. In particular, input can be forwarded only if a given attribute has changes above a given threshold in relation to the last output. Aclassifier is used to generate inferences from aggregated data. It applies an application specific condition to an input tuple and forwards a classification tuple if this condition is satisfied. Classification and filtering is further discussed in 2.2.3
2.2.1.2 GroupBy
ThegroupBy operator partitions data according to a set of tuple attributes, or any partitioning condition, producing a set of independent data streams. This construct can be used to maintain independent state data for the partitioned streams, as in grouped aggregation, and can be ex-plored to support parallel processing of partitioned streams. Besides the partitioning condition,
groupBydefines a sequence of operators to process each of the independent streams modeled as a sub-pipeline. For simplicity this sub-pipeline is assumed to be a linear sequence of stream transformations not including itself agroupByoperator.
2.2.1.3 TimeWindow
Continuous query can be used to compute an aggregate value over the whole execution time - for instance, to compute the average speed over a 30 minute period - but more frequently, applications are interested in receiving updates on the current state of the monitored phenomena - such as the current average speed. AtimeWindowcan be used for this effect, by decomposing a input stream into a sequence of time periods.
AtimeWindowis defined in terms of size and slide parameters. The window size defines the length, in seconds, of the window extent, while the slide parameter defines the temporal relation between successive extents. A window with a size of 15 seconds and slide of 10 seconds will output a tuple set received in the last 15 seconds, every 10 seconds. The window assumes that data is received with limited jitter i.e. the difference in arrival time between two tuples is approximately the same as the difference between their timestamps.
2.2.1.4 Set
Set operates by placing input tuples into buckets according to a partitioning function, or at-tribute, each bucket storing the most recent tuple received. For instance, using a segment iden-tifier as the partitioning attribute for a set operator results in the set of most recent tuples for distinct segments How the tuple set is forwarded depends on its parametrization. When op-erating in change mode - usually as part of a continuous pipeline - the tuple set is forwarded whenever it changes, i.e., when a new input is received (in this case,set has the semantic to a
partitioned windowwith one row in CQL [3]). Ineosmode - as part of an historical pipeline or preceded by atimeWindow- a set is forwarded only when aend-of-streamindicator is received.
2.2.1.5 Aggregator
Anaggregator operates over a finite tuple sequence. Its output results from the application of aggregation operations over one or more input attributes of the input sequence. Aggregation operations - maximum, minimum, count, sum and average - specify an input attribute and the resulting aggregate attribute.
2.2.2 Pipeline Structure
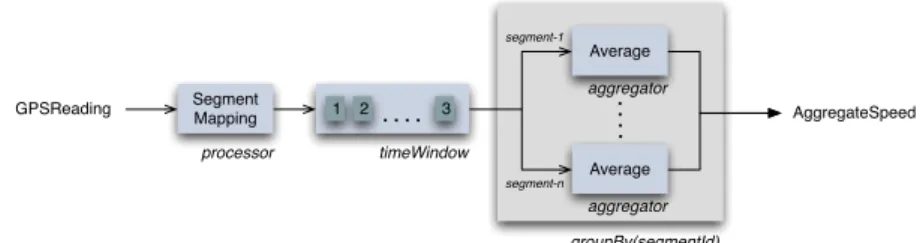
Aggregation usually involves an initialgroupBypartitioning operation, so that related data can be meaningfully aggregated together. A previous operation may be necessary to classify data into related groups - such as street segments or cells in a regular grid - an operation referred as mapping. Mapping associates data with the spatial extent of the partition and possibly a partition identifier used as thegroupBypartitioning condition.
broken down into window extents by thetimeWindow operator,groupBypartitions the stream based on the segment identifier, andaggregateaverages all tuples in each sub-stream, produc-ing averages every 10 seconds - Figure 2.2 shows a graphical representation of theTrafficSpeed
pipeline. TrafficTrendsis sourced with theTrafficSpeedstored stream, restricted by the tempo-ral restrictions stated on the query. The rest of the pipeline is equivalent to the continuous case except for not using a window, resulting in anAggregateSpeedtuple for each segment followed byend-of-stream. The second historical case,TraficTrendsHour, shows how mapping and par-titioning can be used in the time domain to compute average segment speeds per hour of the day.
Segment
Mapping 1 2 3
Average
Average
AggregateSpeed
processor timeWindow
aggregator
aggregator
groupBy(segmentId)
segment-1
segment-n
GPSReading
Figure 2.2: TrafficSpeed pipeline
As referred in Section 2.1.5, stream transformations have to guarantee that resulting tuples have associated spatial metadata. For this to hold true, the aggregation operator has to assign a spatial extent to its output. The spatial extent is already present in each individual tuple, given by the mapping operation, the same extent is then assigned to the aggregate value. But mapping on the spatial domain is not mandatory. Consider, for instance, that NosieMap supports querying for an overall noise level in a particular area, instead of a grid. In this case, it would average speed and car density for all street segments bounded by the query area. Since there is no stream partitioning based on spatial extent, the aggregation operation will receive tuple sets with different extents. In this case, the spatial extent of the aggregated values is the area of query, which is consistent with the query semantic. In a continuous query, tuples also have a temporal dimension. In this case, the aggregator assigns the maximum timestamp on the window extent to its output.
2.2.3 Classification and Filtering
Listing 2.3SpeedSense aggregation virtual tables
TrafficSpeed(segmentId, avgSpeed, density) (
sensorInput(GPSReading)
process<GPSReadingin, MappedGPSReadingout>(
out.segmentId = segmentId(in.lat,in.lon)out.extent = segmentExtent(out.segmentId))
timeWindow(size: 15s,slide: 10s)
groupBy(segmentId) (
aggregate<MappedGPSReading, AggregateSpeed>(
avg(speed, avgSpeed)
) ) )
TrafficTrends(segmentId, avgSpeed) (
tableInput(TrafficSpeed, stored)
groupBy(segmentId) (
aggregate<AggregateSpeed, AggregateSpeed>(
avg(avgSpeed, avgSpeed)
) ) )
TrafficTrendsHour(segmentId, hour, avgSpeed) (
tableInput(TrafficSpeed, stored)
process<AggregateSpeedin, AggregateSpeedHourout>(
out.hour = hour(in.timestamp))
groupBy(segmentId, hour) (
aggregate<AggregateSpeedHour, AggregateSpeedHour>(
avg(avgSpeed, avgSpeed)
Listing 2.4Classification and filtering in SpeedSense
TrafficHotpots(segmentId, avgSpeed, confidence) (
tableInput(TrafficSpeed)
classify<AggregateSpeedin,Hotspotout>
(in.count>COUNT_THRESHOLD),
(out.confidence=min(1,in.count/COUNT_THRESHOLD* 0.5)
if(in.avgSpeed<=SPEED_THRESHOLD* maxSpeed(in.segmentId))out.state=RED elseout.state=GREEN)
filter<Hotspotin>(
in.confidence>0.7andchangePercent(avgSpeed, 10))
)
2.3
Distribution Model
The data processing model has been discussed assuming a centralized infrastructure. This sec-tion describes a generalizasec-tion of the presented concepts to a distributed architecture, where the fixed infrastructure involves several interconnected nodes. Nodes are structured in a peer-to-peer model, each performing a similar role - as data acquisition, storage and processing ele-ments. The particular issues that stem from this setting are essentially related to how relevant data can be located, how the pipeline processing model can be effectively distributed, and this complexity can be hidden from application developers. Concrete approaches will be presented later in Section 2.4, while this section sets the grounds for a generic distribution model.
lastAggregateSpeed tuples received from each node. The average operation uses an extended syntax to represent averaging from a partial state (sum and count values). Figure 2.3 illustrates theTrafficSpeeddata source and global aggregation stages.
Listing 2.5Distributed pipeline
TrafficSpeed(segmentId, avgSpeed, density) (
sensorInput(GPSReading)
dataSource(
process<GPSReadingin, MappedGPSReadingout>(
out.segmentId = segmentId(in.lat,in.lon)out.extent = segmentExtent(out.segmentId))
timeWindow(size: 15s,slide: 10s)
groupBy(segmentId) (
aggregate<MappedGPSReading, AggregateSpeed>(
sum(speed, sumSpeed)
count(count)
) ) )
globalAggregation(
groupBy(segmentId) (
set<AggregateSpeed>(peerId,mode: change)
aggregate<AggregateSpeed, AggregateSpeed>(
avg(sumSpeed, count, avgSpeed)
) ) ) )
Given this decomposition, it is now possible to decouple data sources from aggregation. A possible distribution model, would be to have the querying node performing the global aggre-gation role, and nodes with relevant data performing the data source role. A problem with this approach would be the excessive burden carried by the querying node. Distributed query pro-cessing can be achieved, for instance, through an aggregation tree spanning all relevant nodes, and rooted on the querying node. In this scenario, each tree node performs the global aggre-gation role, combining the partial state from the lower levels, and forwarding the result down-stream if necessary1. Forwarding an aggregate value is not necessary when a global aggregator knows that there is no more information available downstream for the aggregate spatial extent, i.e., when the aggregate iscompleteorbounded. In this case the tuple can be forwarded to the root without further processing. How a global aggregator knows when an aggregate is complete depends on how data is partitioned among nodes. This issue will be explored further in Section
1throughout the document, the direction towards the root at a given point of the aggregation tree is referred as
Segment
Mapping 1 2 3
Average Average AggregateSpeed processor timeWindow aggregator aggregator groupBy(segmentId) segment-1 segment-n GPSReading AggregateSpeed groupBy(segmentId)
1 2 3
N1 N2 Nn
1 2 3
N1 N2 Nn
set(peerId) set(peerId) segment-1 segment-n Average Average AggregateSpeed Data-source Global Aggregation aggregator aggregator
Figure 2.3: TrafficSpeed distributed pipeline
2.4 when distribution strategies are discussed. The classifier operator has to be reconsidered in this distributed setting, a necessary condition for the classifier to produce an inference is that the aggregate it receives is complete, so that classifications are not produced over partial values. If the input is not complete, it has to be forwarded so that aggregation of partial states can continue downstream.
2.3.1 Persistence
In order for applications to access past data using thestored streamconstruct, pipeline outputs resulting from continuous queries have to be stored in a persistent medium. Since pipeline processing is distributed among independent nodes, it is now necessary to define how storage is partitioned between the nodes that participate in a query. The candidates for storage arebounded
tuples output by a global aggregation pipeline at a particular node. Since no further information regarding the tuple spatial extent is available downstream, the tuple can be stored knowing that it represents a final result. The actual location where a tuple is stored and replicated depends on the adopted distribution strategy.
2.3.2 Continuous Processing
at a particular moment in timet, represents the query result att- where the relation between this momentt and real-time, depends essentially on the acquisition latency and additional latency introduced by the aggregation tree. This result set is updated over time as new data is acquired and input into data sourcing pipelines - when new data flows into the aggregation structure, it triggers the recomputation of partial states downstream, possibly resulting in a change to the result set.
Partial state in a global aggregation pipeline refers to the set of data tuples representing the most recent partial aggregates at that particular tree level. State can be maintained by the
timeWindowandsetoperators. While atimeWindowhas an implicit state expiration policy given by the window size, this is not the case for theset operator. State can be managed according to a soft-stateor hard-stateapproach, where each option places different requirements on the underlying communication substrate. In a hard-state approach, set considers a tuple as valid until a new one is received, or until a failure on the originating node is detected. Since a node can distinguish absence of communication from failure, the upstream nodes can restrain from communicating their values, as long as they do not change - an opportunity to cut on communication and computation costs, depending on the dynamism of the monitored variables. In a soft-state approach, thesetis parametrized by atime-to-live. Soft-state has the advantage of simplicity, since node failure is automatically handled - the values received from a failed node will remain only until the time-to-live expires. But, in this approach, upstream nodes cannot restrain from sending regular updates even if the data has not changed significantly. The two state management approaches also impact the semantic of the query result set. If soft-state is used, tuples in the result set also have an assigned time-to-live and are evicted after expiration.
2.3.3 Historical Processing
In historical processing a pipeline propagates aggregated values only when all data has been received from all descending nodes. This can be achieved by extending theend-of-stream se-mantic so that when a global aggregation pipeline receives anend-of-stream from each of the child nodes, it will produce anend-of-streamlocally - resulting on the propagation of the aggre-gation tuples upstream. In this setting, only complete aggregates reach the root, but node failure can prevent, or delay, completion of query processing. Alternatively, aflushcontrol signal can reduce delay, in face of node failure, at the cost of producing progressive results. This signal can be triggered periodically or when pipeline input is idle for some time.
2.3.4 Virtual Table Derivation
in the origin. Conceptually, virtual table derivation results in a stream transformation where the data source stage is given by the origin table, and the global aggregation stage results from the concatenation of the origin global aggregation pipeline with the pipeline defined by the de-rived table. The same concept applies for subsequent table derivations i.e., each dede-rived table represents the concatenation of the pipeline it defines to the origin global aggregation stage.
2.4
Distribution Strategy
As discussed earlier, the 4Sensing architecture involves a high number of mobile nodes and an infrastructure that comprises fixed nodes, owned by a particular user or institution, inter-connected over a peer-to-peer overlay. A distribution strategydetermines the structure of this fixed network and defined the roles (or functions) the elements assume in this architecture and how they interrelate in order to provide acquisition, storage and query processing services. In particular, it defines the role of thehomebase, how data is acquired by the system, how queries are distributed to relevant nodes, and how data is aggregated. This dissertation proposes and analyses three strategies - RTree, NTree and QTree - described in sections 2.4.5 to 2.4.7.
Each strategy essentially proposes a specific data partitioning approach, specifying which fixed nodes acquire and store which data. Data partitioning is the basis for determining which nodes are relevant to a particular query, and how data can be effectively aggregated. In a per-sonal store model, data partition is based on ownership. This is the case in RTree, where a user’shomebaseacquires and stores all data produced by his mobile node. Alternatively, in a
spatial partitioningapproach (as in QTree and NTree), fixed nodes divide physical space into possibly overlapping areas of responsibility .
Common to both approaches is the fact that each fixed node is associated with a physical space coordinate (given by a latitude and longitude) - a geographic address - which reflects its actual physical location. The next three sections will present the main functions involved in a distribution strategy.
2.4.1 Homebase
2.4.2 Data Acquisition
Besides their homebase, mobile nodes interact with acquiring nodes, responsible for the re-ception and storage of data acquisition streams. Determining which node plays the acquiring role is a homebase function that depends on the data partitioning strategy. In thepersonal store
model, the homebase assumes this role for the associated mobile, while in spatial partitioning, the acquirer is determined in function of the mobile node’s physical location. In this case, the data delivery process depends on the particular quality of service model. In online data deliv-ery, the homebase assists the mobile node in finding the acquiring node, a process that has to be repeated regularly due to node mobility. The mobile and fixed acquisition end-points can then interact directly by forwarding the standing queries and delivering data. In deferred mode, the homebase acts as a proxy, initially receiving acquired data and routing it to the appropriate ac-quisition node. The model is open in terms of how mobile nodes link to the fixed infrastructure. It assumes an abstract network layer whose quality of service characteristics set the bounds of the supported acquisition modalities.
2.4.3 Query Dissemination and Control
Queries are issued by application clients through the homebase and are distributed among the set of relevant nodes (the data sources) using a query dissemination and control function of the overlay network. Generically, nodes support query routing based on the target area of interest and build a dissemination tree rooted on the node that issued the query, reaching all (or a ma-jority of) nodes that hold relevant data. This same tree can be used for query control operations, such as query maintenance and termination.
2.4.4 Query Processing
Following the query dissemination process, a query processing tree is established and specific nodes assume the global aggregation role. A processing tree is more effective for a particular data partitioning if it leverages this partitioning in order to reduce computation and communi-cation. This reduction is possible if a node can determine if it has all the relevant information regarding a particular spatial extent, i.e., that aggregate values produced for that extent are com-plete, in this case avoiding the propagation of partial state downstream. How close to the data sources this decision can be taken, determines the computation and communication gains.
2.4.5 RTree
The basic rationale behind RTree (Random Tree) is to have the homebase as a personal data repository. Storing own data in a personal store is a natural choice for personal archiving and tracking applications, such as CarTel [24] and BikeNet [10]. Besides, it allows the implemen-tation of privacy protection mechanisms - such as the privacy firewall advocated in [17] - since data streams initially flow to a machine trusted by the user. Personal stores can be private - a strong incentive for users to contribute fixed resources to the system - or shared by a group of users.
2.4.5.1 Data Acquisition
In this model, all data acquired by a mobile node belonging to a particular user is sent to (and stored on) his homebase. Given the mobility patterns of a particular users, the homebase will receive, process and store data from a potentially large geographic area. This data will typically cover at least a city-wide area, with most of the data being confined to the region around his/her home and workplace.
2.4.5.2 Query Dissemination
The determining characteristic of this model is that every homebase potentially hosts data that is relevant for a particular query. To reach all the relevant data it would be necessary to distribute each query to all the homebases participating in the system. Given that a node in New York or even Porto will probably not have much information about Lisbon, query distribution can be restricted according to a simple geographic filter. For this purpose, a homebase defines the geographical area it is willing to serve - itsquery filter. This filter can be expressed as a circular area around its geographical address. Query dissemination is then achieved by delivering the query to the nodes whosequery filter intercepts the query’sarea of interest. By definition, this model does not guarantee that all relevant data is reachable by a given query. If a user, whose homebase geographic address is located in Lisboa, travels to Porto and its query filter defines a radius of 10 km, then the acquired data will be out of reach - in the query initiated acquisition model, data beyond a user’s query filter will not be acquired at all. Since the data distribution is essentially random, any dissemination tree is equally effective according to the definition given above - thus the name Random Tree - whichever the tree structure, an intermediate node has no way to determine if it has complete information regarding a particular spatial extent, so partial results have to be propagated downstream until reaching the root.
2.4.5.3 Query Processing
descendants of that node, and its own data source. Each node propagates its pipeline output downstream to its parent that, in turn, uses it as input to its global aggregation pipeline instance. Since a node cannot determine if it has complete information for a particular spatial extent, this process has to be repeated until the root is reached. The query processing tree in RTree is illustrated in Figure 2.4.
DS GA DS GA
DS GA DS GA
DS GA
Figure 2.4: RTree aggregation
2.4.5.4 Persistence
Persistence of acquired data is simplified in RTree, since data partition is based on ownership -the acquisition streams of a particular user is stored on his homebase. Regarding derived data, RTree has the particularity that tuples are never bounded before reaching the root, so only at this point a decision can be taken regarding where the tuple is stored and replicated. In order to be reachable by future queries, a tuple can be stored on any node whose query filter contains its spatial extent.
2.4.5.5 Network Model
2.4.5.6 Network Dynamism
A defining characteristic of the peer-to-peer network model is the inherent dynamism caused by new nodes entering the network and node exiting, either graceful or by failure. This network dynamism has to be taken into account in terms of its impact on data availability and query evaluation. Given the personal store model, acquired data in RTree is not replicated, meaning that node exits will result in data loss. But in this particular context, where value is obtained essentially from aggregated data, the absence of particular raw data points does not necessarily impact the quality of application inferences, provided there is sufficient coverage for the area of interest. There is a natural resilience in the application domain that makes replication of acquired data unnecessary. Derived data, on the other hand has to be replicated in order to prevent data loss.
The aggregation tree structure is sensible to node failures, possibly resulting in a degradation of the quality of results. The severity of this degradation is higher if the failure occurs closer to the root, as more data becomes unreachable. Given that aggregation trees are independent for each query, the impact of a failure is limited to queries running on the failed node, and can be handled by closing and re-issuing the query. Node entries during query execution can result in additional data becoming available, but not being reachable by running queries. This is particular relevant in long standing, continuous queries. To address both node failures and entries, continuous queries can be reissued periodically.
2.4.5.7 Overlapping Queries
The arbitrary structure of the aggregation trees in RTree reduces the opportunity to share com-putations among continuous queries. A possible approach would be to perform an initial step to discover standing queries that enclose a new query that is about to be issued. In this particular case, the same tree could be used without adding additional effort. The fact that independent trees are used to process overlapping queries has consequences on persistence - since different trees will independently produce data for the same spatial extent and time, it is necessary to have a global persistence strategy that controls the placement and number of replicas. These issues are left open for future work.
2.4.6 QTree
In QTree (where Q stands for quadrant) data partitioning is based on the successive subdivision (or splitting) of geographic space into quadrants. Subdivision occurs for a given region if at least one of its quadrants holds a minimum number of nodes (theminimum occupancy). This region will then be divided into those quadrants that hold at least the minimum number of nodes. Figure 2.5 depicts spatial subdivision with a minimum occupancy of two. Each node belongs simultaneously to all the quadrants that contain it, down to the smallest - called its
it. Minimum occupancy assures that load can be shared, and data replicated, among nodes that fall into the same quadrant. A problem with this approach is that an extents that crosses a first level quadrant can be stored in any node on the system; the same can happen for acquired data in regions with low node density. This means that in some cases a query has to be flooded to every node. In order to reduce query scope it is necessary to establish aminimum divisionlevel. Assuming a minimum division leveldmin means that geographic space is assumed to be totally
divided up todmin, i.e. all quadrants at this level have minimum occupancy. In this scheme, a
tuple is never stored above dmin, if it crosses more that one quadrant at that level it has to be
replicated among the quadrants it intercepts. For areas where this assumption does not hold (e.g., bottom left in 2.5), QTree cannot guarantee that all relevant data can be found - an issue that could be address by assigning more than one coordinate to particular nodes using a load balancing criteria.
Figure 2.5: Spatial subdivision in QTree with minimum occupancy of 2 nodes
2.4.6.1 Data Acquisition
A mobile node contacts its homebase in order to bind to an acquisition node in the fixed infras-tructure. In QTree, a suitable acquisition node is any node belonging to the maximum division quadrant that includes the mobile node’s physical location. Figure 2.5 illustrates four mobile nodes, represented as triangles, connected with the respective acquisition nodes.