Original Article
ISSN 1414-462X (Print)ISSN 2358-291X (Online)This is an Open Access article distributed under the terms of the Creative Commons Attribution License, which permits unrestricted use, distribution, and reproduction in any medium, provided the original work is properly cited.
Mortality trend due to traffic accident in young
in the south of Brazil
Tendência de mortalidade por acidente de trânsito em
jovens no Sul do Brasil
Willian Augusto de Melo
1, Rosana Rosseto de Oliveira
2, Adriano Brischiliari
3,
Sandra Marisa Pelloso
2, Maria Dalva de Barros Carvalho
21Centro de Ciências da Saúde, Universidade Estadual do Paraná (UNESPAR) - Paranavaí (PR), Brasil. 2Centro de Ciências da Saúde, Universidade Estadual de Maringá (UEM) - Maringá (PR), Brasil. 3Secretaria Municipal de Saúde - Maringá (PR), Brasil.
Trabalho realizado na Universidade Estadual de Maringá (UEM) – Maringá (PR), Brasil.
Endereço para correspondência: Willian Augusto de Melo – Universidade Estadual do Paraná (UNESPAR), Av. Gabriel Experidião, s/n – CEP: 87703-000 – Paranavaí (PR), Brasil – Email: [email protected]
Fonte de financiamento: nenhuma. Conflito de interesses: nada a declarar. Abstract
Background: Traffic accidents are a major global public health problem with an impact on morbidity and mortality. Objective: The aim of this study was to analyze the mortality trend from road accidents among young adults. Method: An ecological time-series study was performed of the deaths of young (15-24 years old) in traffic accidents in the state of Parana, Brazil from 1996 to 2013. Mortality data was obtained from the Mortality Information System. Mortality rates were calculated and the trend analysis was performed through polynomial regression models. A trend was considered significant when the estimated model obtained a p-value <0.05. Accidents involving tricycles were excluded from the analysis (58 cases). Results: Of the 12,063 deaths from road accidents, 82.0% were male. There was a significant and growing trend of accident mortality rates involving motorcyclists and car and pick-up truck occupants, and a decreasing trend of fatal accidents involving pedestrians. The average mortality rate for accidents involving motorcyclists was 10 deaths per 100,000 residents, an increase of 1.13 per year. Accidents involving car occupants increased annually by 0.43 and accidents involving pick-up truck occupants by 0.01. Conclusion: There was a significant increasing trend for fatalities of both genders, especially motorcyclists and car occupants. The pedestrian mortality trend has shown a decreasing due to their lower exposure.
Keywords: mortality rate; epidemiology; time series studies; traffic accidents.
Resumo
Introdução: Os acidentes de trânsito são um grande problema de saúde pública global com impacto na morbimortalidade. Objetivo: O objetivo deste estudo foi analisar a tendência de mortalidade dos acidentes de trânsito entre jovens adultos. Método: Trata-se de um estudo ecológico, de séries temporais dos óbitos ocorridos por acidente de transporte terrestre entre jovens (15 a 24 anos) residentes no Estado do Paraná, Brasil, no período de 1996 a 2013. Os dados de mortalidade foram obtidos no Sistema de Informação sobre Mortalidade (SIM). Calcularam-se os coeficientes de mortalidade e realizou-se a análise de tendência por meio de modelos de regressão polinomial. Acidentes envolvendo triciclos foram excluídos da análise (58 casos). Resultados: Dos 12.063 óbitos ocorridos por acidentes de transporte, 82% eram com homens. Houve tendência crescente e significativa para os coeficientes de mortalidade por acidentes para ambos os sexos ocorridos com motociclistas e ocupantes de automóveis e caminhonetes. O coeficiente médio de mortalidade de acidentes envolvendo motociclistas foi de 10 óbitos por 100 mil residentes, com aumento de 1,93 ao ano para homens e de 0,31 para mulheres (r2 = 0,94). Acidentes que envolviam automóveis mostraram
tendência crescente com aumento anual de 0,43, e acidentes envolvendo caminhonetes, de 0,01. Conclusão: Houve aumento na tendência de fatalidades em ambos os sexos, especialmente entre motociclistas e ocupantes de automóveis. A mortalidade entre pedestres mostrou tendência decrescente devido à menor exposição.
▄
INTRODUCTIONTraffic accidents are responsible for 1,240,000 deaths per year worldwide, meaning that each day there are 3,397 people losingtheir lives in this manner. Data show that such accidents are the 11th
most common cause of death and the 9th most common cause of
sequelae among the general population. According to the World Health Organization, traffic fatalities in Brazil were 37,233 cases, and the most prevalent categories of vehicles were respectively riders motorized (25%), pedestrians (23%) and occupants cars (22%)1. A study from Paraná that aimed to analyze the factors
associated with the occurrence of nonfatal traffic accidents regarding age verified that demographic, environmental, and logistical factors were associated with morbidity due to traffic accidents among young people. This study showed that the main predictors for the occurrence of accidents were being single, having over 8 years of education, having had a driver’s license for less than 3 years, roads with low luminosity, and driving at night2. Young people are among the most productive age
groups in the population. This has significant economic, social and emotional repercussions3.
Several studies have addressed traffic accidents, relating them to variables such as age, gender, time of occurrence4-7 as well
as to spatial distribution and environmental factors involved in deaths on highways8.
The patterns involved in such accidents9 and the traffic
accident mortality rates by gender and age group as well as mortality patterns, most at risk of death population, anatomical distribution of injuries, relationship between stricter legislation and a decrease in mortality in adolescents, and comparisons between different population have also been studied10-13.
However, to the best of the authors’ knowledge, there are no studies involving a specific trend analysis of mortality from traffic accidents among young adults, using data obtained at regular time intervals including today, and addressing the different categories of traffic accidents.
The aim of this study was to analyze the trend in mortality from road accidents inyoung adults in Brazil between 1996 and 2013.
▄
METHODStudy population
It is an ecological time-series study of deaths from traffic accidents among young adults (15-24 years old) residing in the state of Parana, Brazil from 1996 to 2013. They were a total of 12,063 deaths in the period.
The State of Paraná has 399 municipalities with a population at 10,439,601 inhabitants in the 2010 population census, and 1,829,963 (17.5%) are young people (15-24 years old)14. At the
national level, the sate occupies the fifth position of the Gross Domestic Product (GDP) and the Human Development Index
(HDI) (0.75) and third position in the concentration of the circulating fleet and largest highway network in the country with 136,700km distributed in federal, state and municipal roads14.
Data acquisition
Secondary mortality data was obtained from the Mortality Information System (MIS), provided by the Information Department of the Unified Health System (DATASUS). Data was collected in October 2016. This data source is available on the open access and public domain15.
Variables
The International Classification of Diseases version 10 (ICD-10), under codes V01 to V89, was used to classify the deaths. It was subdivided into the following categories, according to the victim’s mode of transportation: pedestrian (V01 to V09); bike (V10 to V19), motorcycle (V20 to V29), tricycle (V30 to V39), car (V40 to V49), pick-up truck (V50 to V59), heavy transport vehicle (V60 to V69), bus (V70 to V79), and others (V80 to V89 - animal-drawn vehicle, train, special transport vehicle, etc.).
Due to the low number of deaths of occupants of tricycles,, they were excluded from the analysis of this study (58 cases).
Data analysis
Mortality rates were calculated by taking the number of deaths of young adults (15-24 years) living in the state of Paraná between 1996 and 2013 as the numerator, and the resident population for the same age group, place and time as the denominator per 100,000 residents.
Seeking to mitigate the possible random fluctuations and variations in the estimated deaths of the population, mortality coefficients were grouped into six three-year periods: 1996-1998, 1999-2001, 2002-2004, 2005-2007, 2008-2010 and 2011-2013. Trend analysis was performed using polynomial regression models. This method was chosen due to its high statistical power, and also due to its greater ease of formulation and interpretation. A polynomial model attempts to find the curve that best fits the data to describe the relationship between the dependent variable Y (mortality rate) and the independent variable X (year of study). The year variable was transformed into centralized year (X-2003) and the series was smoothed using a moving mean of three points (triennium) to avoid a serial correlation between the terms of the regression equation.
The linear polynomial regression (Y=ß0+ß1X), quadratic (Y= ß0+ß1X+ß2X2) and cubic (Y=ß
0+ß1X+ß2X 2+ß
3X
3) models
were tested. To choose the best model scattergram analysis of the value of the determination coefficient (r2when closer to 1,
A trend was considered significant when the estimated model obtained a p-value <0.05. When all criteria were significant for more than one model and the determination coefficient was similar, the simplest model was chosen. The statistical program
SPSS for Windows (version 21.0) was used.
▄
RESULTSA total of 11,167 deaths from road accidents in the state of Paraná from 1996 to 2012 were analyzed, with 9,154 (82.0%) deaths of men and 2,013 (18.0%) deaths of women. In the triennium 1996-1998, the male death rate was 57.5 deaths per 100,000 residents, rising to 66.8 in the triennium 2011-2013, giving a relative increase of 16.1%. For females, the mortality rate was 14.5 declined to 13.6, giving a relative decrease of 6.2% (Figure 1).
According to the terrestrial transport accident categories, there was a significant increase in mortality for motorcycle and car accidents, while a significant decrease was observed for pedestrian deaths, with a reduction from 7.44 deaths per 100,000 residents in the triennium 1996-1998 to 3.21 in the triennium 2011-2013. In the pickup-truck occupants’ category, there was a small increase in mortality, while for bicycles the rate dropped slightly (Figure 2).
In the first three years (1996-1998), pedestrian, car occupant and motorcyclist occupied this order in mortality coefficient. In the second triennium (1999-2001), it begins to change the
order of categories of vehicles. From the fourth triennium (2005-2007), the prevalence of mortality stabilizes in motorcyclists, car occupants, and pedestrians, respectively.
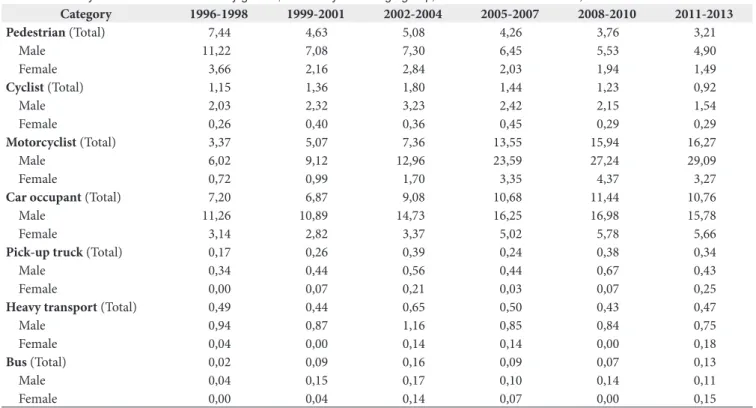
When the data related to gender was analyzed, mortality was greater in men for all years and all categories, notably for the motorcyclists, car occupants and pedestrians (Table 1).
Linear regression analysis showed a significant and growing trend for accident mortality rates of motorcyclists, car and pick-up truck occupants, and a decreasing trend for accidents involving pedestrian deaths (Table 2).
The average mortality rate of accidents involving motorcyclists was 10.0 deaths per 100,000 residents, having an increase of 1.13 per year (r2=0.94). Most of these deaths were male gender, with an average rate of 17.46 and an annual increase of 1.94, in comparison with females, among whom the average rate was 2.42, with an increase of 0.31 per year.
Accidents involving car occupants revealed an increasing trend, with an annual increase of 0.43 and a greater incidence (a mean rate of 14.26) and increase (0.57) among males than among females (mean rate of 4.12 and a mean annual increase of 0.27).
There was an increasing trend of mortality rates for accidents involving pick-up truck occupants, with an annual increase of 0.01, although the explanatory power of the model was low (r2 = 0.39). There was an increasing trend among males
(0.02 per year), while the mortality rate among females remained constant, and was not statistically significant in this period.
Figure 1. Mortality rate of road accidents in the 15-24 year age group from 1996 to 2013 in Paraná, Brazil
Table 1. Mortality rates for road accidents by gender, 15 to 24-year-old age group, from 1996 to 2013. Paraná, Brazil
Category 1996-1998 1999-2001 2002-2004 2005-2007 2008-2010 2011-2013
Pedestrian (Total) 7,44 4,63 5,08 4,26 3,76 3,21
Male 11,22 7,08 7,30 6,45 5,53 4,90
Female 3,66 2,16 2,84 2,03 1,94 1,49
Cyclist (Total) 1,15 1,36 1,80 1,44 1,23 0,92
Male 2,03 2,32 3,23 2,42 2,15 1,54
Female 0,26 0,40 0,36 0,45 0,29 0,29
Motorcyclist (Total) 3,37 5,07 7,36 13,55 15,94 16,27
Male 6,02 9,12 12,96 23,59 27,24 29,09
Female 0,72 0,99 1,70 3,35 4,37 3,27
Car occupant (Total) 7,20 6,87 9,08 10,68 11,44 10,76
Male 11,26 10,89 14,73 16,25 16,98 15,78
Female 3,14 2,82 3,37 5,02 5,78 5,66
Pick-up truck (Total) 0,17 0,26 0,39 0,24 0,38 0,34
Male 0,34 0,44 0,56 0,44 0,67 0,43
Female 0,00 0,07 0,21 0,03 0,07 0,25
Heavy transport (Total) 0,49 0,44 0,65 0,50 0,43 0,47
Male 0,94 0,87 1,16 0,85 0,84 0,75
Female 0,04 0,00 0,14 0,14 0,00 0,18
Bus (Total) 0,02 0,09 0,16 0,09 0,07 0,13
Male 0,04 0,15 0,17 0,10 0,14 0,11
Female 0,00 0,04 0,14 0,07 0,00 0,15
Table 2. Linear trend of mortality rates from traffic accidents, according to categories and gender in the 15-24 years old group in Paraná, Brazil, 1996-2013
Category Model R2 P Trend
Pedestrian 4.71 - 0.21x 0.79 <0.001 Decreasing
Male 7.00 - 0.32x 0.81 <0.001 Decreasing
Female 2.41 - 0.09x 0.67 <0.001 Decreasing
Cyclist 1.38 - 0.01x 0.04 0.467 Constant
Male 2.38 - 0.03x 0.05 0.419 Constant
Female 0.37 + 0.00x 0 0.968 Constant
Motorcyclist 10.00 + 1.13x 0.94 <0.001 Increasing
Male 17.46 + 1.94x 0.94 <0.001 Increasing
Female 2.42 + 0.31x 0.95 <0.001 Increasing
Car occupant 9.22 + 0.43x 0.9 <0.001 Increasing
Male 14.26 + 0.57x 0.86 <0.001 Increasing
Female 4.12 + 0.27x 0.88 <0.001 Increasing
Pick-up truck 0.29 + 0.01x 0.39 0.012 Increasing
Male 0.49 + 0.02x 0.55 0.001 Increasing
Female 0.09 + 0.003x 0.05 0.42 Constant
Heavy transport occupant 0.50 - 0.005x 0.08 0.321 Constant
Male 1.00 - 0.01x - 0.004x2 0.52 0.005 Decreasing
Female 0.07 + 0.005x 0.11 0.23 Constant
Bus 0.09 + 0.003x 0.11 0.236 Constant
Male 0.12 + 0.002x 0.07 0.336 Constant
Female 0.06 + 0.004x 0.09 0.283 Constant
Table 2 also shows that, unlike the trends observed for accidents involving motorcyclists, cars and pick-up truck occupants, pedestrian deaths declined, especially among males, with a decrease of 0.32 per year and a model with high explanatory power (r2= 0.81).
▄
DISCUSSIONAlthough several studies of trends in traffic accident mortality exist, to the best of the authors’ knowledge, this is one of the first studies to conduct a specific analysis of trends in traffic accident mortality among young adults with a regular time interval and different categories of terrestrial transportation.
The results showed an increasing trend in mortality from road accidents among young adults in the time interval studied. Other studies on traffic accident mortality have obtained similar results to those found in this article16-19.
There was a significant increasing trend for the motorcyclist and car occupant categories highlighted as the main axis for discussion in this study, as well as a significant decreasing trend in the pedestrian category, and increased mortality for all years and all categories, especially for motorcycles and car occupants. The increased mortality rate for motorcycle accidents has been a worldwide phenomenon over the last decade, especially in middle and low-income countries17,19,20.
A series of Brazilian studies on youth violence revealed that -from 1996 to 2012, the mortality of motorcyclists aged range 15 to 24 years old increased by 1041%, presenting a straight line from 2008 onwards, with a systematic growth of 15% per year21.
In the present study, the rate increased from 2.8/100,000 residents in 1996 to 18.2/100,000 to 2012, an approximate increase of 600%. It should be noted that the period reviewed here was longer, showing a consistent increasing trend.
The high mortality rates for motorcycle accidents can be explained by many factors. In recent decades, Brazil has undergone a period of development with economic stabilization, greater availability of credit and an increase in per capita income, which has led to significant growth in the vehicle fleet, especially of motorcycles22. The limited coverage and poor quality of public
transport in the country, together with its low acquisition and maintenance costs makes the motorcycle a highly practical means of transport3,23. Today, there are more than 20 million
motorcycles in Brazil, and the country has been described as the fifth largest global producer of motorcycles, with an annual production of around 1.7 million units24.
The inadequate road infrastructure and traffic control, the improper use of protective equipment, and the consumption of alcohol and poor hospital medical care25 in some regions, may
also have contributed to the increased mortality rate observed in the present study.
A growing trend in mortality from accidents involving motorcyclists was also found in the UK, where an annual increase of 4.6% in hospital admissions was identified26. This growing
trend was also observed in Peru, with numbers of “moto-taxis” increasing over the years27.
In the a study in the state of California (USA), fatal crashes involving motorcyclists with an approximate age of 18-24 years
old increased by 23%, especially on weekends, while the mortality rate among the 35-44 years old group remained relatively stable28.
The severity of injuries suffered by motorcyclists is the main cause of death at the scene of the accident. While a Brazilian study found that 70% of motorcycle deaths occur in hospitals29,
in India 42.8% of deaths occurred on public roads30. In these
countries, as well as in Peru, it was found that the weekend, speeding and driver recklessness are the most significant factors for the occurrence of the deaths of younger riders27-29.
Traffic accidents with cars registered a significant growth in mortality rates, especially after 200519. As it is considered
the largest vehicle fleet on both urban roads and highways, car accidents also have a growing impact on hospital morbidity rates. This phenomenon could be explained by the increase and effectiveness of pre-hospital medical care services, use of seat belts and improved resolvability in hospital trauma care27,28.
The results of the present study showed that the frequency of deaths from automobile accidents was the second highest among the categories of vehicles. It was found that even in countries with different levels of socio-economic development, such as India16 and the United States31 the occurrence of injuries from
automobile accidents was also significantly associated with men of younger age groups, as well as alcohol abuse. A study conducted in Rio de Janeiro, Brazil’s second largest metropolitan region, confirmed the association of risk among young, unmarried drivers, who were driving under the influence of alcohol32.
Brazil is a developing country and many studies have shown that economic growth contributes to an increase in car accidents especially among young adults, as also found in Turkey33. In contrast, a study in China revealed that the total
number of traffic fatalities peaked in 2002, with a subsequent continued reduction, although the total number of cars has increased rapidly over the same period of time. The possible causes of this phenomenon were not explored in the study34.
The present study revealed a decreasing trend in traffic deaths involving pedestrians. A study conducted in all Brazilian states between 2000 and 2010 found a similar trend of decreasing mortality among pedestrians19,35. It may be assumed that
improved socioeconomic conditions combined with easy access to credit for the purchase of vehicles have contributed to a transition from the category of pedestrian to a driver or passenger of motor vehicles24.
Unlike the present study, a study in Australia found an increasing trend of accidents involving pedestrians, with a greater occurrence among the 18-24 years-old group on weekends, and among the 13-17 yearsold group during journeys to and from school36.
also found in a study in Ghana, West Africa, where pedestrians represented the largest group of deaths among users of urban roads as well as behavioral factors, and also roadside activities such as nighttime walking and driver inattentiveness. Collisions with motorcyclists represented 86% of cases37.
The state of Paraná presents a particular characteristic of risk and vulnerability for the occurrence of terrestrial accidents with pedestrians, which is that highways cross the urban area of many municipalities. In 2012, 50.3% of accidents occurred in the countryside of the state, 16.9% on federal highways and 9.7% on state highways. Of fatal and non-fatal victims, 8.8% occurred by being run over and 60.4% by collision between vehicles38.
Although the pedestrian mortality trend has shown a decreasing trend due to their lower exposure, it is important to note that this category is more vulnerable to serious injuries and death, as the accident victim has no type of protection. In the state of Paraná, this aspect is particularly noticeable as accidents occur mostly in the interior of the state, where highways cross urban areas.
With respect to accidents involving pickup-trucks or vans, studies indicate that although these vehicles provide better protection for their occupants than cars, they are associated with the same total risk of deaths in accidents39.
The main limitation of the present study involved the use of secondary databases, as the information depends on the correct completion of death certificates by doctors, and proper inputting into the operating platform of the information system by technicians and coders. Some missing variables in the data source that could be used to compose the model are: behavioral factors, alcohol use, and speeding.
Underreporting of type of vehicle were a total of 2,822 fatal accidents (24.7%), which were registered into code V89 of the ICD-10 category entitled “Person injured in motorized or non‑motorized vehicle accident, type of vehicle(s) not specified”, which made the inclusion of this information in the study impossible.
Investigating traffic accidents, which are today a major public health problem with significant social and economic impacts, along with their multi-dimensional factors should be a research
priority for most countries to reduce both the severity and frequency of such accidents18.
The results of the present study suggest that public authorities have not satisfactorily assumed their responsibility for the control and reduction of accidents and mortality from traffic accidents, especially those involving motorcycles. The need to prevent injuries and deaths from motorcycle accidents is an increasingly important public health issue in Brazil and around the world. Governments must recognize this growing problem as a public health crisis and create appropriate policy responses. However, it has been perceivedthat public policy of this epidemic has been silenced at national and international levels3.
Considering the various risk factors related to mortality from traffic accidents, added to the related high social impact, there is a need to invest in promotion, prevention, and interventions involving, at least, the environment in which vehicles circulate, and behavioral measures related to the individual40.
In the studied time period, there was a significant increasing trend for fatalities of both genders, especially among motorcyclists, followed by car occupants, with a greater increase in the first group. This finding was verified both over time as well as in the dispersion of occurrences during the time period analyzed. Although there was a decrease in the mortality trend among pedestrians, this phenomenon could be justified by transferring the cause of death to the other groups, as pedestrians instead become users of motor vehicles.
The minimal impact of the implementation of traffic laws to reduce accidents shows that these need to be improved and reformed, and based on more rigorous methods for the control and monitoring of traffic accidents.
The existing information systems on mortality are still the main sources of information for the government management of traffic violence. Despite the limitations indicated, there are indicators that they can be designed to be shared with the agencies responsible for the management of road traffic in Brazil.
The unification of information in a single official register would include information from public safety and health care agencies, allowing clinical analysis of the spatial and behavioral condition of victims and accidents, standardizing records and structuring access to information that is both more complete and closer to the factual reality.
▄
REFERENCES1. World Health Organization. Global status report on road safety 2013: supporting a decade of action [Internet]. Luxembourg: WHO; 2013 [cited 2017 Aug 11]. Available from: http://www.who.int/violence_injury_prevention/ road_safety_status/2013/en/
2. Melo WA, Alarcão ACJ, Oliveira APR, Pelloso SM, Carvalho MDB. Age-related risk factors with nonfatal traffic accidents in urban areas in Maringá, Paraná, Brazil. Traffic Inj Prev. 2017;18(2):157-63. http://dx.doi.org/10.10 80/15389588.2016.1235786. PMid:27624544.
3. Martins ET, Boing AF, Peres MA. Mortalidade por acidentes de motocicleta no Brasil: análise de tendência temporal, 1996-2009. Rev Saude Publica. 2013;47(5):931-41. http://dx.doi.org/10.1590/S0034-8910.2013047004227. PMid:24626498.
5. Gjerde H, Christophersen AS, Normann PT, Mørland J. Toxicological investigations of drivers killed in road traffic accidents in Norway during 2006–2008. Forensic Sci Int. 2011;212(1-3):102-9. http://dx.doi.org/10.1016/j. forsciint.2011.05.021. PMid:21665393.
6. Ascari RA, Chapieski CM, Silva OM, Frigo J. Perfil epidemiológico de vítimas de acidente de trânsito. REUFSM. 2013;3(1):112-31.
7. Andrade-Barbosa TL, Xavier-Gomes LM, Barbosa VA, Caldeira AP. Mortalidade masculina por causas externas em Minas Gerais Brasil. Cien Saude Colet. 2013;18(3):711-9. http://dx.doi.org/10.1590/S1413-81232013000300017. PMid:23546198.
8. Andrade L, Vissoci JRN, Rodrigues CG, Finato K, Carvalho E, Pietrobon R, et al. Brazilian Road Traffic Fatalities: A Spatial and Environmental Analysis. PLoS One. 2014;9(1):e87244. http://dx.doi.org/10.1371/journal. pone.0087244. PMid:24498051.
9. Bringmann PB, Ferreira EC, Bringmann NV, Pelloso SM, Carvalho MDB. Um padrão de envolvimento dos adultos em acidentes rodoviários. Rev Ciênc Saúde Coletiva. 2014;19(12):4861-68. http://dx.doi.org/10.1590/1413-812320141912.17042013.
10. Majdan M, Rusnak M, Rehorcikova V, Brazinova A, Leitgeb J, Mauritz W. Epidemiology and patterns of transport-related fatalities in Austria 1980-2012. Traffic Inj Prev. 2015;16(5):450-5. http://dx.doi.org/10.1080/15389 588.2014.962133. PMid:25256803.
11. Hasanzadeh J, Moradinazar M, Najafi F, Ahmadi-Jouybary T. Trends of Mortality of Road Traffic Accidents in Fars Province, Southern Iran, 2004 - 2010. Iran J Public Health. 2014;43(9):1259-65. PMid:26175980.
12. Monroe K, Irons E, Crew M, Norris J, Nichols M, King WD. Trends in Alabama teen driving death and injury. J Trauma Acute Care Surg. 2014;77(3 Suppl 1):51-4. http://dx.doi.org/10.1097/TA.0000000000000399. PMid:25153056.
13. Magid A, Leibovitch-Zur S, Baron-Epel O. Increased inequality in mortality from road crashes among Arabs and Jews in Israel. Traffic Inj Prev. 2015;16(1):42-7. http://dx.doi.org/10.1080/15389588.2014.908289. PMid:24679219.
14. Instituto Brasileiro de Geografia e Estatística. Estados [Internet]. Rio de Janeiro: IBGE; 2017 [cited 2017 Aug 11]. Available from: http://www.ibge. gov.br/estadosat/perfil.php?sigla=pr
15. Brasil. Ministério da Saúde. Departamento de Informática do Sistema Único de Saúde [Internet]. Brasília: DATASUS; 2016 [cited 2017 Aug 11]. Available from: ttp://tabnet.datasus.gov.br/cgi/tabcgi.exe?sim/cnv/obt10pr. def
16. Papa MAF, Wisnieswski D, Inoue KC, Molena-Fernandes CA, Évora YDM, Matsuda LM. Mortality from land transport accidents: a comparative analysis. Rev Cogitare Enferm. 2014;19(1):48-55.
17. Mirkazemi R, Kar A. A population-based study on road traffic injuries in Pune City, India. Traffic Inj Prev. 2014;15(4):379-85. http://dx.doi.org/10 .1080/15389588.2013.826800. PMid:24471362.
18. Alkheder SA, Sabouni R, Naggar H, Sabouni AR. Driver and vehicle type parameters’ contribution to traffic safety in UAE. J Transp Lit. 2013;7(2):403-30. http://dx.doi.org/10.1590/S2238-10312013000200021.
19. Marín-León L, Belon AP, Barros MBA, Almeida SDM, Restitutti MC. Tendência dos acidentes de trânsito em Campinas, São Paulo, Brasil: importância crescente dos motociclistas. Cad Saude Publica. 2012;28(1):39-51. http://dx.doi.org/10.1590/S0102-311X2012000100005. PMid:22267064.
20. Nantulya VM, Reich MR. The neglected epidemic: road traffic injuries in developing countries. BMJ. 2002;324(7346):1139-41. http://dx.doi. org/10.1136/bmj.324.7346.1139. PMid:12003888.
21. Waiselfisz JJ. Mapa da violência 2014: os jovens do Brasil [Internet]. Rio de Janeiro: Flacso Brasil; 2015 [cited 2017 Aug 11]. Available from: https://www. mapadaviolencia.org.br/pdf2014/Mapa2014_JovensBrasil_Preliminar.pdf
22. Instituto de Pesquisa Econômica Aplicada. Mobilidade urbana e posse de veículos: análise da PNAD 2012 [Internet]. Brasília: IPEA; 2013 [cited 2017 Aug 11]. (Comunicados do IPEA; no. 161). Available from: http://www.ipea. gov.br/agencia/images/stories/PDFs/comunicado/131024_comunicadoipea161. pdf
23. Aristizábal D, González G, Suárez JF, Roldán P. Factores associados al trauma fatal em motociclistas em Medellín, 2005-2008. Biomédica. 2012;32(1):112-24.
24. Associação Brasileira dos Fabricantes de Motocicletas, Ciclomotores, Motonetas, Bicicletas e Similares. Dados do setor de motocicletas [Internet]. São Paulo: Abraciclo; 2014 [cited 2017 Aug 11]. Available from: http:// abraciclo.com.br
25. Malta DC, Soares AM Fo, Montenegro MMS, Mascarenhas MDM, Silva MMA, Lima CMM, et al. Análise da mortalidade por acidentes de transporte terrestre antes e após a Lei Seca - Brasil, 2007-2009. Epidemiol Serv Saude. 2010;19(4):317-28. http://dx.doi.org/10.5123/S1679-49742010000400002.
26. Lyons RA, Ward H, Brunt H, Macey S, Thoreau R, Bodger OG, et al. Using multiple datasets to understand trends in serious road traffic causalities. Accid Anal Prev. 2008;40(4):1406-10. http://dx.doi.org/10.1016/j.aap.2008.03.011. PMid:18606273.
27. Choquehuanca-Vilca V, Cardenas-Garcia F, Collazos-Carhuay J, Mendoza-Valladolid W. Perfil epidemiológico de los accidentes de tránsito en el Perú, 2005-2009. Rev Peru Med Exp Salud Publica. 2010;27(2):162-9. http:// dx.doi.org/10.1590/S1726-46342010000200002. PMid:21072466.
28. Jung S, Xiao Q, Yoon Y. Evaluation of motorcycle safety strategies using the severity of injuries. Accid Anal Prev. 2013;59(1):357-64. http://dx.doi. org/10.1016/j.aap.2013.06.030. PMid:23872159.
29. Montenegro MMS, Duarte EC, Prado RR, Nascimento AF. Mortalidade de motociclistas em acidentes de transporte no Distrito Federal, 1996 a 2007. Rev Saude Publica. 2011;45(3):529-38. http://dx.doi.org/10.1590/ S0034-89102011000300011. PMid:21552757.
30. Fitzharris M, Dandona R, Kumar GA, Dandona L. Crash characteristics and patterns of injury among hospitalized motorised two-wheeled vehicle users in urban India. BMC Public Health. 2009;9(1):11. http://dx.doi. org/10.1186/1471-2458-9-11. PMid:19134225.
31. Williams AF, Tefft BC. Characteristics of teens-with-teens fatal crashes in the United States, 2005-2010. J Safety Res. 2014;48:37-42. http://dx.doi. org/10.1016/j.jsr.2013.11.001. PMid:24529089.
32. Abreu AMM, Lima JMB, Matos LN, Pillon SC. Uso de álcool em vítimas de acidentes de trânsito: estudo do nível de alcoolemia. Rev Lat Am Enfermagem. 2010;18(Spec No):513-20. http://dx.doi.org/10.1590/S0104-11692010000700005. PMid:20694419.
33. Puvanachandra P, Hoe C, Ozkan T, Lajunen T. Burden of road traffic injuries in turkey. Traffic Inj Prev. 2012;13(1 Suppl 1):64-75. PMid:22414130.
34. Ma S, Li Q, Zhou M, Duan L, Bishai D. Road traffic injury in China: a review of national data sources. Traffic Inj Prev. 2012;13(Suppl 1):57-63. PMid:22414129.
terrestre no Brasil na última década: tendência e aglomerados de risco. Rev Ciênc Saúde Coletiva. 2012;17(9):2223-36. http://dx.doi.org/10.1590/ S1413-81232012000900002.
36. Senserrick T, Boufous S, de Rome L, Ivers R, Stevenson M. Detailed analysis of pedestrian casualty collisions in Victoria, Australia. Traffic Inj Prev. 2014;15(Suppl 1):197-205. http://dx.doi.org/10.1080/15389588.2014.935 356. PMid:25307387.
37. Damsere-Derry J, Ebel BE, Mock CN, Afukaar F, Donkor P. Pedestrians Injury Patterns in Ghana. Accid Anal Prev. 2010;42(4):1080-8. http://dx.doi. org/10.1016/j.aap.2009.12.016. PMid:20441816.
38. Department of Transportation. Anuário estatístico [Internet]. Paraná: DETRAN; 2012 [cited 2017 Aug 11]. Available from: http://www.detran.
pr.gov.br/arquivos/File/estatisticasdetransito/anuario/ANUARIO_2012_N. pdf
39. Ossiander EM, Koepsell TD, McKnight B. Crash fatality and vehicle incompatibility in collisions between cars and light trucks or vans. Inj Prev. 2014;20(6):373-9. http://dx.doi.org/10.1136/injuryprev-2013-041146. PMid:24835235.
40. Lima MLC, Cesse EAP, Abath MB, Oliveira Júnior FJM. Tendência de mortalidade por acidentes de motocicleta no Estado de Pernambuco, no período de 1998 a 2009. Epidemiol Serv Saude. 2013;22(3):395-402. http:// dx.doi.org/10.5123/S1679-49742013000300004.