AR
TICLE
1 Departamento de Ensino sobre Violência e Saúde Jorge Careli, Escola Nacional de Saúde Pública, Fiocruz. Av. Brasil 4036/700, Manguinhos. 21040-361 Rio de Janeiro RJ Brasil. [email protected] 2 Coordenação de Vigilância Epidemiológica, Secretaria Municipal de Saúde do Rio de Janeiro. Rio de Janeiro RJ Brasil.
Analysis of factors associated with traffic accidents of cyclists
attended in Brazilian state capitals
Abstract Introduction: Brazil has the sixth larg-est bicycles fleet in the world and bicycle is the most used individual transport vehicle in the country. Few studies address the issue of cyclists’ accidents and factors that contribute to or prevent this event.
Methodology: VIVA is a cross-sectional survey
and is part of the Violence and Accidents Surveil-lance System, Brazilian Ministry of Health. We used complex sampling and subsequent data re-view through multivariate logistic regression and calculation of the respective odds ratios. Results:
Odds ratios showed greater likelihood of cyclists’ accidents in males, people with less schooling and living in urban and periurban areas. People who were not using the bike to go to work were more likely to suffer an accident. Discussion: The profile found in this study corroborates findings of other studies. They claim that the coexistence of cyclists and other means of transportation in the same urban space increases the likelihood of accidents.
Conclusion: The construction of bicycle-exclusive
spaces and educational campaigns are required.
Key words Traffic accidents, Bicycling, Epidemio-logical surveys, Accidents and Statistical modeling Carlos Augusto Moreira de Sousa 1
S
ousa CAM Introduction
With approximately 48 million bicycles, Brazil has the sixth largest fleet of bicycles in the world, behind only China, India, USA, Japan and
Ger-many1. Bicycle is the most used individual means
of transportation in the country. Bicycles share with pedestrians most normal movements of 90% of Brazilian municipalities’ total.
Despite this reality, the necessary infrastruc-ture for the use of bicycles in the country is not available everywhere and there are few studies on bicycles used as means of transport. Less is known about cyclists’ traffic accidents, despite being frequent in many countries, causing deaths and disabilities, especially in children and young
adults2-5.
Traffic accident-related studies point to
cy-clist data underreporting6. In Pelotas, Rio Grande
do Sul7, comparing information from police
re-ports and emergency care attendances for two years found 33.0% underreporting with regard to accidents with bodily injury for this group. In Londrina, Paraná, police records coverage for bicycle accidents was 8.0%, while car accidents
stood at 72.0%8.
Bacchieri and Barros9 show that
approxi-mately 1.2 million people worldwide die from traffic accidents every year and over 90% of these deaths occur in low- and middle-income coun-tries. It is worth noting that, in addition to family suffering for the deaths and physical disabilities, victims’ costs to health systems are high. The World Health Organization (WHO) estimates that annual losses due to Traffic Accidents exceed US$ 500 billion.
In Brazil, the number of deaths and serious injuries exceeds 150,000 people and the Institute of Applied Economic Research (IPEA) estimates that total annual costs of accidents are R$ 28 bil-lion. Cyclists’ deaths rose from 1% (396 deaths) to 4% (1,556 deaths) from 1998 to 2008, with peak recorded in 2006 (1,668 deaths).
In the period 2000-2010, 32,422 deaths of cyclists suffering traumas in traffic accidents (CTAT) in Brazil were identified, equivalent to
8.3% of all road traffic accidents1.
In Brazil, some information systems provide data on accidents involving cyclists, such as Po-lice Report (BO); Traffic Accident Registration Report of the National Traffic Department (DE-NATRAN); Work Accident Notification (CAT); Hospital Information System of the Unified Health System (SIH/SUS); Mortality Informa-tion System of the SUS (SIM/SUS) and the
Vi-olence and Accidents Surveillance System (VIVA – Survey).
Among these, we highlight the last three, since they are directly managed by the health sec-tor, they have data on the outcome of the acci-dent, they show the severity of the accident and some factors associated with the accident.
This study aimed to describe accidents in-volving cyclists registered in the VIVA survey conducted in 2014 and to analyze the factors as-sociated with these accidents.
Methodology
We used the 2014VIVA survey, which is part of the Violence and Accidents Surveillance Sys-tem, Ministry of Health, and aims to analyze the trend of violence and accidents and to describe the profile of violence (interpersonal or self-in-flicted) and accidents (traffic, falls, burns, among others) attended in Brazilian urgent and emer-gency care facilities.
The 2014 VIVA survey is the fifth survey con-ducted by this surveillance system. Its data was collected in 30 consecutive days from September to November 2014 in 12-hour shifts chosen by probabilistic draw in urgent and emergency care services within the Unified Health System. Shifts were used as primary sampling units (PSU) and facilities as strata of the sampling plan.
This survey included care provided in urgent and emergency care services located in 24 state capitals and the Federal District, as well as 11 se-lected municipalities.
This paper only included state capitals that participated in the VIVA survey in its analysis because they concentrate most attendances to ac-cidents and violence victims, totaling 86 urgent and emergency care services and accounting for 55,950 attendances. Accidents had 15,499 atten-dances, of which 1,652 refer to cyclists, represent-ing 10.7% of the total traffic accident attendance. Methodology was divided into two stages. The first stage addressed data description and the second stage conducted a multivariate analysis.
al-aúd
e C
ole
tiv
a,
21(12):3683-3690,
2016
cohol use in the last six hours (yes or no); area of event (urban, rural and periurban); use of bicycle to go to work (yes or no); use of safety equipment (yes or no); event occurred on the way to work (yes or no); nature of injury (amputation, cut/ laceration, sprain/strain, fracture, etc.); body part affected (mouth/teeth, head/face, abdomen/hip, upper or lower limbs, multiple organs/regions, among others) and evolution (discharge, hospi-talization, outpatient referral, death).
The multivariate logistic regression analysis for complex sample data used the following vari-ables: cyclist accident and other traffic accidents (yes = cyclist accident and no = other traffic acci-dents) as the dependent variable and the follow-ing variables: age (years); gender (male/female); schooling (0-4 years, 5-8 years, 9-11 years and 12 years and over); disability (yes or no); alcohol use in the last six hours, self-reported by the victim (yes or no); accident area (urban, rural and peri-urban), day of the event (Monday through Sun-day); and use of bicycle to go to work (yes or no) as possible variables associated with the event, or exposure variables.
Exposures treated in the study (covariates) were temporally associated with the cyclist acci-dent event because they occurred just prior to it, which enabled the assessment of the contributing factors to increase or reduce the likelihood of this
type of accident10.
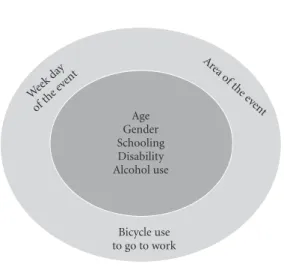
The model exposure covariates were included in blocks, according to the hierarchical analysis
proposed by Olinto et al.11, that is, more proximal
variables containing features related to individ-uals were included in the model first, and then more distal variables were further considered, because they were related to the event (Figure 1).
This study used the manual selection of
vari-ables as defined by Colosimo and Giolo12, which
defines the systematic removal of variables in the multivariate model according to statistical signif-icance. Initially, covariates inherent to the victim, such as age, gender, schooling, disability and the use of alcohol in the last six hours prior to the accident were included in the regression model.
Covariates with a p-value greater than 0.05 according to the Wald’s test were systematically manually removed from the model. The disabil-ity covariate with p-value of 0.993 was excluded from the model to enable a new adjustment. All other variables were significant, but one of the categories of the schooling variable (category 9-11 years schooling years) was not significant. Thus, we decided to make a new categorization of the schooling variable, with two new
catego-ries, namely, 0-8 schooling years and 9 schooling years and over.
Event-related covariates were inserted in the second stage of the manual covariates inclusion procedure, that is, the area and day of the event. After the inclusion of these two new covariates, the use of alcohol in the last six hours (p-value 0.212) and the day of the event (p-value 0.369) were not significant anymore and, therefore, were removed from the model. The variable area of the event was significant but was recoded into two categories – urban + periurban and rural, since the periurban category was not significant.
The bicycle use to go to work variable, which was significant (p-value 0.00) and was main-tained in the final model, was included in the regression in the third and final stage of manual inclusion of variables. However, the age variable became not significant (p-value 0.627) and was dropped from the final model. Odds ratios were calculated (OR) to assess the association between the crash event with cyclists and variables gender, schooling, accident occurred on the way to work and the area of the event.
The regression analysis was adjusted using
SPSS software13 version 20, in the complex
sam-ple module, applying logistic regression to eval-uate associations and odds ratios, between acci-dents with cyclists and other covariates selected
in the survey14,15.
The 2014 VIVA Survey study was approved by the National Research Ethics Commission (CONEP), the Ministry of Health.
Figure 1. Hierarchical model for the selection of variables tested in the model.
Week da y
of the e vent
Area o f the e
vent
Bicycle use to go to work
S
ousa CAM Results
Descriptive Analysis
Some 1,652 attendances for road traffic acci-dents involving cyclists were recorded at urgent and emergency care services and state capital emergencies participating in the 2014 VIVA Sur-vey. Of these, 75.1% (1,241) were male; in rela-tion to age group, 28% (463) were aged between 20 and 39 years, 26.5% (437) between 10 and 19 years, and 21.7% (358) were aged between 0 and 9 years.
Regarding race / skin color, 63.4% (1,047) were brown. Schooling mentioned was 0-4 years for 37.2% (615) of victims, followed by 5 to 8 years for 21.7% (359). Some 95.3% (42) of these victims did not have a disability.
State capitals with a higher proportion of attendances for road traffic accidents involving cyclists were Boa Vista (11.1% -184) and Brasilia (6% - 99), and those with lower proportions were Belo Horizonte (1.3% - 21) and Salvador (1.5% - 24). Regarding the area of the event, 93.8% (1,550) occurred in the capitals’ urban or peri-urban area.
These cyclists collided with a car in 23.2% (383) of the cases, and a motorcycle in 13.2% (218) of the cases. In 87.2% (1,440) of these cas-es, the victim was the driver of the bicycle, and 90.5% (1,495) did not use any safety equipment at the time of the accident.
The victim reported alcohol use in the six hours prior to the event in 10.8% (178) of these accidents, and 17.1% (282) of these occurred on the way to work. The nature of injury was cut/ laceration in 39.3% (649), and sprain/strain in 15.9% (263).
Of the injured cyclists, 31.5% (521) had their lower limbs affected, while 20.9% (346) had their upper limbs affected. In 17.3% (286) of these cases, multiple organs/body parts were affected. In 40% (661), attendance took place in the after-noon and in 30.6% (506) in the morning; 47.8% (790) were serviced from Monday to Wednesday; where 73.1% (1,208) were discharged and 11.1% (183) were hospitalized.
Analysis of factors associated with accidents (Logistic Regression)
The Table 1 shows the results of the multi-variate logistic regression for complex samples: Wald’s test, p-value, ORs values, confidence in-tervals and the final statistical model obtained.
Gender odds ratio (male x female) was 1.59, which indicates that men are 59.0% more like-ly to be victims of accidents when driving a bike when compared to women.
As for schooling, the odds ratio was 0.42, so the group of 9 and over schooling years is 58.0% less likely to suffer crash cycling compared people with 0-8 schooling years.
Odds ratio for those who suffered an accident on the way to work was 0.68, which indicates that whoever was on the way to work was 30.0% less likely to be an accident victim while riding a bike when compared to those using the bike for other activities.
Odds ratio for the area of the event was 3.24, indicating that the likelihood of accidents with cyclists in urban and periurban areas is 224.0% higher than the rural area.
Discussion
The profile of injured cyclists attended at the ser-vices participating in the VIVA Survey were con-sistent with other studies on the casualty profile for traffic accidents.
The Global Status Report on Road Safety of the World Health Organization shows that almost half of all traffic accidents deaths in the world involve most vulnerable victims (pedestri-ans, cyclists and motorcyclists), and death prob-ability for each type of victim varies by region. In the Americas, 3% of all traffic deaths occur among cyclists, 20% among motorcyclists and
22% among pedestrians16.
The vulnerability of cyclists partly occurs be-cause bicycles are hybrid vehicles, which some-times circulate as other vehicles and other some-times as pedestrians, contending with them sidewalks’
space17.
Bicycles’ shared traffic with motor vehicles is the main factor of insecurity, facilitating ac-cidents. This information was reiterated in this study where major accidents refer to the bicy-cle-car crash.
The predominance of accidents involving young men and was found in other studies, such
as that from Gawryszewski et al.18 in São Paulo,
which found that men and women accounted for 74.2% and 25.8% of total attendances, respec-tively; and that carried out in Londrina, where 50% of the victims were between 17 and 31 years
of age19.
This profile is repeated in international
aúd e C ole tiv a, 21(12):3683-3690, 2016
found that in Sweden, in the period 1987-1994, men were the most affected in accidents involv-ing bicycles, and younger people represented the most prevalent profile regarding age. Accidents involving women were less severe, with lower mortality for all types of vehicles, except bicycle. In this case, the fatality rate among women was 60% higher than among men.
In their study in emergency facilities in São
Paulo, Gawryszewski et al.18 noted that, in the age
group 0-4 years, 40.4% of attendances for traffic accidents had a cyclist as victim, while in the 10-14 years age group, these victims accounted for 62.5% of cases with injuries. In this study, it was not possible to determine the amount of these injuries sustained during recreational activities.
Lower schooling was associated with a higher risk of cyclists accidents in this study, a fact borne
out by a study conducted by Bacchieri et al.2 on
the use of bicycles among workers, which point-ed out that schooling had inversely proportional linear association with the outcome.
Authors demonstrated, in addition to the high prevalence of bicycle use among workers with low schooling level (33.9%), a probability approximately five times higher of those work-ers using the bike compared to workwork-ers with over nine years schooling.
Pezzuto21 notes that despite the potential use
of bicycle as a means of transport toward sus-tainable Brazilian cities, its use is higher for rec-reation purposes.
This data helps to explain the finding of this study, in which the likelihood of accidents at oth-er times than the commuting to work is highoth-er than the commute to work.
The greater frequency of accidents with cy-clists in times that were not transiting on the way to work also refers to the discussion of traf-fic vulnerable groups, since the age variable was no longer significant with the introduction of this variable in the multivariate analysis, which suggests that children in leisure activities are the most vulnerable age group.
Regarding the use of safety equipment, stud-ies show that the use of helmets among cyclists is low worldwide, despite evidence that its use can reduce around 63% to 88% of the risk of head
injury in this group22.
Regarding safety equipment required by the Brazilian Traffic Code (CTB), only 0.3% of the observed bikes were fully compliant, while 14.0%
were totally non-compliant9. Most of them
(55.0%) had only one of the required
equip-ment17.
Moreover, in a study conducted at seven
hos-pitals in Seattle, USA, Rivara et al.22 inferred that
the helmet use reduced by 93% the risk of death compared to those not using the device and that driving a bicycle over 15 mph increased by 2.6 times the risk of fatal accident.
Another important issue is cyclist accidents’ underreporting. The highest proportion of acci-dents with cut/laceration and sprain/strain as
na-OR
1.59
0.42
0.68
3.24
Table 1. Factors associated with accidents involving cyclists attended in the 2014 VIVA survey (numbers, proportions, Wald’s test, p-value, ORs, lower and upper limits of ORs’ confidence interval of 95%).
Wald F 16.4 16.4 12.6 34.8 Value p 0.00 0.00 0.00 0.00
Model: Cyclist ~ β0 (Interception) + β1*Gender+ β2*Schooling β3* Event on the way to work + β4*Area of event + Ɛ (error) Gender
Male Female Schooling 0-8 years 9 years and over Event on the way to work
Yes No Area of event
S
ousa CAM ture of injury suggest that accidents involving
cy-clists are mostly minor accidents and only those who sustained serious injuries go to the hospital. This fact is consistent with findings of this study, where most attendances for accidents involving cyclists resulted in discharge after treatment.
This is corroborated by Bacchieri and Barros9
as to the severity of the accident. It points out that 75.0% of cyclists had scrapes and abrasions, while 25.0% sustained injuries that are more se-rious. In Maringá, State of Paraná, pedestrians and cyclists showed 119% and 65% higher risk of hospitalization for traffic accidents, respectively, when compared to car occupants. In 1998, 47%
of deaths were pedestrians and cyclists23.
In Maringá, cyclists accounted for 18% of deaths from traffic accidents in 1992. The pattern of use of this means of transportation may be common in Brazilian rural cities, with mild tem-peratures and flat topography being an econom-ical alternative, especially among lower income
social groups24.
The largest proportion and likelihood of ac-cidents in urban and periurban areas can be ex-plained by the fact that data used in this study were from national capitals. Yet we can infer that underreporting is greater and severity lower in rural areas, often not reaching hospitals.
Finally, an important limitation of findings must be observed: since the group of individuals who had not suffered bicycle accidents is formed by individuals who have suffered other accidents, groups tend to be more homogeneous, because risk factors for the various types of traffic acci-dents overlap, which could lead to an underesti-mation of the results of the multivariate analysis.
It is important to consider that the VIVA sur-vey does not intend to extrapolate its findings to all hospitals that perform the same type of attendance in Brazil. Results can and should be extrapolated to the total attendances of hospitals that were part of the investigation in the Brazil-ian state capitals.
Conclusion
This study achieved the objective of analyzing the factors associated with the occurrence of ac-cidents with cyclists by examining the main caus-es, among those available in the database, com-paring their findings with literature and raising possible causal hypotheses that contribute to the occurrence of this type of accident.
Despite the findings and vulnerabilities found in this study, bicycle is one of the healthiest means of transport (if all safety aspects are pre-served), since it can bring many positive effects to people’s health, such as reducing the prevalence of chronic non-communicable diseases.
aúd
e C
ole
tiv
a,
21(12):3683-3690,
2016
References
Garcia LP, Freitas LRS, Duarte EC. Deaths of bicycle riders in Brazil: characteristics and trends during the period of 2000 - 2010. Rev. bras. Epidemiologia 2013; 16(4):918-929.
Bacchieri G, Gigante DP, Assunção MC. Determinantes e padrões de utilização da bicicleta e acidentes de trân-sito sofridos por ciclistas trabalhadores da cidade de Pelotas, Rio Grande do Sul, Brasil. Cad Saude Publica
2005; 21(5):1499-1508.
Bacchieri G, Barros AJD, Santos JV, Gonçalves H, Gi-gante DP. Intervenção comunitária para prevenção de acidentes de trânsito entre trabalhadores ciclistas. Rev
Saude Publica 2010; 44(5):867-875.
Bacchieri G, Barros AJ, Santos JV, Gigante DP. Cycling to work in Brazil: users profile, risk behaviors, and traf-fic accident occurrence. Accid. Anal. Prevention 2010; 42(4):1025-1030.
Barros AJ, Amaral RL, Oliveira MS, Lima SC, Goncal-ves EV. Acidentes de trânsito com vítimas: sub-registro, caracterização e letalidade. Cad Saude Publica 2003; 19(4):979-986.
Bastos YGL, Andrade SM, Cordoni Junior L. Acidentes de trânsito e o novo Código de Trânsito Brasileiro em cidade da Região Sul do Brasil. Informe Epidemiológico SUS 1999; (2):37-45.
Bastos YGL, Andrade SM, Soares DA. Características dos acidentes de trânsito e das vítimas atendidas em serviço pré-hospitalar em cidade do Sul do Brasil, 1997/2000. Cad Saude Publica 2005; 21(3):815-822. Biazin DT, Rodrigues RA. Perfil dos idosos que sofre-ram trauma em Londrina-Paraná. Rev. Esc.
Enferma-gem USP 2009; 43(3):602-608.
Bacchieri G, Barros AJD. Acidentes de trânsito no Brasil de 1998 a 2010: muitas mudanças e poucos resultados.
Rev Saude Publica 2011; 45(5):949-963.
Rothman KJ, Greenland S, Lash TL. Epidemiologia
mo-derna. 3ª ed. Porto Alegre: Artmed; 2011.
Olinto MTA, Victora CG, Barros F, Tomasi E. Determi-nantes da desnutrição infantil em uma população de baixa renda: um modelo de análise hierarquizado. Cad
Saude Publica 1993; 9(Supl. 1):S14-S27.
Colosimo EA, Giolo SR. Análise de Sobrevivência Apli-cada. São Paulo: Edgard Blucher; 2006.
IBM Corp. IBM SPSS Statistics for Windows, Version 20.0. Armonk: IBM Corp. Released; 2011.
Hosmer DW, Lemeshow S. Applied Logistic Regression. New Jersey: John Wiley e Sons; 1989.
Dobson A. Introduction to generalized linear models. London: Chapman & Hall; 2001.
World Health Organization (WHO). Global status
re-port on road safety 2015. Genebra: WHO; 2015.
Associação Brasileira de Medicina de Tráfego (ABRA-MET). Ciclistas: os mais novos vulneráveis do trânsito.
Revista ABRAMET 2013; 30(1):28-31.
Gawryszewski VP, Coelho HM, Scarpelini S, Zan R, Jor-ge MH, Rodrigues EM. Land transport injuries among emergency department visits in the state of São Paulo, in 2005. Rev Saude Publica 2009; 43(2):275-282. Andrade SM, Mello Jorge MHP. Características das ví-timas por acidentes de transporte terrestre em muni-cípio da Região Sul do Brasil. Rev Saude Publica 2000; 34(2):149-156.
1.
2.
3.
4.
5.
6.
7.
8.
9.
10. 11.
12. 13. 14. 15. 16. 17.
18.
19. Collaborations
S
ousa CAM Boström L, Nilsson B. A Review of Serious Injuries and
Deaths from Bicycle Accidents in Sweden from 1987 to 1994. J Trauma 2001; 50(5):900-907.
Pezzuto CC. Fatores que influenciam o uso da bicicleta
[dissertação]. São Carlos: Universidade Federal de São Carlos; 2002.
Peden M, Scurfield R, Sleet D, Mohan D Hyder AA, Jar-awan E, Mathers C. World report on road traffic injury prevention. Geneva: World Health Organization; 2004 Rivara FP, Thompson DC, Thompson RS. Epidemiolo-gy of bicycle injuries and risk factors for serious injury.
Injury Prevention 1997; 3(2):110-114.
Scalassara MB, Souza RKT, Soares DFPP. Característi-cas da mortalidade por acidentes de trânsito em loca-lidade da Região Sul do Brasil. Rev Saude Publica 1998; 32(2):125-132.
Faria EO, Braga MGC. Propostas para minimizar os riscos de acidentes de trânsito envolvendo crianças e adolescentes. Cien Saude Colet 1999; 4(1):95-107.
Article submitted 30/06/2016 Approved 05/09/2016
Final version submitted 07/09/2016 20.
21.
22.
23.