Rev. Caatinga
PREDICTION OF PHENOTYPIC AND GENOTYPIC VALUES BY BLUP/GWS
AND NEURAL NETWORKS
1ALISSON ESDRAS COUTINHO2*, DIOGO GONÇALVES NEDER3, MAIRYKON COÊLHO DA SILVA2, ELIANE
CRISTINA ARCELINO2, SILVAN GOMES DE BRITO2, JOSÉ LUIZ SANDES DE CARVALHO FILHO2
ABSTRACT - Genome-wide selection (GWS) uses simultaneously the effect of the thousands markers covering the entire genome to predict genomic breeding values for individuals under selection. The possible benefits of GWS are the reduction of the breeding cycle, increase in gains per unit of time, and decrease of costs. However, the success of the GWS is dependent on the choice of the method to predict the effects of markers. Thus, the objective of this work was to predict genomic breeding values (GEBV) through artificial neural networks (ANN), based on the estimation of the effect of the markers, compared to the Ridge Regression -Best Linear Unbiased Predictor/Genome Wide Selection (RR-BLUP/GWS). Simulations were performed by software R to provide correlations concerning ANN and RR-BLUP/GWS. The prediction methods were evaluated using correlations between phenotypic and genotypic values and predicted GEBV. The results showed the superiority of the ANN in predicting GEBV in simulations with higher and lower marker densities, with higher levels of linkage disequilibrium and heritability.
Keywords: Plant breeding. Correlation. Molecular markers.
PREDIÇÃO DE VALORES FENOTÍPICOS E GENOTÍPICOS VIA RR-BLUP/GWS E REDES
NEURAIS
RESUMO- A seleção genômica ampla (Genome Wide Selection - GWS) utiliza simultaneamente o efeito de
milhares de marcadores cobrindo todo o genoma para predizer o valor genético genômico dos indivíduos no processo de seleção. Os possíveis benefícios de seu uso são a redução do ciclo de melhoramento, propiciando maior ganho por unidade de tempo e diminuição de custos. O sucesso da GWS está atrelado a escolha do método de predição dos efeitos dos marcadores. Assim, neste trabalho, visou-se aplicar as redes neurais artificiais (Artificial Neural Networks - ANNs), com a finalidade de predizer os valores genéticos genômicos (Genomic Breeding Values - GEBVs) baseado na estimação dos efeitos dos marcadores comparados a
regressão de cumeeira – melhor preditor não viesado/seleção genômica ampla (Ridge Regression – Best Linear Unbiased Predictor/Genome Wide Selection – RR-BLUP/GWS). Foram efetuadas simulações por meio do software R, fornecendo as correlações referentes às ANNs e a RR-BLUP/GWS. Os métodos de predição foram avaliados utilizando correlações entre o valor fenotípico e valor genotípico com o valor genético genômico predito. Os resultados demonstraram superioridade das ANNs na predição dos GEBVs nos cenários com maior e menor densidade de marcadores, paralelo a níveis mais altos de desequilíbrio de ligação e maior herdabilidade.
Palavras-chave: Melhoramento genético. Correlação. Marcadores moleculares.
___________________
*Corresponding author
1Received for publication in 09/21/2016; accepted in 07/31/2017.
Paper extracted from the master thesis of the first author.
2Departament of Agronomy/Crop Science, Universidade Federal Rural de Pernambuco, Recife, PE, Brazil; [email protected] –
ORCID: 0000-0003-4716-0741, [email protected] – ORCID: 0000-0003-0708-959X, [email protected] – ORCID: 0000-0002-8421-0886, [email protected] – ORCID: 0000-0002-0981-1227, [email protected] – ORCID: 0000-0001-8473-4332.
3Center for Agricultural and Environmental Sciences, Universidade Estadual da Paraíba, Campina Grande, PB, Brazil;
INTRODUCTION
Genome-wide selection (GWS) consists of using hundreds to thousands of markers saturating the genome in order to predict genomic breeding values (GEBV) of the individuals through statistical methods based on the estimation of effects of markers. Genomic selection, unlike marker-assisted recurrent selection, uses all estimated effects of marker loci regardless of whether or not they are significantly associated with the phenotype in order to predict the GEBV of each individual in the population under selection (SINGH; SINGH, 2015).
The efficiency of GWS is related to the choice of the prediction method of the GEBV. Thus, several statistical methods have been used, such as the Best Linear Unbiased Prediction (BLUP) (HENDERSON, 1975), Stepwise Regression (MEUWISSEN; HAYES; GODDARD, 2001), Ridge Regression–BLUP (RR-BLUP) (MEUWISSEN; HAYES; GODDARD, 2001), Bayesian Estimation (MEUWISSEN; HAYES; GODDARD, 2001) and Artificial Neural Networks (EHRET et al., 2015).
The statistical models employed to predict GEBV provide different assumptions on the number and effects of Quantitative Trait Loci (QTL). Thus, the methods differ in general in the assumption on the genetic model associated with the quantitative character (RESENDE et al., 2008). RR-BLUP uses the same estimator as the ridge regression, but estimates the parameter penalized by the Restricted Maximum Likelihood (REML) (SCHULZ-STREECK; OGUTU; PIEPHO, 2011). In the RR-BLUP method, the effects of all markers are estimated simultaneously and are assumed as random and with the same allelic frequency, equally contributing to genetic variation (RESENDE et al., 2011).
Thus, the present work proposes the use of Artificial Neural Networks (ANN) compared to RR -BLUP, using simulated data, under different scenarios—different levels of heritability, linkage disequilibrium (LD) and loci numbers—providing information on what methods to use in such scenarios and make the use of GWS more efficient with real data. Some studies have already been conducted comparing methods through simulations under other scenarios—types and density of markers, and different heritability, and linkage disequilibrium (GUO et al., 2012; SOLBERG; SONESSON; WOOLLIANS, 2008).
Thus, GWS is useful in plant breeding, and its contributions can be seen in eucalyptus breeding with effects estimated via RR-BLUP (RESENDE et al., 2012). These authors found accuracy in predict GEBV of 0.74 to 0.88 for a Cenibra population, and of 0.55 to 0.73 for a Fibria population. Moreover, they found reduction in the breeding cycle of 75%, and the selection efficiency could reach 200% (Fibria) and 300% (Cenibra), depending on the
growth characteristics and quality of the evaluated wood. GWS has also showing its potential in simulated studies in annual crops such as corn and wheat (BERNARDO, 2009; LORENZANA; BERNARDO, 2009; WONG; BERNARDO, 2008).
In this context, the use of machine learning methods such as ANN in genomic selection has been promising in genomic prediction, as shown in animal breeding (GIANOLA et al., 2011; TUSELL et al., 2013; OKUT et al., 2013). However, few applications have been observed in animal and plant breeding. Thus, in the present work artificial neural networks were applied to evaluate their efficiency in predicting genomic breeding values of individuals within populations.
MATERIAL AND METHODS
Simulations of phenotypic and genotypic dataSimulations of the phenotypic and genotypic data were performed using 24 treatments, 100 replications, and population size of 1,000 individuals. The treatments consisted of absence of dominance under two levels of heritability, 20% and 40%—under the assumption that these values are similar to what is actually found for quantitative characters in breeding programs; six linkage disequilibrium levels (0.5, 0.6, 0.7, 0.8, 0.9 and 1.0); and different numbers of loci, 100 and 200, according to Resende Júnior (2010). The levels of heritability, linkage disequilibrium and the different numbers of loci adopted were the scenarios in which the simulations were performed comparing the RR -BLUP and the ANN.
The use of larger numbers of markers was limited due to computational resources, since it would be necessary to simulate thousands of markers used in hundreds of individuals under the number of replications, which would require much time, and the conclusion of the analyzes would be not possible. However, the number of markers used was assumed sufficient for the comparison between RR-BLUP/ GWS and ANN. The choosing of the scenarios was based on a given character that presents any of these characteristics; knowing in which there would be greater or lesser correlations between the phenotypic and predicted values; and comparing these same scenarios applied with other statistical methods (RESENDE et al., 2012).
Two alleles per locus were attributed for both phenotypic and genotypic simulations. The effect of the favorable allele in the genotype simulation procedure was simulated according to Resende
Júnior (2010), using the formula: 1 , wherein L is the L-th gene. The 1,000 individuals were simulated for the less favorable allele (-aL) according to the model f = g+e, wherein g is the sum
Rev. Caatinga
of the genetic effects of each locus and e is the environmental effects. These environmental effects are obtained from a normal distribution with mean 10 and variance compatible with the heritability tested (20% and 40%), by using the formula 2
, wherein is the environmental variance, is the genetic variance, and h2 is the heritability.
The phenotypic simulation was performed with 1,000 individuals, heritability of 20% and 40% and linkage disequilibrium of 0.5, 0.6, 0.7, 0.8, 0.9 and 1.0, and additive effects. In each individual, genotypes of type A1A1, A1A2, or A2A2 were randomly drawn at each locus and coded as 0, 1 and 2, respectively. Number 1 of the A1A1 and A1A2 genotypes denotes the unfavorable allele and the number 2 denotes the favorable allele. The simulations were performed in the R software (R CORE TEAM, 2015).
Estimation of genomic genetic values
2.σM2=σg 2(1-h2)
h2 σM2
σg2
Artificial neural networks (ANN)
The ANN used was the supervised learning, and the learning algorithm chosen to adjust the weights in the training phase was the backpropagation. The adjustment is performed by comparing the output values to the desired values. If the difference is not acceptable, it is necessary to adjust the weights.
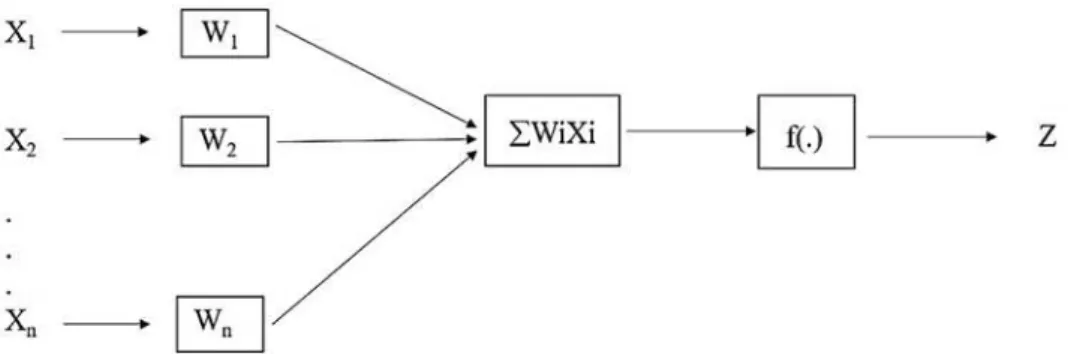
In the input layer, the values (X1, X2, X3 ..., Xn) correspond to the neurons that are multiplied by their respective weights wij which can assume positive or negative values (Table 1). The intermediate or processing layer represents the hidden layer and the output layer provides the GEBV (Figure 1). The neuron activation is achieved through the application of an activation function, which activates or not the output, and is provided by the sum of the product of the input data by the synaptic weights. This function of activation can be linear, sigmoidal, ramp function, and step function, and its result represents the predicted GEBV, which is the output signal, and is compared with the phenotypic and genotypic values (HESLOT et al., 2012).
Figure 1. Architecture of an artificial neural network: X1 and X2 are the input values; W is the synaptic weight associated with each input; f (.) is the activation function; and Z is the network output.
Backpropagation is a supervised algorithm that uses pairs (input, desired output) to adjust the network weights by an error correction mechanism. The training consists of two phases; each phase runs through the network in one direction. These phases are called forward and backward phase. The forward phase is used to define the output of the network for a given input pattern. The backward phase uses the desired output and the output provided by the
network to update the weights of its connections. In order to choose the model, networks with three layers were used, and different architectures were tested, varying the number of neurons in the middle layer and the function of activation between the sigmoidal and hyperbolic tangent, i.e., it was tested which factors together formed the best result network to be used in the development of the system (MARENDA et al., 2011).
Table 1. Architecture of the Artificial Neural Network (ANN) used for the prediction of genomic breeding values (GEBV).
Inputs Wij
X1 +
X2 -
... ...
The ANN configuration consisted of the following components: number of neurons in the input layer (100), number of interactions (20), learning rate (0.01), lower weight for neurons (0), and higher weight for neurons (0.2). These components were used for the prediction together with the number of individuals for the network learning (900), number of individuals for ANN validation (100), number of replications (100), number of individuals (1,000), number of genes (100 and 200) and number of interactions (0). Thus, the ANN configuration was simulated for 100 (100, 1,000, 100, 0, 0.4, 0.8, 900, 100, 100, 20, 0.01, 0, 0.2) and 200 simulates (200, 1,000, 200, 0, 0.4, 0.8, 900, 100, 200, 100, 0.04, 0.1). These configurations were established through tests performed by altering the values through simulation, choosing those in that the ANN outperform the RR-BLUP/GWS in most correlations. The analysis were performed using the RSNNS package (BERGMEIR; BENITEZ, 2012) in the software R (R CORE TEAM, 2015).
RR-BLUP/GWS
The prediction of the effects of markers according to the methodology proposed by Resende et al. (2008) is based on the mixed second linear model: y = Xb + Zh + e, wherein y is the vector of phenotypic observations; b is the vector of fixed effects; h is the vector of random effects of the markers—random residue vector. X and Z are the incidence matrices for b and h. The incidence matrix Z has the values 0, 1 and 2 referring to the number of alleles of the gene. The h is the number of intervals multiplied by 4, i.e., the number of possible haplotypes for each interval. The structure of means and variances were defined as follows: h ~ N (0, G); E(y+Xb); e ~ N (0, R= ); Var (y) = V = ZGZ’ + R; G = , wherein Ih has order 4; e is the variance of the effects of haplotypes in the ith interval; and n is the total number of intervals. The effects of vector h are adjusted as random covariates associated with phenotypes, thus, it is renamed as Ridge Regression (RR), also known as RR-BLUP/ GWS. The equations of the mixed model for the prediction of h via the RR-BLUP/GWS method are
equivalent to: . ,
wherein is the total genetic variance of the character; and is the residual variance. Thus, the genomic genetic value is given by the equation, in which Zi is equivalent to 0, 1 and 2.
The predictive capacity of artificial neural networks and RR-BLUP was obtained by comparing the mean correlation of the predicted and simulated genetic values (phenotypic and genotypic values).
Iσe 2
IσA 2
n
X'X X'Z
Z'X Z'X+I σe
2
(σg 2
n)
b
h = X'y Z'y
σg2 σe2
These RR-BLUP and ANN correlations were compared by the t-test at 5% significance level by observing the confidence intervals of the two methods for one of the treatments evaluated, i.e., those confidence intervals for correlations in which there was an overlap were classified as non-significant. Several configurations were tested
for the ANN, choosing the one that overperformed the RR-BLUP most of the time, and applied in the scenarios adopted. The simulation and estimation analyzes of the RR-BLUP/GWS were performed using the rrBLUP package (ENDELMAN, 2011), and then implemented in the R software (R CORE TEAM, 2015). The comparisons between the means of the RR-BLUP and the ANN correlations were performed by the t-test at 5% significance level.
RESULTS AND DISCUSSION
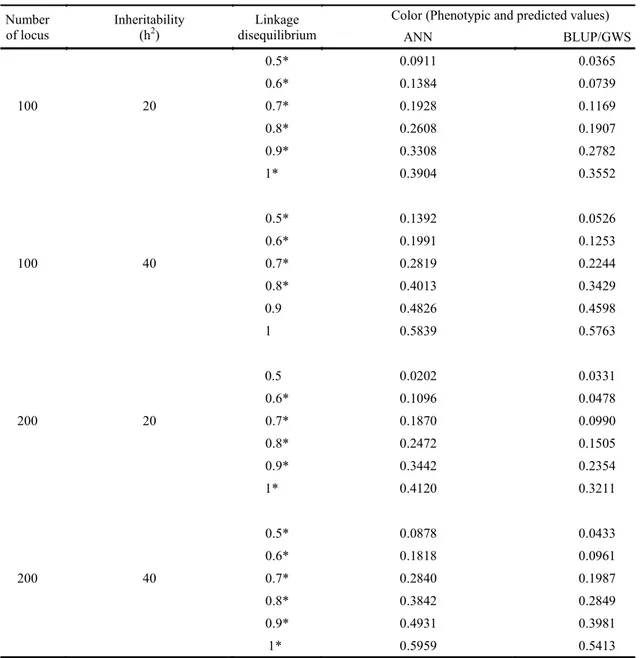
The mean correlations were higher for the following scenarios: 100 markers, linkage disequilibrium (LD) of 0.5, 0.6, 0.7, and 0.8 for 20% heritability; and LD of 0.5, 0.6, and 0.8 for 40% heritability, compared to the same LD using 200 markers (Table 2), between the phenotypic and predicted values for the ANN.
The use of a higher density of markers resulted in less predictive capacity. The 100 markers had superiority at all levels of LD and heritability, providing higher correlations and indicating greater predictability with RR-BLUP/GWS. Guo et al. (2012) found two situations: the reduction of density of markers from 1.6 cM to 20 cM reduced the prediction accuracy; and the reduction of density to 40 cM increased the accuracy from 0.26 (30 cM) to 0.29.
Lorenzana and Bernardo (2009) evaluated the accuracy of different numbers of markers and found an increase in accuracy in higher densities for BLUP in two-parent populations of maize (Zea mays L.), an Arabidopsis sp., and barley (Hordeum vulgare L.), for grain moisture, glucose content in maize, grain yield, and grain protein content (alpha amylase). According to these authors, the highest accuracies were obtained with more than 100 markers for the Arabidopsis sp., a double haploid of maize, and barley, and with 200 to 800 in a corn population from random crossing. Lenz et al. (2017) also identified lower accuracies by reducing density to less than 500 SNPs in a black spruce (Picea Mariana) population while assessing wood growth and quality.
Rev. Caatinga
effects, and the small degree of freedom to estimate the effects of markers (MEUWISSEN; HAYES; GODDARD, 2001).
These results for density of markers—higher values obtained using smaller number of markers—can be explained by the capture of more genes of greater effect than using high densities
(GUO et al., 2012). According to Muir (2007) and Clark, Hickey and Van der Werf (2011), increasing the number of phenotypes and genotypes in relation to the increase in the density of markers is also necessary. These results, however, are conditioned by the nature of the genetic control of the characters under study.
Table 2. Mean values of correlations between phenotypic and predicted values by Artificial Neural Networks (ANN) and via Best Linear Unbiased Prediction (BLUP)/genomic wide selection (GWS) methods for 100 and 200 genes, 20% and 40% heritability and linkage disequilibrium (LD) of 0.5; 0.6; 0.7; 0.8; 0.8; 0.9 and 1.0.
*Significant at 5% by the t test.
The density of markers needed to accurate predictions depends on the level of linkage disequilibrium between the markers and the gene (MEUWISSEN; HAYES; GODDARD, 2001). Moreover, the use of a greater percentage of individuals (12.5% to 100%) for the training population to estimate the effects of markers results
in higher accuracy (ZHAO et al., 2012). According to Guo et al. (2012), the density of markers, as well as the proportion of individuals used for the training population, have less influence on GWS than on marker-assisted selection.
Regarding the LD, the mean correlations for ANN for the LD level of 0.5 to 1.0 ranged from 0.09 Number
of locus
Inheritability (h2)
Linkage disequilibrium
Color (Phenotypic and predicted values)
ANN BLUP/GWS
0.5* 0.0911 0.0365
0.6* 0.1384 0.0739
100 20 0.7* 0.1928 0.1169
0.8* 0.2608 0.1907
0.9* 0.3308 0.2782
1* 0.3904 0.3552
0.5* 0.1392 0.0526
0.6* 0.1991 0.1253
100 40 0.7* 0.2819 0.2244
0.8* 0.4013 0.3429
0.9 0.4826 0.4598
1 0.5839 0.5763
0.5 0.0202 0.0331
0.6* 0.1096 0.0478
200 20 0.7* 0.1870 0.0990
0.8* 0.2472 0.1505
0.9* 0.3442 0.2354
1* 0.4120 0.3211
0.5* 0.0878 0.0433
0.6* 0.1818 0.0961
200 40 0.7* 0.2840 0.1987
0.8* 0.3842 0.2849
0.9* 0.4931 0.3981
to 0.39 and from 0.13 to 0.58 for 20% to 40% heritability, respectively. For RR-BLUP, the lowest and highest LD varied from 0.03 to 0.35 and from 0.05 to 0.57 for 20% and 40% heritability, respectively (Table 2). Therefore, when a character is under a LD of 0.5, the RR-BLUP/GWS method has not a good prediction of the genomic genetic value, and its use may not be viable in GWS in this condition. Contrastingly, these methods can better predict the genomic genetic value of a given character under a LD of 1.0. The correlations increased with increasing LD level, with values of
0.02 and 0.08 (LD = 0.5), and of 0.41 and 0.59 (LD = 1.0) for the ANN, showing the capacity of this
method in providing a good prediction under these conditions. The lowest averages found with the RR-BLUP/GWS were 0.03 and 0.04 (LD = 0.5) and the highest were 0.32 and 0.54 (LD = 1.0) (Table 2).
Hayes et al. (2009) also found greater
accuracy in the prediction of the GEBV with increasing LD in cattle breeding, with higher accuracy for LD>0.2. LD is specific to each population, thus, its measurement is recommended; and the dense genome coverage by markers is recommended to ensure that the prediction of most markers related to the agronomic character is in LD with QTLs (Quantitative Trait Loci) (SCHAPER et al., 2012).
Table 3 shows the LDs associated with the correlations between the predicted GEBV and genotype values. The mean correlations ranged from 0.18 to 0.89 and from 0.20 to 0.91 for 20% and 40% heritability, respectively, for ANN. Similarly, the mean values of the correlations were higher when using higher levels of LD in the simulation, thus, the prediction methods applied for these conditions may have good predictive capacity.
Table 3. Mean values of correlations between genotypic and predicted values by Artificial Neural Networks (ANN) and via Best Linear Unbiased Prediction (BLUP)/genomic wide selection (GWS) methods for 100 and 200 genes, 20% and 40% heritability and Linkage disequilibrium of 0.5, 0.6, 0.7, 0.8, 0.9 and 1.0.
Number of locus
Inheritability (h2)
Linkage disequilibrium
Color (Phenotypic and predicted values)
ANN BLUP/GWS
0.5* 0.1861 0.0755
0.6* 0.3188 0.1800
100 20 0.7* 0.4659 0.3004
0.8* 0.6076 0.4500
0.9* 0.7529 0.6273
1.0* 0.8911 0.8236
0.5* 0.2098 0.0965
0.6* 0.3253 0.2143
100 40 0.7* 0.4395 0.3475
0.8* 0.6222 0.5332
0.9* 0.7624 0.7226
1.0 0.9185 0.9175 0.5 0.0727 0.0464
0.6* 0.2226 0.1057
200 20 0.7* 0.4172 0.2121
0.8* 0.5761 0.3606
0.9* 0.7488 0.5100
1.0* 0.9355 0.7035
0.5* 0.1315 0.0554
0.6* 0.2912 0.1674
200 40 0.7* 0.4551 0.3026
0.8* 0.6244 0.4600
0.9* 0.7850 0.6342
1.0* 0.9470 0.8505
*Significant at 5% by the t test.
According to Habier, Fernando and Dekkers (2007), when the markers are in linkage disequilibrium with the QTL, the accuracy of the predicted GEBV is expected to be high. Zhong et al. (2009) evaluated GWS in barley populations and found that most of the evaluations that obtained better accuracy were under high LD (ZHONG et al., 2009). A low LD represents a low collinearity between markers, which hinders the ability of regression methods, reducing the identification of
Rev. Caatinga
According to Solberg, Sonesson and Woolliams (2008), LD is the main factor that increase the correlations between the predicted and phenotypic values; in the presence of a higher LD level higher correlations are found. In plants, the characters governed by many genes usually have low heritability. Therefore, heritability is another factor that, at higher percentage, increase correlations.
The simulations showed higher correlations between predicted GEBV and phenotype under 40% heritability for 100 and 200 marker alleles (Table 2). The same result was found for correlations between predicted GEBV and genotypic value with the same level of heritability, for 100 and 200 markers (Table 3). Different results were found by Guo et al. (2012) with RR-BLUP; they found predicted accuracy 12% higher for 60% and 70% heritability than for 80% and 90%.
A significant difference at 5% level by the t-test was found when comparing the simulations involving 100 genes with 20% heritability and LD of 0.5, 0.6, 0.7, 0.8, 0.9, and 1.0 between the ANN and RR-BLUP/GWS, based on the correlation means (Table 2). Thus, the ANN for this situation has higher predictive ability to estimate the phenotype compared to RR-BLUP/GWS. A significant difference was found for genotypic and predicted values, with ANN for all LD levels presenting better predictive capacity (Table 3).
Simulations with 100 genes with 40% heritability presented no significant difference for LD correlations of 0.9 and 1.0 between ANN and RR-BLUP/GWS (Table 2). Correlations between genotypic values and predicted GEBV presented no significant difference for the LD of 1.0 in 40% heritability between ANN and RR-BLUP/GWS (Table 3). The other LD levels (0.5, 0.6, 0.7, 0.8 and 0.9) presented a significant difference, with ANN presenting better predictive capacity compared to RR-BLUP/GWS.
Simulations involving 200 genes with 20% heritability, through ANN, presented higher correlations between phenotypic and predicted values, compared to RR-BLUP/GWS. The ability to predict the effects of phenotypes with increasing LD was higher for ANN compared to RR-BLUP/GWS (Table 2).
The simulations between the genotypic values and predicted GEBV with 20% heritability and 200 genes for the LD level of 0.5 presented no significant difference between the ANN and RR-BLUP/GWS correlations (Table 3). The other LD levels presented a significant difference, with higher values for ANN compared to RR-BLUP/GWS, indicating less than a 5% probability of this difference being by chance. Therefore, for the LD of 0.6, 0.7, 0.8, 0.9, and 1.0, ANN has higher ability to predict the effects of genotypes than the RR-BLUP/GWS.
The simulations with 40% heritability presented a significant difference for all LD for
correlations between predicted GEBV and genotype values. The t test indicates less than 5% probability of this difference being by chance (Table 3). Therefore, the ANN better estimates the effects of the markers than the RR-BLUP/GWS for these LD; and the ANN for this type of situation is a better predictor than the RR-BLUP/GWS for the effects of genotypes.
The importance of ANN in the genetic improvement of plants is confirmed in other studies. For example, in the characterization of Italian rice cultivars by Marini, Zupan and Magrì (2004), the ANN of Kohonen, used to group data, were able to predict more than 90% sample sets.
The potential application of ANN as a tool for genetic divergence analysis—an important step in the selection of contrasting individuals to be used in breeding programs—is represented in the results found by Barbosa et al. (2011). These authors reported the ANN generating four groups of papaya (Carica papaya L.) accessions with 90% of them correctly classified. This is another example of the potential of ANN to be used as a prediction method in GWS studies.
ANN was more accurate in predicting maize and soybean yields depending on climatic conditions—coefficient of determination (r2) of 0.77 for maize and 0.81 for soybean—compared to the Multiple Linear Regression—r2 of 0.42 for maize 0.46 for soybean (KAUL; HILL; WALTHALL, 2005).
Silva et al. (2014) applied ANN via simulated characteristics with 40% and 70% heritability to predict genetic values and gains. The authors identified more effectiveness in the selection using ANN than in that based on the genotypic mean estimated by maximum likelihood. Greater coincidences between selected and rejected genotypes based on predicted genetic values were also found for ANN than for the maximum likelihood.
Since the GWS presents more effects of markers (p) to be predicted than the number of evaluated individuals (n), a problem known as large p and small n. Therefore, there are no sufficient degrees of freedom to estimate all the effects of the marks simultaneously. Moreover, it overestimates the model in the training population caused by the multicollinearity between the markers, resulting in a low prediction capacity.
CONCLUSIONS
Higher prediction capacities are achieved under high and low marker densities with high levels of linkage disequilibrium and high heritability; under these conditions, Artificial Neural Networks outperform RR-BLUP/GWS in predicting genomic genetic values.
ACKNOWLEDGEMENTS
The authors thank the Federal Rural University of Pernambuco (UFRPE) for the institutional and financial support, and the Coordination for the Improvement of Higher Education Personnel (CAPES) for granting the scholarship.
REFERENCES
BARBOSA, C. D. et al. G. Artificial neural network analysis of genetic diversity in Carica papaya L. Crop Breeding and Applied Biotechnology, Viçosa, v. 11, n. 3, p. 224-231, 2011.
BERGMEIR, C.; BENITEZ, J. M. Neural Networks in R Using the Stuttgart Neural Network Simulator: RSNNS. Journal of Statistical Software, Innsbruck v. 46, n. 7, p. 1-26, 2012.
BERNARDO, R. Genomewide Selection for Rapid Introgression of Exotic Germplasm in Maize. Crop Science, Madison, v. 49, n. 2, p. 419-425, 2009. CLARK, S. A.; HICKEY, J. M.; VAN DER WERF, J. H. Different models of genetic variation and their effect on genomic evaluation. Genetics Selection Evolution, Nova Gales do Sul, v. 43, n. 1, p. 18, 2011.
EHRET, A. et al. Application of neural networks with back-propagation to genome-enabled prediction of complex traits in Holstein-Friesian and German Fleckvieh cattle. Genetics, Selection, Evolution: GSE, Nova Gales do Sul, v. 47, n. 1, p. 22-30, 2015. ENDELMAN, J. B. Ridge Regression and Other Kernels for Genomic Selection with R Package rrBLUP. Plant Genome, Madison, v. 4, n. 3, p. 250 -255, 2011.
GIANOLA, D. et al. Predicting complex quantitative traits with Bayesian neural networks: a case study with Jersey cows and wheat. BMC Genetics, London, v. 12, n. 1, p. 87-103, 2011.
GUO, Z. et al. Evaluation of genome-wide selection
efficiency in maize nested association mapping populations. Theoretical and Applied Genetics, Stuttgart, v. 124, n. 2, p. 261-275, 2012.
HABIER, D.; FERNANDO, R. L.; DEKKERS, J. C. M. The impact of genetic relationship information on genome-assisted breeding values. Genetics, Colorado, v. 177, n. 4, p. 2389-2397, 2007.
HAYES, B. J. et al. Invited review: Genomic selection in dairy cattle: progress and challenges. Journal of Dairy Science, Champaign, v. 92, n. 2, p. 433–443, 2009.
HENDERSON, C. R. Best linear unbiased estimation and prediction under a selection model. Biometrics, New York, v. 31, n. 2, p. 423-447, 1975.
HESLOT, N. et al. Genomic Selection in Plant Breeding: A Comparison of Models. Crop Science, Madison, v. 52, n. 1, p. 146-160, 2012.
JANSEN, R. C. Quantitative Trait Loci in Inbred Lines. In: BALDING, D. J. et al. (Eds.). Handbook of statistical genetics. 3. ed. London: Wiley, 2007. v. 1, cap. 18, p. 589-618.
KAUL, M.; HILL, R. L.; WALTHALL, C. Artificial neural networks for corn and soybean yield prediction. Agricultural Systems, California, v. 85, n. 1, p. 1-18, 2005.
LENZ, P. R. N. et al. Factors affecting the accuracy of genomic selection for growth and wood quality traits in an advanced-breeding population of black spruce (Picea mariana). BMC Genomics, Carbondale, v. 18, n. 1, p. 335, 2017.
LORENZANA, R.; BERNARDO, R. Accuracy of genotypic value predictions for marker-based selection in biparental plant populations. Theoretical and Applied Genetics, Stuttgart, v. 120, n. 1, p. 151 -161, 2009.
LIU, H. et al. The impact of genetic relationship and linkage disequilibrium on genomic selection. PloS one, San Francisco, v. 10, n. 7, p. e0132379, 2015. MARENDA, T. A. L. et al. Desenvolvimento de um sistema para classificação do mel em floral e melato por parâmetros físico químicos combinados com redes neurais artificiais. Evidência, Joaçaba, v. 11, n. 1, p. 61-74, 2011.
Rev. Caatinga
MEUWISSEN, T. H. E.; HAYES, B. J.; GODDARD, M. E. Prediction of total genetic value using genome-wide dense marker maps. Genetics, Colorado, v. 157, n. 4, p. 1819-1829, 2001.
MUIR, W. M. Comparison of genomic and traditional BLUP-estimated breeding value accuracy and selection response under alternative trait and genomic parameters: Journal of Animal Breeding and Genetics, Medford, v. 124, n. 6, p. 342–355, 2007.
OKUT, H. et al. Predicting expected progeny difference for marbling score in Angus cattle using artificial neural networks and Bayesian regression models. Genetics, Selection, Evolution: GSE, Nova Gales do Sul, v. 45, n. 1, p. 34-47, 2013.
R CORE TEAM. R: A language language and environment for statistical computing. R Foundation for Statistical Computing. Disponível em: <https://www.R-project.org/>. Acesso em: 10 jan. 2015.
RESENDE JÚNIOR, M. F. R. Seleçâo genômica ampla no melhoramento vegetal. 2010. 78 f. Tese (Doutorado em Genética e Melhoramento de Plantas) – Universidade Federal de Viçosa, Viçosa, 2010.
RESENDE, M. D. V. et al. Seleção genômica ampla (GWS) e maximização da eficiência do melhoramento genético. Pesquisa Florestal Brasileira, Colombo, v. Sup, n. 56, p. 63-78, 2008.
RESENDE, M. D. V. et al. Documentos/Embrapa Florestas. Métodos estatísticos na seleção genômica ampla. 2011. Disponível em: <https:// www.infoteca.cnptia.embrapa.br/infoteca/bitstream/ doc/921002/1/Doc.219finalizado.pdf>. Acesso em: 25 abr. 2017.
RESENDE, M. D. V. et al. Genomic selection for growth and wood quality in Eucalyptus: capturing the missing heritability and accelerating breeding for complex traits in forest trees. New Phytologist, Lancaster, v. 194, n. 1, p. 116-128, 2012.
SCHAPER, E. et al. Linkage disequilibrium under recurrent bottlenecks. Genetics, Heidelberg, v. 190, n. 1, p. 217-229, 2012.
SCHULZ-STREECK, OGUTU, J. O.; PIEPHO, H. P. Pre-selection of markers for genomic selection. BMC Proceedings, London, v. 5, n. 3, p. S12, 2011. SILVA, G. N. et al. Neural networks for predicting breeding values and genetic gains. Scientia Agricola, Piracicaba, v. 71, n. 6, p. 494-498, 2014.
SINGH, B.; SINGH, A. K. Marker-Assisted Selection. In: SINGH, B.; SINGH, A. K. (Eds.). Marker-Assisted Plant Breeding: Principles and
Practices. New Delhi: Springer, 2015. cap. 9, p. 259 -293.
SOLBERG, T.; SONESSON, A.; WOOLLIAMS, J. Genomic selection using different marker types and densities. Journal of Animal Science, Champaign, v. 86, n. 10, p. 2447-2454, 2008.
TUSELL, L. et al. Genome-enabled methods for predicting litter size in pigs: a comparison. Animal, Clermont-Ferrand, v. 7, n. 11, p. 1739-1749, 2013.
WONG, C. K.; BERNARDO, R. Genomewide selection in oil palm: increasing selection gain per unit time and cost with small populations. Theoretical and Applied Genetics, Stuttgart, v. 116, n. 6, p. 815-824, 2008.
ZHAO, Y. et al. Accuracy of genomic selection in European maize elite breeding populations. Theoretical and Applied Genetics, Stuttgart, v. 124, n. 4, p. 769-776, 2012.
ZHONG, S. et al. Factors affecting accuracy from genomic selection in populations derived from multiple inbred lines: a barley case study. Genetics, Colorado, v. 182, n. 1, p. 355-364, 2009.