University of the Algarve
Faculty of Sciences and Technology Master in Marine Biology
A global assessment of the effectiveness of different
protection levels in Marine Protected Areas of
tropical waters, following a new categorization.
By
Eliza Fragkopoulou
Thesis submitted for the partial fulfilment of the title of
Master of Science in Marine Biology
Supervisors:
Karim Erzini (FCT, CCMAR) [email protected]
Barbara Horta e Costa (CCMAR) [email protected]
Faro 2015
ii
Título da Tese: A global assessment of the effectiveness of different protection levels
in Marine Protected Areas of tropical seas, following a new categorization.
Declaração de autoria de trabalho:
Declaro ser a autora deste trabalho, que é original e inédito. Autores e trabalhos consultados estão devidamente citados no texto e constam da listagem de referências incluida.
Eliza Fragkopoulou
Copyright: Eliza Fragkopoulou
A universidade do Algarve tem o direito, perpétuo e sem limites geográficos, de arquivar e publicitar este trabalho através de exemplares impressos reproduzidos em papel ou de forma digital, ou por qualquer outro meio conhecido ou que venha inventado, de o divulgar através de repositórios científicos e de admitir a sua cópia e distribuição com objectivos educacionais ou de investigação, não comerciais, desde que seja dado crédito ao autor e editor.
iii
ABSTRACT
Marine Protected Areas (MPAs) are a common tool for conserving and managing marine and coastal ecosystems. MPAs encompass a range of protection levels, from fully protected areas (FPAs) to partially protected areas (PPAs), with restriction of particular activities, gear types or user groups. There is a growing body of scientific evidence supporting the ecological benefits of FPAs, but it is very difficult to generalize about the effects of partial protection, due to their high variability. However, it is critical to determine whether PPAs and FPAs provide similar ecological benefits, since the establishment of FPAs is in some situations a less popular strategy, due to the loss of fishing grounds and local sociopolitical antagonism. For the purpose of conducting a meta-analysis, we synthesized peer-reviewed studies comparing biological measures (biomass and density) of commercially targeted fish species in PPAs relative to FPAs and open access areas (OAs) across the tropical seas, resulting in a database of 33 PPAs. A new categorization scheme was used to group the different types of PPAs according to the extractive activities permitted within their boundaries, into three categories: highly regulated PPAs, moderately regulated PPAs, and weakly and very weakly regulated PPAs. The response to protection was examined in relation to PPA category, age and size. The present synthesis indicates that, overall, tropical PPAs generate greater biological responses in the biomass of targeted fish compared to OAs and demonstrate no significant differences when compared to FPAs. Grouping the PPAs according to uses allowed revealed that areas with highly regulated extraction exhibit greater biomass of targeted fish relative to areas with weakly regulated categories. The density of the targeted fish species did not demonstrate a response to the different protection regimes as strong as the biomass did. Although there was a high degree of variability in the magnitude of responses to protection, the age and size of the PPAs explained some of this variability. Overall, PPAs with limited and well regulated extraction activities may confer benefits and be a valuable conservation management option, especially, in areas where FPAs are not a viable option or in multi-zoning MPAs.
Keywords: Partially Protected Areas, categorization, effectiveness, meta-analysis,
iv
RESUMO
À medida que a população humana aumenta numerosas atividades vão-se concentrando ao longo das zonas costeiras, criando impactos e alterando os ecossistemas costeiros, ameaçando recursos naturais e degradando serviços dos ecossitemas. As Áreas Marinhas Protegidas (AMP) são consideradas ferramentas úteis para a conservação e gestão marinha. As AMP englobam um leque de níveis de protecção, desde áreas totalmente protegidas (ATP) sem atividades extrativas até áreas parcialmente protegidas (APP) com restrições de certas atividades, tipos de artes de pesca ou grupos de utilizadores. Existe um número crescente de evidências científicas que suporta a existência de benefícios ecológicos das ATP, sendo no entanto difícil generalizar esses efeitos para as APP, devido à sua elevada variabilidade. Dado que o estabelecimento de ATP é por vezes difícil devido à perda de locais de pesca e à resistência à sua implementação por motivos sociopolíticos, é crucial determinar qual o tipo de benefícios ecológicos fornecidos pelas APP, como é que se comparam com as ATP e dentro das PPA quais as diferenças que existem dentro de diferentes tipologias. Os planos de gestão das APP dependem das suas metas e dos seus objectivos. Por consequência, para se determinar a eficácia das APP é necessário proceder à caracterização de diferentes tipos de APP, identificando grupos de APP que partilham regras de utilização semelhantes como pré-requisito para aferir a sua eficácia. Surpreendentemente, existem apenas alguns estudos que examinam o potencial de variação de respostas ecológicas associado a diferentes tipos de APP. O presente estudo sintetiza a informação existente na literatura científica, comparando parâmetros biológicos (biomassa e densidade) de espécies-alvo das atividades comerciais em APP relativamente a ATP e áreas fora das zonas de proteção nas regiões tropicais Foram estudadas 33 APP diferentes neste trabalho.
Foi utilizada a nova classificação de AMP de Horta e Costa et al. (submitted) para agrupar os diferentes tipos de APP de acordo com as atividades de extração permitidas dentro dos seus limites, em três categorias: APP com extracção fortemente regulada, APP com extracção moderadamente regulada e APP com extracção fracamente regulada. A resposta à protecção foi analisada relativamente à classificação, idade e dimensão da APP.
Este estudo indica que as APP criam respostas biológicas mais elevadas na biomassa (log-rácio da resposta de espécies-alvo) de espécies-alvo de atividades comerciais, em
v
comparação com as áreas fora das zonas de proteção (𝑅̅ = 0.64 ± 0.31, 95% CI, p < 0.0001, n = 24) e demonstra a ausência de diferenças entre as APP e as ATP (𝑅̅ = -0.14 ± 0.32, 95% CI, p = 0.3958, n = 15). No que respeita à densidade de espécies-alvo não se observam diferenças relativamente às áreas fora das zonas de proteção (𝑅̅ = -0.13 ± 0.42, 95% CI, p = 0.5457, n = 21) nem às ATP (𝑅̅ = -0.12 ± 0.26, 95% CI, p = 0.3786, n= 17).
O agrupamento de APP baseado nas suas categorias revelou que àreas com extracção fortemente regulada exibiram uma maior biomassa de espécies-alvo relativamente a àreas com categorias fracamente reguladas. Mais especificamente, a biomassa é duas vezes maior relativamente às áreas fora das zonas de proteção (𝑅 ̅H-PPAS = 0.68 ± 0.32, 95% CI, p H-PPA< 0.0001, n H-PPAs = 12), enquanto que nas áreas fracamente reguladas a
biomassa não é significativamente diferente das áreas fora das zonas de proteção (𝑅̅ W-PPAs+ = -0.02 ± 0.36, 95% CI, p W-PPAs+ =0.9329, n W-PPAs+ = 4). A densidade destas espécies não apresentou um efeito claro em relação com os diferentes regimes de protecção, não existindo diferenças significativas quer relativamente às áreas fora das zonas de proteção, quer relativamente às ATP. A eficácia das APPs consoante a sua idade e tamanho é muito variável. A biomassa é positivamente relacionada com a idade quando comparada com as áreas fora das zonas de proteção e negativamente relacionada com o tamanho da APP comparativamente com as ATP. A densidade por seu lado é negativamente relacionada com o tamanho da APP relativamente às áreas fora das zonas de proteção.
Em conclusão, este estudo demonstra que as APP podem servir como uma importante ferramenta de conservação e gestão dos ecossistemas marinhos, uma vez que apresentam respostas ecológicas significativas na biomassa de espécies-alvo das atividades comerciais, tal como se observa nas ATP e que são significativamente mais elevadas quando comparadas com àreas fora das zonas de proteção. Em particular, as APP com atividades de extracção fortemente reguladas oferecem benefícios e são uma mais-valia na gestão de ecossistemas marinhos e na sua conservação, particularmente em regiões onde as ATP são difíceis de implementar ou em AMP com zonamentos múltiplos em que as APP são implementadas em conjunto com as ATP.
vi
ACKNOWLEDGMENTS
Before all, I would like to thank my supervisors Dr. Barbara Horta e Costa, Prof. Dr. Karim Erzini and Prof. Dr. Emanuel Gonçalves for their precious help, guidance, time and expertize. This thesis would not be possible without their contribution. A great thank you goes to Barbara Horta e Costa that had to deal with every panic crisis and desperate e-mail, and was always there to give solutions and guide me through this thesis. I would also like to thank Joachim Claudet for his help and expertise in the meta-analysis.
Special thanks to my new ‘family’ in Faro that made these two years unforgettable and were always next to me through my everyday life and my master. Thank you Joana, Zosia, Mirta, Nina and Carlos.
Finally, I want to thank my family for their continuous support through my life and studies. Thank you Gracja, Nionio and Tania for loving me and always helping me realize my dreams.
vii
TABLE OF CONTENTS
ABSTRACT ... iii
RESUMO ... iv
ACKNOWLEDGMENTS ... vi
TABLE OF CONTENTS ... vii
LIST OF FIGURES ... viii
LIST OF TABLES ... ix
INTRODUCTION... 1
MATERIALS AND METHODS ... 5
Database compilation ... 5
Data selection criteria ... 5
Categorization of the PPAs ... 6
Data cleaning ... 6
Final database ... 7
Meta-analysis ... 7
RESULTS ... 11
Effects of partial protection compared to open access areas (PPA: OA) ... 11
Effects of partial protection compared to full protection (PPA: FPA) ... 14
DISCUSSION ... 18
CONCLUSIONS ... 22
REFERENCES ... 23
viii
LIST OF FIGURES
Figure 1: Weighted mean log response ratio (R) of the biomass of targeted fish in
partially protected areas compared to the open access areas (PPA: OA) for each PPA category . ... 11
Figure 2: Weighted mean log response ratio (R) of the density of targeted fish in
partially protected areas compared to the open access areas (PPA: OA) for each PPA category. ... 12
Figure 3: Meta-regression plots of the log response ratios of partially protected areas
compared to open access areas (PPA: OA) with age and size of the PPA…………..14
Figure 4: Weighted mean log response ratio (R) of the biomass of targeted fish in
partially protected areas compared to the fully protected areas (PPA: FPA) for each PPA category ... 15
Figure 5: Weighted mean log response ratio (r) of the density of targeted fish in
partially protected areas compared to the fully protected areas (ppa: fpa) for each PPA category ... 16
Figure 6: Meta-regression plots of the log response ratios of partially protected areas
ix
LIST OF TABLES
Table 1: Summary of the weighted random effects meta-regression models for age and
size on targeted fish species biomass and density effect sizes comparing partially protected areas (PPAs) to open access areas (OAs; PPA: OA)……….13
Table 2: Summary of the weighted random effects meta-regression models for age and
size on targeted fish species biomass and density effect sizes comparing partially protected areas (PPAs) to fully protected areas (FPAs; PPA: FPA)………17
1
INTRODUCTION
Coastal zones are complex social-ecological systems, important for the development of many countries, as they provide important resources and numerous ecosystem services. Nevertheless, these areas are experiencing very high pressures, due to the increasing human populations and their numerous activities that are being concentrated along coasts. As a consequence, much of this impact is aggregated in coastal ecosystems, which are considered to be some of the most impacted and altered ecosystems worldwide (Adger et al. 2005), with habitat degradation and overfishing being among the most pervasive impacts (Halpern et al. 2008).
The ecosystem capacity to tolerate and adapt to any kind of disturbance, without collapsing into a qualitatively different state, is reflected by its resilience. The greater the resilience, the higher the capability of the ecosystem, in the face of change, to continue delivering resources and ecosystem services, that are essential for human livelihoods and societal development (Cicin-Sain & Belfiore 2005). It is now well recognized that the management and protection of our coastal zones is essential in order to increase the ecosystems’ resilience and to maintain the sustainability of goods and services that they provide (Agardy 2000; Mangi & Austen 2008; Pomeroy et al. 2005; Adger et al. 2005). One of the most common means of achieving these goals is the implementation of marine protected areas (MPAs).
A ‘marine protected area’ is a space in the ocean where human activities are more strictly regulated than the surrounding waters. The objectives of an MPA can vary depending on their conservation goals encompassing a combination of conservation, economic and social objectives, such as the protection of endangered or threatened species, or the protection of a unique habitat, a historical or cultural site (Agardy 2000; Babcock et al. 2010; Cicin-Sain & Belfiore 2005). Therefore, MPAs are increasingly being implemented throughout the world as a tool to meet a diversity of conservation, food security and fisheries management objectives.
In fact, there is convincing empirical evidence of the ecological benefits that no-take marine reserves or fully protected areas (FPAs) (where all extractive uses are prohibited) provide to the ecosystems. Such benefits include the increase of the density and biomass of the fishes within the FPA compared to open access areas (OAs) (e.g. Halpern 2003; Claudet & Osenberg 2010; Babcock et al. 2010) and in some cases
2
outside the FPA (e.g. Gell & Roberts 2003; Chapman & Kramer 1999), the increase of species richness (e.g. Cote et al. 2001; Lester et al. 2009) and the fact that they can contribute to the recovery of commercially harvested populations (García-Charton et al. 2008; Shears & Babcock 2003). Despite these benefits, the complete prohibition of all extractive activities can be hard to implement due to conflicts between conservation and socio-economic activities. Hence, the implementation of partially protected areas (PPAs), with less restrictive regulations, are increasingly preferred, as they can be a more viable management strategy, easier to establish and more acceptable to different stakeholders, especially in heavily exploited and densely populated systems (Denny and Babcock 2004; Lester and Halpern 2008).
Partially protected areas encompass a variety of protection measures and uses, and can lead to a greater socio-economic acceptance, while potentially still addressing the recovery and conservation of fisheries, habitats and ecosystem, and also contributing to an increase in the resilience of the social-ecological system. Nevertheless, in terms of ecological conservation, it can be argued that FPAs demonstrate greater ecological responses compared to PPAs (Edgar et al. 2014; Lester & Halpern 2008; Sciberras et al., 2015) as they completely exclude human activities. PPA regulations depend on their particular goals and management objectives and in turn, these regulations affect the ecological effectiveness of PPAs. When comparing FPAs to PPAs the results are extremely hard to generalise, mainly because of the large differences in the regulations between PPAs (Lester & Halpern 2008). Therefore, assessing the effectiveness of PPAs requires a characterisation of the different types of PPAs, while the identification of groups of PPAs that share similar regulatory features is a prerequisite to assess their effectiveness.
Whereas some studies have illustrated the ecological value of the PPAs when compared to FPAs and OAs (Shears et al. 2006; Shears & Usmar 2006; Lester & Halpern 2008; Ban et al. 2014; Kelaher et al. 2014; Sciberras et al. 2015), there have been only a handful of attempts to examine the potential variation in ecological responses due to the different types of PPAs. A recent study by Sciberras et al. (2015) provided some insights on the drivers that explained the ecological responses of the fish populations in PPAs of different protection regimes, by pooling the PPAs into three major protection regimes, obtained by categorizing some of the allowed fishing gears (see Sciberras et al. 2015). The magnitude of the responses of this study revealed the
3
existence of variability in the response to protection regimes within different PPAs. However, the study did not take into account all fishing activities or other types of uses allowed withing each PPA, which may also influence and drive the ecological responses. Ban et al. (2014) followed up on the work of Sciberras et al. (2015) and tried to estimate the effectiveness of the different IUCN categories empirically (see table 1 in Ban et al 2014), by re-analysing the data set of Sciberras et al. (2015) and categorizing the PPAs according to IUCN categories.
An obstacle to using the IUCN categories to estimate the effectiveness of the PPAs, arises from the high variety of uses that may not be taken into account when defining a category based on objectives, resulting in a mismatch between those objectives and the regulations. Indeed, the IUCN categorization guidelines recognised that the application of IUCN categories is often inaccurate in MPAs and as a global classification scheme their system is not of great relevance for marine environments (Dudley 2008). Instead, a new categorization scheme is proposed by Horta e Costa et al. (submitted) that classifies PPA variability, accounting for the diversity of design, regulations and activities that occur at the global scale, which is the main advantage over the Sciberras et al. (2015) approach where their aggregation is difficult to repeat due to the fact that one does not know exactly which were the criteria for including or rejecting the gears considered in their work.
This more detailed approach was developed under the BUFFER project
(http://www.criobe.pf/programmes/buffer/index.php), within which this study is integrated. The new categorization scheme enhances the evaluation of the ecological effects that socio-economic activities may have on the ecosystem, hence providing valuable information and supporting the implementation and management process of MPAs. For this purpose, eight categories have been proposed (3 for FPAs and 5 for PPAs), ranging from complete no access areas to almost unregulated areas. The final outcome is a simple, unambiguous and globally applicable categorization guideline.
For the purpose of this study, only the categories of the PPAs were used to evaluate the ecological responses of the MPAs of the tropical waters worldwide, as the FPAs ecological responses have been thoroughly studied elsewhere (e.g. Cote et al. 2001; Halpern 2003; Lester et al. 2009; Babcock et al. 2010; Claudet & Osenberg 2010). The study was focused on the tropical MPAs in order to maintain a more homogeneous
4
dataset in terms of species and habitat diversity (Lester et al. 2009). Understanding and being able to compare the different ecological effects of the various PPAs is becoming more essential, as the anthropogenic pressures and activities in the coastal ecosystems are increasing. This study is pioneering as it is one of the first aiming to investigate whether the various types of tropical PPAs have an effect on the ecological responses of commercially targeted fishes.
The principal aim of this study was therefore to assess the ecological value of PPAs when compared to FPAs and OAs, by estimating the impact of different protection types on the ecological responses obtained, by measuring changes in the density and biomass of commercially targeted fish species. In order to achieve this, the following steps were performed:
Compilation of a database of published studies that document the ecological effects of FPAs, PPAs and OAs.
Categorization of the various types of PPAs based on the guidelines developed by Horta e Costa et al. (submitted).
Performance of a weighted meta-analysis to identify the underlying trends in ecological responses and link them to different levels of protections.
Correlate the differences in response of ecological variables with other important covariates such as age and size of the PPAs.
5
MATERIALS AND METHODS
Database compilation
The first step of this study was the compilation of the database of peer-reviewed case studies. Initially, the selection of case studies started with the tropical MPAs on the list of the ongoing BUFFER project (Horta e Costa et al., submitted) and the ones listed in Appendices 2 and 3 of Sciberras et al. (2015). Thereafter, the systematic search for case studies continued following the protocol described in Sciberras et al. (2015).
Data selection criteria
The retained studies had to explicitly compare ecological variables of adjacent: i) PPAs to OAs; ii) PPAs to FPAs or iii) a combination of all three (PPAs vs. FPAs vs. OAs). In cases where a study reported paired inside-outside estimates from more than one MPA, each pair was included separately in the database (e.g. McClanahan et al. 2006; Frisch et al. 2012). When data were reported for two or more MPAs but only one control area (e.g. Tupper 2007), data estimates within each MPA were included separately and compared to the same control. For cases in which the data were reported aggregated (different zones of protection), the authors were contacted and requested to provide their raw data. However, as the author of only one study (Friedlander et al., 2007) responded by providing the raw data of the case study, the rest of the cases were excluded.
In addition, the case studies had to report at least one of the four following ecological response variables: density, biomass, species richness and size or age of the individuals of fish taxa. The studies also had to report the mean, sample size values (e.g. number of transects or point counts) and an appropriate error measure (standard deviation, standard error, variance or 95% CI). These values were extracted as presented from tables or within the text. When values were presented in figures, these were extracted using the data extraction software GetData Graph Digitizer. Moreover, only studies that used before-after control-impact (BACI) or after-control-impact (ACI) design (Osenberg et al. 1996) were considered for further evaluation. When several studies reported on the effects of protection for the same MPA, only the most recent study was considered (representation of the longest duration of protection), unless the studies measured different metrics (e.g. biomass, species richness) or presented data at different levels of aggregation (e.g. fish assemblage vs. species). Moreover, studies reporting
6
ecological responses of fish that were not affected by the protection regimes (and respective regulations) of the MPAs were excluded from the study. A complete list of case studies included in this study is given in Appendix 1 (Table S1). Finally, characteristics of the protected areas, such as size, location, age and enforcement were also recorded, as they can often explain heterogeneity in the response of marine organisms to protection (Cote et al. 2001; Halpern 2003; Claudet et al. 2008).
Categorization of the PPAs
The categorization of the PPAs followed the new categorization scheme developed within the BUFFER project (Horta e Costa et al. submitted). The various PPAs were categorised based on their regulations and their permitted activities. In each type of PPA different activities may be permitted, ranging from a none/low impact (non-extractive) activities to very high impact activities ((non-extractive), according to the different levels of uses of the PPAs (see Horta e Costa et al. submitted), resulting in five categories: 1) Highly regulated extraction PPA (H-PPA), 2) Moderately regulated extraction PPA (M-PPA), 3) Weakly regulated extraction PPA (W-PPA), 4) Very weakly regulated extraction PPA (VW-PPA) and 5) Unregulated extraction PPA (U-PPA).
Data cleaning
The initial intention of the study was to attempt to assess the ecological effects of PPAs by comparing the data from before-after control-impact (BACI) studies that account for both spatial and temporal variability in the environment (García-Charton et al. 2008). However, that was not possible as only a handful of studies were BACI while the majority of the studies followed the after control-impact (ACI) design. Furthermore, of the four ecological response variables, only the density and biomass were reported in a sufficient number of studies to allow robust analyses. The responses of some taxa (e.g. corals, invertebrates) and most aggregation levels (e.g. fish assemblages, fish families, non-commercially target species) were not reported in sufficient numbers, whereas the responses of commercially targeted fish species were reported in numerous studies, allowing robust analyses. Consequently, the assessment of the ecological effects of the different PPAs was done by using the density or/and biomass data for the commercially targeted fish species.
7
In cases where data were collected over the same year (e.g. seasonal sampling), data were averaged for that year, in order to eliminate any seasonal effects associated with the timing of sampling (Sciberras et al. 2015). Similarly, in some case studies (e.g. Tupper & Rudd 2002) where the ecological effect variables were reported separately for other variables (e.g. habitat type, depth), data were averaged over these values. Finally, when data were reported for multiple targeted species separately, the overall mean (𝑋̅𝑘) and standard deviation (𝑠𝑑𝑘 ) for the study were calculated as:
𝑋̅𝑘 = ∑ 𝑛𝑖 𝑋̅𝑖 𝑘 𝑖=1 ∑𝑘 𝑛𝑖 𝑖=1 and 𝑠𝑑𝑘 = √∑𝑘𝑖=1(𝑛𝑖− 1)𝑠𝑑𝑖2 ∑𝑘 (𝑛𝑖 𝑖=1 − 1)
where 𝑋̅ is the mean density or biomass for species 𝑖; 𝑠𝑑𝑖 𝑖 and 𝑛𝑖 are the standard deviation and sample sizes (e.g. number of transects) associated with 𝑋̅ . 𝑖
Final database
The final database resulted in 15 peer-reviewed research articles and 33 PPAs (Appendix 1, Table S1) located in tropical regions. Out of the 33 PPAs, 15 were categorised as H-PPAs, 14 as M-PPAs, 3 as W-PPAs and 1 as VW-PPA. Due to the small sample size of the latter two categories, the 4 PPAs were grouped into one category (W-PPA+) for the analyses. Of these, there were 24 PPAs reporting the biomass (12 H-PPAs, 10 PPAs, 4 W-PPAs+) and 21 the density (9 H-PPAs, 10 M-PPAs, 3 W-PPAs+) of the targeted fish.
Meta-analysis
In order to investigate if the different categories of PPAs have an effect on the density and biomass of targeted species compared to FPAs and OAs, a weighted meta-analysis was conducted. Meta-meta-analysis is a quantitative statistical approach that uses independent experiments and combines them across studies to produce a summary of the findings (Hedges et al. 1999). This is achieved by determining the overall effect, termed the effect size, which is independent from the sample size, allowing the use of studies with various sampling designs. However, since having equal experimental
8
designs in all of the studies used in a meta-analysis is almost impossible, to increase the precision of the estimates and the power of the test, a weight is applied to every study based on a measure of reliability (e.g. sample size), consequently increasing the precision of the combined estimate (Gurevitch et al. 2007; Hedges et al. 1999).
For the purpose of this study, a natural logarithm (Ln) response ratio of the mean (𝑋̅𝑖) density or biomass estimate, measured inside and outside (either OA or FPA) the PPA was used as an effect size (Ri) for each study i (Hedges et al. 1999):
𝑅𝑖 = 𝐿𝑛 ( 𝑋̅𝑃𝑃𝐴𝑖
𝑋̅𝑂𝐴 𝑖) or 𝑅𝑖 = 𝐿𝑛 ( 𝑋̅𝑃𝑃𝐴𝑖 𝑋̅𝐹𝑃𝐴 𝑖)
The use of the natural logarithm response ratio is commonly used as a measure of experimental effect in ecology, because, it quantifies the proportional change that results from the experimental manipulation (Hedges et al. 1999). Furthermore, the logarithm linearizes the metric, treating the deviations in the numerator the same way as the deviations in the denominator and thus is affected equally by changes in either numerator or denominator, while the simple ratio is affected more by changes in the denominator (especially when the denominator is small) (Hedges et al. 1999).
The variance associated with each Ri (within study variance) was calculated as:
𝑉𝑎𝑟𝑅𝑖 = 𝑠𝑑𝑃𝑃𝐴𝑖2 𝑛𝑃𝑃𝐴𝑖 𝑋̅𝑃𝑃𝐴𝑖2 + 𝑠𝑑𝑂𝐴𝑖 2 𝑛𝑂𝐴𝑖𝑋̅𝑂𝐴𝑖 2 when comparing PPAs to OAs, or as:
𝑉𝑎𝑟𝑅𝑖 = 𝑠𝑑𝑃𝑃𝐴𝑖2 𝑛𝑃𝑃𝐴𝑖 𝑋̅𝑃𝑃𝐴𝑖2 +
𝑠𝑑 𝐹𝑃𝐴𝑖2 𝑛 𝐹𝑃𝐴𝑖𝑋̅ 𝐹𝑃𝐴𝑖2
when comparing PPAs to FPAs, where 𝑋̅𝑃𝑃𝐴, 𝑋̅𝑂𝐴 and 𝑋̅𝐹𝑃𝐴 are the mean density or biomass inside and outside (OA or FPA) the PPA of the study i, the 𝑠𝑑𝑃𝑃𝐴, 𝑠𝑑𝑂𝐴, 𝑠𝑑𝐹𝑃𝐴 are the standard deviations associated with 𝑋̅𝑃𝑃𝐴, 𝑋̅𝑂𝐴 and 𝑋̅𝐹𝑃𝐴 of the study i, and 𝑛 is the sample size of the study i for the estimation of the mean (e.g. number of transects). In the case of this study, the weighting scheme incorporated the variance using a mixed effect meta-analysis as:
9
𝑤𝑖 = 1
𝑉𝑎𝑟𝑅𝑖+ 𝑉𝑎𝑟𝐴
where 𝑤𝑖 is the weight of study 𝑖, 𝑉𝑎𝑟𝑅𝑖 is defined as above and 𝑉𝑎𝑟𝐴 is the among-study variance that can be calculated as in Claudet et al. (2008) and is given by the model output. Consequently, the larger the within study variance, the lower the contribution of the study to the model. The weighted overall effect size for a sample of studies can be obtained as:
𝑅 =∑ 𝑤𝑖𝑅𝑖 𝑘 𝑖=1 ∑𝑘𝑖=1𝑤𝑖
where R is the weighted overall effect size, 𝑅𝑖 and 𝑤𝑖 are the effect size and weights associated with the study 𝑖, and 𝑘 is the number of studies (Claudet et al. 2008). All analyses were conducted in R using the Metafor package (Viechtbauer 2014).
Statistical tests
The meta-analyses were conducted to assess the differences in targeted fish biomass and density, between partial protection and open access areas (PPAs vs. OAs), and partial protection and full protection areas (PPAs vs. FPAs). The assessments for the biomass were done comparing 24 PPAs vs. OAs and 15 PPAs vs. FPAs respectively, while for the density 21 PPAs vs. OAs and 17 PPAs vs. FPAs were investigated (see Appendix 2&3).
Initially, an analysis to test the overall response to partial protection relative to OAs or FPAs was done, by conducting a weighted random effect analysis. The amount of heterogeneity in the analysis is measured by Cochran’s Q, which is calculated as the weighted sum of squared differences between individual study effects and the pooled effect across studies, and has an approximately χ2 distribution with k (number of
studies) minus 1 degrees of freedom (Viechtbauer 2014). Thereafter, in order to investigate the effect of the PPA category on the fish biomass and density, a weighted mixed effect meta-analysis was conducted, by adding the PPA category as an explanatory variable. The Qm statistic and associated p-value were used to test the significance of the explanatory variable, as it represents the heterogeneity of the data attributed to the explanatory variable (Hedges et al. 1999; Claudet et al. 2008). The weighted summary effect size across each PPA category was calculated as:
10 𝑅𝑐
̅̅̅ = ∑𝑘𝑖=1𝑤𝑖𝑅𝑖 ∑𝑘𝑖=1𝑤𝑖
where 𝑅̅̅̅ is the weighted summary effect size for PPA category 𝑐, 𝑅𝑐 𝑖 and 𝑤𝑖 are the effect size and weight for the study 𝑖, and 𝑘 is the number of studies belonging to the specific PPA category 𝑐 (Claudet et al. 2008). Specifically, a positive 𝑅̅̅̅ indicates a 𝑐 greater density or biomass inside the PPA than the OA or FPA, while negative values of 𝑅̅̅̅ represent lower density or biomass inside the PPA than the OA or FPA. 𝑐
For each 𝑅̅̅̅, confidence intervals were derived from the variances as: 𝑐 𝐶𝐼 = 𝑅̅̅̅ ± 𝑧𝑐 𝛼/2𝑉𝑎𝑟𝑅𝑐̅̅̅̅
where 𝐶𝐼 is the confidence interval, 𝑉𝑎𝑟𝑅𝑐̅̅̅̅ is the variance associated with the effect size 𝑅𝑐 for the category c and 𝑧 is the two-tailed critical value found from the standard normal distribution at the critical level 𝛼 (Claudet et al. 2008). The 𝑅̅̅̅ is considered to 𝑐 be significantly greater than zero when the 95% CI does not overlap zero, and the PPA categories are considered to be significantly different from each other when their 95% CI do not overlap. Lastly, in separate analysis, the significance of the effects of the age and size of the PPAs were investigated as continuous explanatory variables with the use of the Qm statistic, as these variables can often explain heterogeneity in the response of marine organisms to protection (Cote et al. 2001; Halpern 2003; Claudet et al. 2008).
11
RESULTS
Effects of partial protection compared to open access areas (PPA: OA)
There was an overall positive effect of partial protection in the biomasses of targeted fish species. Mean biomass was 2 times higher inside the PPAs compared with the adjacent OAs (log-response ratio of targeted fish biomass: 𝑅̅ = 0.64 ± 0.31, 95% CI, p < 0.0001, n = 24). This effect was, however, heterogeneous (Q = 1580.19, df = 23, p < 0.0001), suggesting that the effects of protection might vary among the PPAs.
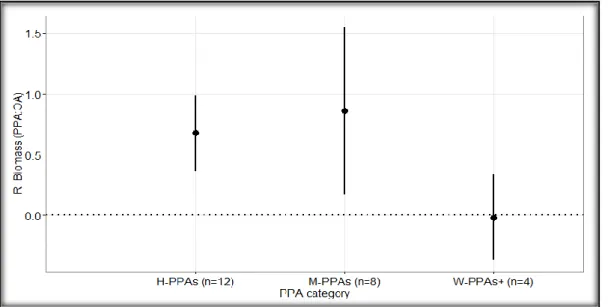
The PPA category significantly affected the biomass of targeted species (biomass: Qm = 22.8218, df = 3, p < 0.0001). In particular, biomass of targeted fish species in H-PPAs and M-H-PPAs was 2 and 2.4 times higher, respectively, within the partially protected area compared to the open access area (Figure 1;biomass in H-PPAs: 𝑅 ̅H-PPAS = 0.68 ± 0.32, 95% CI, p H-PPA< 0.0001, n H-PPAs = 12, and in the M-PPAs: 𝑅̅ M-PPAs =
0.86 ± 0.69, 95% CI, p M_PPAs =0.0142, n M-PPAs = 8). On the other hand, the biomass of
targeted fish species in the W-PPAs+ was not significantly different from that of the adjacent OAs, as it overlapped zero (𝑅̅ W-PPAs+ = -0.02 ± 0.36, 95% CI, p W-PPAs+ =0.9329, n W-PPAs+ = 4). The effect sizes of the biomass of targeted species did not differ statistically when compared in pairs of PPA categories, as the confidence intervals of the H-PPAs and M-PPAs fully overlap, while the W-PPAs marginally overlap the confidence intervals of the H-PPA (Figure 1).
Figure 1: Weighted mean log response ratio (R) of the biomass of targeted fish in partially protected areas compared to the open access areas (PPA: OA) for each PPA category (H-PPAs: highly regulated extraction PPAs; M-PPAs: moderately regulated extraction PPAs; W-PPAs+: weakly and very weakly regulated extraction PPAs). The sample size (n) of each PPA category is shown in parentheses. The horizontal dotted line at R = 0 represent equal fish biomass inside the PPA and the OA; R > 0 represents
12
higher biomass in the PPA, while R < 0 represents higher biomass in the OA. The bars represent the 95% confidence intervals.
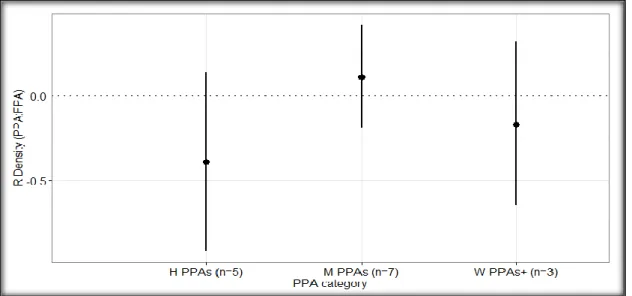
The effect of partial protection on the densities of targeted species was not statistically significant when compared to the adjacent OAs (log-response ratio of targeted fish densities: 𝑅̅ = -0.13 ± 0.42, 95% CI, p = 0.5457, n = 21). The heterogeneity of the overall effect was high (Q = 704.96, df = 20, p < 0.0001), suggesting that the effect of protection varied among the different PPAs.
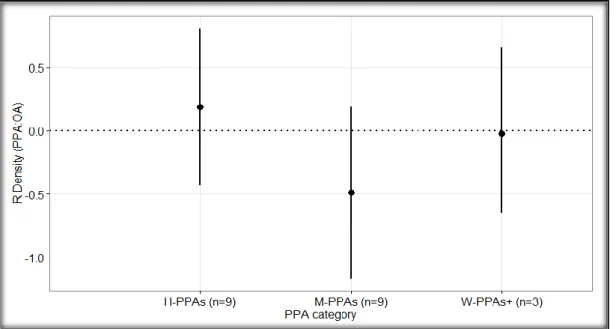
The PPA category did not significantly affect the density of the targeted species (density: Qm = 2.7064, df = 3, p = 0.4391). More specifically, there was a positive effect size on the density of targeted fish species in the H-PPAs when compared to open areas (Figure Y; 𝑅̅ H-PPAs = 0.19 ± 0.62, 95% CI, p H-PPAs =0.565, n H_PPAs = 9), but it was not statistically significant. On the contrary, the effect size on the fish densities in the M-PPAs was negative (𝑅̅ M-PPAs = -0.49 ± 0.68, 95% CI, p M-PPAs = 0.1575, n M-PPAs = 9), suggesting that the densities of the targeted species were higher in the OAs, but neither of these results were statistically significant (Figure 2). Finally there was no effect size in the densities of the targeted fish of the W-PPAs+ (𝑅̅ W-PPAs+ = -0.02 ± 0.62, 95% CI, p W-PPAs+ = 0.9411, n W-PPAs+ = 3). Despite, the different directions, the effect sizes of the densities of targeted species did not differ significantly among different PPA categories (Figure 2).
Figure 2: Weighted mean log response ratio (R) of the density of targeted fish in partially protected areas compared to the open access areas (PPA: OA) for each PPA category (H-PPAs: highly regulated extraction PPAs; M-PPAs: moderately regulated extraction PPAs; W-PPAs+: weakly and very weakly regulated extraction PPAs). The sample size (n) of each PPA category is shown in parentheses. The horizontal dotted line at R = 0 represent equal fish density inside the PPA and the OA; R > 0 represents
13
higher fish density in the PPA, while R < 0 represents higher fish density in the OA. The bars represent the 95% confidence intervals.
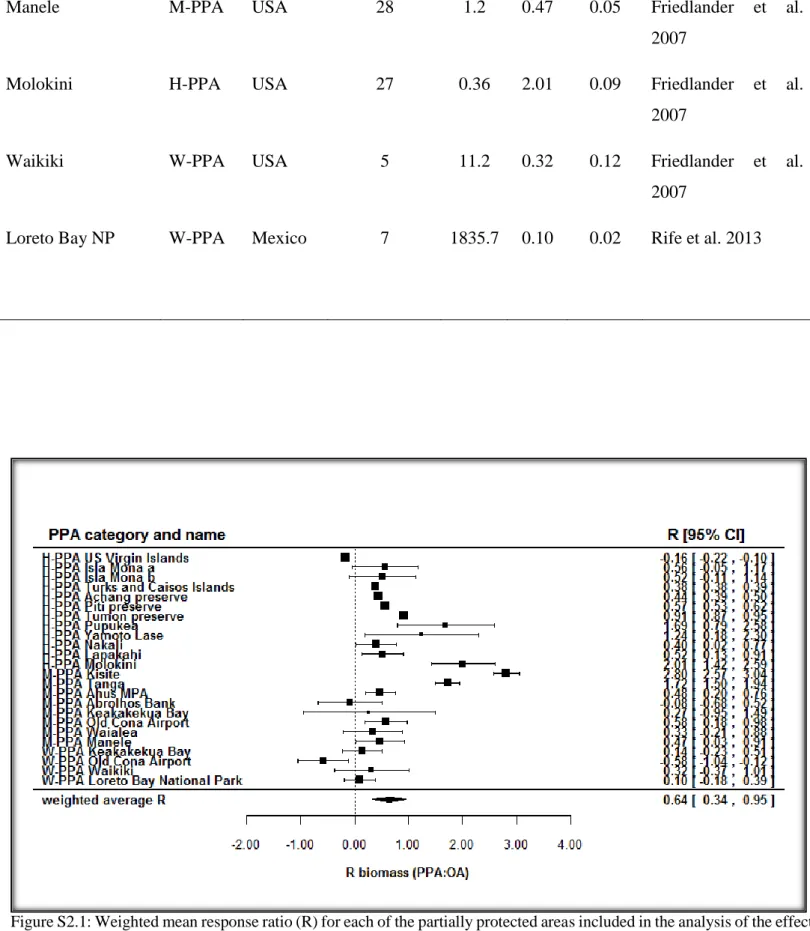
More detailed analysis on the results of individual PPAs comparing the effects of partial protection to the open access areas for biomass and density are available in Appendix 2 (Figure S2.1 & S2.2).
Influence of age and size on the ecological responses of the PPA over OA
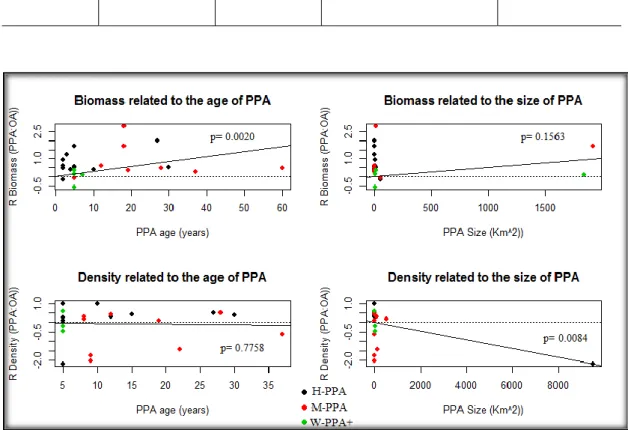
The effect size for the biomass of targeted fish species was significantly related to the age of the PPA (Table 1, Figure 3). For every year since protection, the mean biomass within the PPAs increased by 3% compared to the OAs. The age of the PPA did not have a significant effect on the densities of the targeted fishes (Table 1, Figure 3). The biomass of targeted fish species was not significantly related to the size of the PPA, while the density was significantly affected by the size of the PPA, suggesting a 0.1% decrease in the densities of targeted fish relative to the OAs, for every 10-fold increase of the PPA size (Table 1, Figure 3). Analyses were also run excluding the large PPAs. When the large PPAs were excluded, the size of the PPA had no significant effect on the densities of the targeted fish (Appendix 2, Table S2.3, Figure S2.3).
Table 1: Summary of the weighted random effects meta-regression models for each of the two explanatory variables (age and size) on targeted fish species biomass and density effect sizes comparing partially protected areas (PPAs) to open access areas (OAs; PPA: OA).
Targeted fish species 𝑅̅ (PPA:OA) Response variable Explanatory variable Number of PPAs
Slope (95% CI) p-value
Biomass Age (years) 24 0.0279 (0.0102 - 0.0455) 0.0020 *
Biomass Size (km2) 24 0.0005 (-0.0002 - 0.0012) 0.1563
14
Density Size (km2) 21 -0.0002 (-0.0004 -0.0001) 0.0084*
Figure 3: Meta-regression plots of the log response ratios of partially protected areas compared to open access areas (PPA: OA) with the age of the PPA (years) and the size of the PPA (km²) for biomass and density of targeted fish species. The different colours represent different PPA categories: black= highly regulated extraction PPAs (H-PPAs); red= moderate regulated extraction PPAs (M-PPAs); green= weakly and very weakly regulated extraction PPAs (W-PPAs+).
Effects of partial protection compared to full protection (PPA: FPA)
The weighted meta-analysis of the overall effect size of the PPAs compared to the FPAs did not reveal any statistically significant differences between PPAs and FPAs for both the biomasses and the densities of the targeted fish, despite the higher values on FPAs (biomass: 𝑅̅ = -0.14 ± 0.32, 95% CI, p = 0.3958, n = 15; density: 𝑅̅ = -0.12 ± 0.26, 95% CI, p = 0.3786, n= 17). In both cases, the effects were, however, significantly heterogeneous (Biomass: Q = 750.116, df = 14, p < 0.0001; density: Q = 66.6202, df = 16, p < 0.0001), suggesting that the effects of protection might vary among the PPAs.
The PPA category did not significantly affect the biomass and density of the targeted fishes when compared to the biomass and density of the FPAs (biomass: Qm = 1.7167, df = 3, p = 0.6332; density: Qm = 2.7064, df = 3, p = 0.4391).
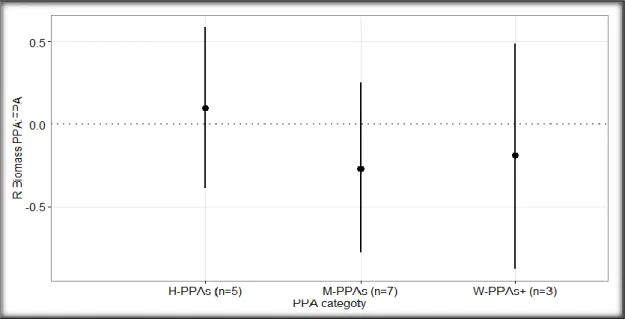
More specifically, the biomass in the H-PPAs was slightly (1.1 times) higher when compared to the FPA (Figure 4; 𝑅̅ H-PPAs = 0.10 ± 0.49, 95% CI, p H-PPAs =0.7237, n
15
H_PPAs = 5), but still the results were not significant. On the contrary, the effects on the fish biomasses in the PPAs and the W-PPAs+ were slightly negative (Figure 4; 𝑅̅ M-PPAs = -0.28 ± 0.47, 95% CI, p M-M-PPAs = 0.2520, n M-M-PPAs = 7; 𝑅̅ W-M-PPAs+ = -0.02 ± 0.75, 95% CI, p W-PPAs+ = 0.5969, n W-PPAs+ = 3), suggesting that the biomasses of the targeted species were higher in the FPAs, although neither of these results were statistically significant. The effect sizes of the biomass of targeted species were not significantly different when pairs of PPA categories were compared (Figure 4).
Figure 4: Weighted mean log response ratio (R) of the biomass of targeted fish in partially protected areas compared to the fully protected areas (PPA: FPA) for each PPA category (H-PPAs: highly regulated extraction PPAs; M-PPAs: moderately regulated extraction PPAs; W-PPAs+: weakly and very weakly regulated extraction PPAs). The sample size (n) of each PPA category is shown in parentheses. The horizontal dotted line at R = 0 represent equal fish biomass inside the PPA and the FPA; R > 0 represents higher fish biomass in the PPA, while R < 0 represents higher fish biomass in the FPA. The bars represent the 95% confidence intervals.
The effect size on the densities of targeted fish in the H-PPAs and W-PPAs+ was slightly negative (Figure 5; 𝑅̅ H-PPAs = -0.40 ± 0.42, 95% CI, p H-PPAs =0.0611, n H_PPAs = 5; 𝑅̅ W-PPAs+ = -0.17 ± 0.55, 95% CI, p W-PPAs+ = 0.5492, n W-PPAs+ = 4), although not statistically significant. On the other hand, the effect size in the M-PPAs was slightly positive (Figure 5; 𝑅̅ M-PPAs = 0.1 ± 0.34, 95% CI, p M-PPAs = 0.5798, n M-PPAs = 8) suggesting that the densities of targeted fishes in the M-PPAs were higher when compared to the FPAs, but the results were not significant. The effect sizes of the densities of targeted species were not significantly different when compared in pairs of PPA categories (Figure 5).
16
Figure 5: Weighted mean log response ratio (R) of the density of targeted fish in partially protected areas compared to the fully protected areas (PPA: FPA) for each PPA category (H-PPAs: highly regulated extraction PPAs; M-PPAs: moderately regulated extraction PPAs; W-PPAs+: weakly and very weakly regulated extraction PPAs). The sample size (n) of each PPA category is shown in parentheses. The horizontal dotted line at R = 0 represent equal fish density inside the PPA and the FPA; R > 0 represents higher fish density in the PPA, while R < 0 represents higher fish density in the FPA. The bars represent the 95% confidence intervals.
More detailed analyses on the results of individual PPAs comparing the effects of partial protection to the fully protected areas for biomass and density are available in Appendix 3 (Figure S3.1 & S3.2).
Influence of age and size on the ecological responses of the PPA over FPA
The size of the PPAs significantly affected the biomass of targeted fish species relative to the FPA (Table 2). The meta-regressions indicated a negative relationship between the PPA size and the biomass of targeted fish (Figure 6) as the slopes suggest a 1% decrease in the biomass of the targeted fish for each 10-fold increase in the size of the PPA (Table 2). The size of the PPAs had no significant effect on the density of the targeted fishes relative to the FPAs. The analyses were also run excluding the very large PPAs. When the large PPAs were excluded, the size had no significant effect on both the biomass and densities of targeted species (Appendix 3, Table S3.3, Figure S3.3). The age of the PPAs relative to the FPAs was not equal in all case studies. Analyses were run for both equal in age PPAs and FPAs (Table 2, Figure 6), but also including studies with unequal ages of PPAs and FPAs (Appendix 3, Table S3.3, Figure S3.3). In both cases, the age of the PPAs had no significant effect on the effect sizes for both fish densities and biomasses (Table 2, Figure S3.3).
17
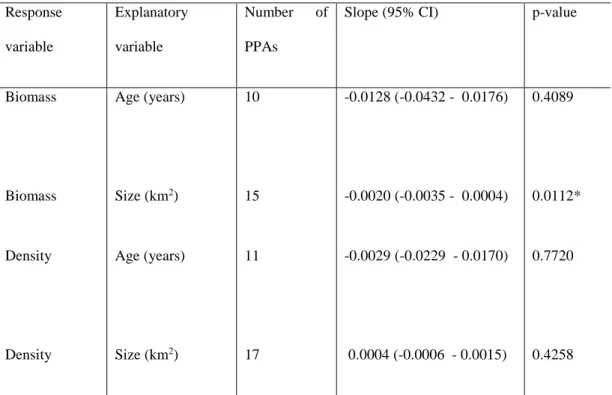
Table 2: Summary of the weighted random effects meta-regression models for each of the two explanatory variables (age and size) on targeted fish species biomass and density effect sizes comparing partially protected areas (PPAs) to fully protected areas (FPAs; PPA:FPA).
Targeted fish species 𝑅̅ (PPA:FPA) Response variable Explanatory variable Number of PPAs
Slope (95% CI) p-value
Biomass Age (years) 10 -0.0128 (-0.0432 - 0.0176) 0.4089
Biomass Size (km2) 15 -0.0020 (-0.0035 - 0.0004) 0.0112*
Density Age (years) 11 -0.0029 (-0.0229 - 0.0170) 0.7720
Density Size (km2) 17 0.0004 (-0.0006 - 0.0015) 0.4258
Figure 6: Meta-regression plots of the log response ratios of partially protected areas compared to fully protected areas (PPA: FPA) with the age of the PPA (years) and the size of the PPA (km²) for biomass and density of targeted fish species. The different colours represent different PPA categories: black= highly regulated extraction PPAs (H-PPAs); red= moderate regulated extraction PPAs (M-PPAs); green= weakly and very weakly regulated extraction PPAs (W-PPAs+).
18
DISCUSSION
This study investigated the main factors (particular management regimes, age and size) that several authors (Cote et al. 2001; Eddy et al. 2014; Claudet et al. 2008; Mosquera et al. 2000) have suggested to determine variation in the magnitude of responses to protection. The most surprising result was that the biomass of commercially targeted fish species in the PPAs was not significantly different relative to the FPAs, a result that is inconsistent with previous meta-analyses (Lester & Halpern 2008; Sciberras et al. 2015), while the biomass of the targeted fish was significantly higher in the PPAs when compared to the OAs, a result that is inconsistent with the analysis of Lester & Halpern (2008), that failed to detect significant effects of PPAs relative to OAs. These main results suggest that PPAs, at least those in tropical seas for which empirical studies exist, are more similar to FPAs than to OAs. An important difference between the present study and the one of Lester & Halpern (2008) is that the fish species reported in their study may not have been protected by the regulations of the PPA, leading to failure in detection of possible effects. On the contrary, the present study took into account fish species that were affected by the protection regimes of the PPAs. These findings suggest that the partial protection regimes in the PPAs of this study were a successful conservation tool with regard to biomasses of commercial fish. However, it is important to note that the PPAs included in the study are mainly highly and moderate regulated PPAs, as only 4 weakly or very weakly regulated PPAs (W-PPAs+) were included in the study. Despite the need of caution when interpreting results of different categories due to the lack of studies on less regulated PPAs, this study found that PPAs with more strict protection regimes (H-PPAs, M-PPAs) reported much greater biomasses of targeted fish species relative to the W-PPA+ category.
The fact that the biomass of the targeted fish in the PPAs was not significantly different to the one of the FPAs is unexpected (Lester & Halpern 2008; Sciberras et al. 2015), as complete elimination of the fishing pressure in the FPAs is expected to show greater response in the biomass of the targeted fish species. The inconsistency of these results with previous studies can be attributed to the fact that the PPAs were mostly strongly regulated, suggesting that the low impact uses allowed in these two categories (H-PPA and M-PPA) may result in positive conservation outcomes, a hypothesis that is supported by fact that the W-PPA+ category demonstrated similar biomasses of targeted fish to the OAs and it is marginally non significantly different to the highly
19
and moderately regulated PPAs. An alternative but non-mutually exclusive hypothesis is that the FPAs included in the study are not adequate for the protection of the targeted species, possibly because of to their size, design, location or due to illegal fishing or lack of compliance within their borders, and thus the FPAs do not compensate for the further exclusion of gears. However, since the positive effects of partial protection over open access exist, we may suspect that FPAs might not be reaching their full potentials, whereas PPAs are, at least, driving some positive outcomes, and this is why higher positives effects relative to the PPAs are not found.
The relationship between the densities of the targeted fish species to the different types of protection is more difficult to explain. No significant effects on the densities, neither between PPA and FPA nor PPA and OA, were found in this study, in contrast to the results of previous meta-analysis with PPA/FPA comparisons (Sciberras et al. 2015). Indeed, fish size and biomass are usually among the first indicators of protection effectiveness to be detected (Halpern 2003; Lester et al. 2009). In contrast, Lester & Halpern (2008) found that the effect of full protection relative to partial protection was only significant for the density and not for the biomass of targeted fish species. The variability in these studies is not surprising, given that there are a host of factors that can affect both the magnitude and the direction of an individual protected area response, including the biological and ecological characteristics of individual fish species (Claudet et al. 2010; Eddy et al. 2014), the characteristics of the area (Friedlander et al. 2007; Eddy et al. 2014), and the activities occurring outside and inside the protected area prior and after protection (Cote et al. 2001; Lester et al., 2009). In fact, concerning densities, the types of PPAs did not show any pattern consistent with the gradual exclusion of fishing gears towards more restricted PPAs, which suggests that most of the variability in the results described is probably related to alternative factors.
The age of the PPA had a positive effect on the biomass of targeted fishes of PPAs relative to the OAs, which suggests that the age matters, not only for the FPAs (Claudet et al. 2008), but apparently for PPAs too. The lack of a significant negative effect of the ecological responses on the PPA age relative to the FPA (with the same age) strengthens the previous hypothesis that FPAs included in this study may not be reaching their full potentials, as a lack of expected benefits of full over partial protection is revealed. This lack of benefits can be possibly attributed to the fact that i) FPAs may not be large enough to protect respective targeted species and thus their benefits are
20
shared and spread to the adjacent PPAs; ii) or that PPAs are better placed (e.g. spawning grounds) than FPAs; iii) or even that PPAs had lower historical levels of exploitation compared to FPAs prior to the MPA establishment, thus requiring more time to detect expected benefits of FPAs over PPAs, and demonstrating different rates and/or responses to protection (Edgar et al. 2009). Another important factor that should be taken into account is the different life spans of the fish, as fish with long life spans are benefited by longer protection (Claudet et al. 2008). In this analysis, it is hard to draw general conclusions about the age effect of the protected areas on the ecological effects of the fish species, as different fish species were used without taking into account their life spans. A more robust analysis considering the effect of the age of the protected area, whether FPA or PPA, would require more detailed peer reviewed data, which are not available.
The size of the PPAs included in this study varied from 0.13km² to 1914km², with 21 out of 33 PPAs covering an area less than 10km², and large PPAs not corresponding to large FPAs. The analyses revealed that the size of the PPA had a significant negative effect on the biomass of the targeted fish relative to the FPAs and a significant negative effect on the density of targeted fish relative to the OAs, supporting the findings of Claudet et al. (2008) that an increase of the PPA may attract users/fishers that expect or perceive spillover benefits from the adjacent FPAs. This increase in the fishing effort in the PPAs with increasing size may lead to a very negative slope in the PPA/FPA ratio, if the targeted species are efficiently conserved within the FPA and highly targeted in the PPA, contributing to a significant difference between PPA and FPA ratio. However, when the very large PPAs were excluded from the analyses, no significant effects of the size were detected, suggesting that those very few large PPAs were driving the previous results. Such areas may be hard to surveil and even if they are highly or moderately regulated PPAs, poaching or high fishing effort are more likely to occur due to the extensive area, possibly contributing to reducing expected benefits of conservation measures in those PPAs. Other factors, such as the location or age of PPAs, or the location of sites being surveyed in original studies, may influence results, so more studies comparing very large PPAs to adjacent FPAs and OAs are needed to support observed trends. A reason for not detecting any significant differences in the effect of the size of the PPAs (without few large PPAs), may be atributed to the fact that most of the leftover PPAs have relatively small sizes, potentially limiting any
21
meaningful test of the effect of PPA size on biological responses (Lester et al., 2009) or to the fact that smaller PPAs may be more strategically placed, for example on spawning grounds or along migratory routes, making their impact even greater (Halpern 2003).
Although this study investigated some of the main covariates that significantly affected the magnitude of responses of targeted fish to protection, there was a large amount of heterogeneity that remained unexplained. Studies in which the MPA area is studied prior to and after implementation, both outside and inside the MPA boundaries, are relatively rare. Such studies are critical because they effectively control for natural ecosystem dynamics and ecological variability on a regional scale, and can help detect the drivers of variability to protection responses (Mosquera et al. 2000). As already mentioned before, there is a lack of studies using a strong experimental design, such as the BACI, that could improve the interpretability of the data. Other information that can be used to interpret these kinds of studies is the existence of accurate data and methods for quantifying the intensity of fishing and other exploitive activities inside and outside of a MPA; information that may strongly affect the response documented within a particular MPA, and which could thus help to explain the large amount of variation in MPA responses globally.
Nevertheless, a large amount of leftover heterogeneity is not uncommon for meta-analyses (e.g. Cote et al. 2001; Claudet et al. 2008; Claudet & Fraschetti 2010; Lester & Halpern 2008; Sciberras et al. 2015) and can be attributed to the large differences in the aims, scope and quality of analyzed studies (Arnqvist & Wooster 1995). A disadvantage of using peer-reviewed studies can be the publication selection, which is the tendency for results that are statistically significant to be more likely to be published than those that fail to detect significance, and if severe publication selection exists, it can substantially bias estimates of observed (published) effects (Gurevitch et al. 2007; Hedges & Olkin 1985). Indeed, the database used in this study was mainly composed of studies on H-PPAs and M-PPAs, categories in which extraction is extremely limited and well regulated, and stronger responses are to be expected. In contrast, there were only 4 cases where W-PPAs+ (PPAs with lower levels of protection) were reported.
It is very important to understand that more than 11000 MPAs are listed globally (http://www.mpatlas.org/explore/) and that only 33 case studies of tropical seas were
22
used in this study. The fact that such a limited amount of available data fulfilled our search criteria should raise some thoughts in the scientific community about the weak experimental designs that are being followed, the poor data reporting and, contrary to what was expected, the lack of detailed studies in MPAs and respective zones, especially in those that are not fully protected or highly regulated, which are probably the most common existing MPAs and/or zones globally. Taking all this into account, although the meta-analysis based results presented in this study are only a snapshot of the situation of the PPAs around the tropics, they can nevertheless provide some useful insights on the effectiveness of PPAs.
CONCLUSIONS
Marine Protected Areas (MPAs) are a common tool for conserving and managing marine and coastal ecosystems, and their implementation requires a balance among conservation, social, economical and political goals. By now, there is strong scientific evidence that FPAs can provide ecological benefits, but there are not many studies investigating the possible effects of PPAs, mainly because of their differences in allowed activities and management objectives, and the lack of clear globally representative categorization of PPAs. This study found that PPAs, at least those in tropical seas for which empirical studies exist, could serve as a conservation tool, as they demonstrated significant ecological responses in the biomass of targeted fish species, similar to the ones of the FPAs and significantly higher when compared to the fished areas. This was the first study to use the new categorization scheme of PPAs (Horta e Costa et al. submitted) in order to investigate the responses to protection relative to the PPA different regimes in tropical seas. The response to protection was also examined relative to the age and size of the PPAs, and although much of the variability remained unexplained, the results suggest that PPAs with limited and well regulated extraction activities may confer benefits and be a valuable conservation management option, especially, in areas where FPAs are not a viable option.
23
REFERENCES
Adger, W., Hughes, T. & Folke, C., 2005. Social-ecological resilience to coastal disasters. Science, (June), pp.57–58.
Agardy, T., 2000. Mote symposium invited paper information needs for marine protected areas : scientific and societal. Bulletin of Marine Science, 66(3), pp.875– 888.
Arnqvist, G. & Wooster, D., 1995. Meta-analysis: Synthesizing research findings in ecology and evolution. Trends in Ecology and Evolution, 10(6), pp.236–240. Babcock, R.C., Shears, N. T., Acala, A. C., Barrett, N. S., Edgar, G. J., Lafferty, K. D.,
McClanahan, T. R., and Russ, G. R., 2010. Decadal trends in marine reserves reveal differential rates of change in direct and indirect effects. Proceedings of the National Academy of Sciences of the United States of America, 107(43), pp.18256–61.
Ban, N.C., McDougal, C., Beck, M., Salomon, A. K., and Cripps, K., 2014. Applying empirical estimates of marine protected area effectiveness to assess conservation plans in British Columbia, Canada. Biological Conservation, 180, pp.134–148. Chapman, M. & Kramer, D., 1999. Gradients in coral reef fish density and size across
the Barbados Marine Reserve boundary:effects of reserve protection and habitat characteristics. Marine Ecology Progress Series, 181, pp.81–96.
Cicin-Sain, B. & Belfiore, S., 2005. Linking marine protected areas to integrated coastal and ocean management: A review of theory and practice. Ocean & Coastal Management, 48(11-12), pp.847–868.
Claudet, J., Osenberg, C. W., Benedetti-Cecchi, L., Domenici, P., Garcia-Charton, J. A., Perez-Ruzafa, A., Badalamenti, F., Bayle-Sempere, J., Brito, A., Bulleri, F., Culiolo, J. M., Dimech, M., Falcon, J. M., Guala, I., Milazzo, M., Sanchez-Meca, J., Somerfield, P. J., Stobart, B., Vandeperre, F., Valle, C., and Planes, S., 2008. Marine reserves: Size and age do matter. Ecology Letters, 11, pp.481–489. Claudet, J. & Fraschetti, S., 2010. Human-driven impacts on marine habitats: A
regional meta-analysis in the Mediterranean Sea. Biological Conservation, 143(9), pp.2195–2206.
Claudet, J. & Osenberg, C., 2010. Marine reserves: fish life history and ecological traits matter. Ecological …, 20(3), pp.830–839.
Claudet, J., Osenberg, C. & Ertocci, I.B., 2010. Marine reserves: fish life history and ecological traits matter. Ecological …, 20(3), pp.830–839.
Cote, I.M., Mosqueira, I. & Reynolds, J.D., 2001. Effects of marine reserve characteristics on the protection of fish populations: a meta-analysis. Journal of Fish Biology, 59(sa), pp.178–189.
24
Denny, C.M. & Babcock, R.C., 2004. Do partial marine reserves protect reef fish assemblages? Biological Conservation, 116(1), pp.119–129.
Dudley, N., 2008. Guidelines for applying protected area management categories. Gland, Switzerland: IUCN. x = 88pp
Eddy, T.D., Pande, A. & Gardner, J.P. a., 2014. Massive differential site-specific and species-specific responses of temperate reef fishes to marine reserve protection. Global Ecology and Conservation, 1, pp.13–26.
Edgar, G., N. Barrett, K. Crane, and k. Bancoft, 2009. Ecosystem monitoring of subtidal reefs in different management zones in the Jurien Bay Marine Park 1999–2007. TAFI International Report:pp.1-57.
Friedlander, A.M., Brown, E. & Monaco, M.E., 2007. Defining reef fish habitat utilization patterns in Hawaii: Comparisons between marine protected areas and areas open to fishing. Marine Ecology Progress Series, 351, pp.221–233.
Friedlander, A.M., Brown, E.K. & Monaco, M.E., 2007. Coupling Ecology and GIS to Evaluate Efficacy of Marine Protected Areas in Hawaii. Ecological Applications, 17(3), pp.715–730.
Frisch, A.J., Cole, A. J., Hobbs, J. A., Rizzari, R., and Munkres, K. P., 2012. Effects of Spearfishing on Reef Fish Populations in a Multi-Use Conservation Area. PLoS ONE, 7(12).
García-Charton, J. A., Perez-Ruzafa, A., Marcos, C., Claudet, J., Badalamenti, F., Benedetti-Cecchi, L., Falcon, M. J., Milazzo, M., Schembri, P. J., Stobart, B., Vandeperre, F., Brito, A., Chemello, R., Dimech, M., Domenici, P., Guala, I., Le Direach, L., Maggi, E., and Planes, S., 2008. Effectiveness of European Atlanto-Mediterranean MPAs: Do they accomplish the expected effects on populations, communities and ecosystems? Journal for Nature Conservation, 16(4), pp.193– 221.
Gurevitch, J., Hedges, L. V & Jun, N., 2007. Statistical Issues in Ecological Meta-Analyses. Ecology, 80(4), pp.1142–1149.
Halpern, B., 2003. The impact of marine reserves: do reserves work and does reserve size matter? Ecological applications, 13(1).
Halpern, B.S., Walbridge, S., Selkoe, K. A., Kappel, C. V., Micheli, F., D'Agrosa, C., Bruno, J. F., Casey, K. S., Ebert, C., Fox, H. E., Fujita, R., Heinemann, D., Lenihan, H. S., Madin, E. M. P., Perry, M. T., Selig, E. R., Spalding, M., Steneck, R., and Watson, R., 2008. A global map of human impact on marine ecosystems. Science (New York, N.Y.), 319(5865), pp.948–952.
Hedges, L. V., Gurevitch, J. & Curtis, P.S., 1999. The meta-analysis of response ratios in experimental ecology. Ecology, 80(4), pp.1150–1156.
25
Hedges, L. V. & Olkin, I., 1985. Statistical methods for meta- analysis. Academic Press, New York, USA: Academic Press, New York.
Kelaher, B.P., Coleman, M. A., Broad, A., Rees, M. J., Jordan, A., and Davis, A. R., 2014. Changes in fish assemblages following the establishment of a network of no-take marine reserves and partially-protected areas. PLoS ONE, 9(1).
Lester, S., Halpern, B. S., Grorud-Colvert, K., Lubchenco, J., Ruttenberg, B. i., Gaines, S. D., Airame, S., and Warner, R. R., 2009. Biological effects within no-take marine reserves: a global synthesis. Marine Ecology Progress Series, 384, pp.33– 46.
Lester, S. & Halpern, B., 2008. Biological responses in marine no-take reserves versus partially protected areas. Marine Ecology Progress Series, 367, pp.49–56. Mangi, S.C. & Austen, M.C., 2008. Perceptions of stakeholders towards objectives and
zoning of marine-protected areas in southern Europe. Journal for Nature Conservation, 16(4), pp.271–280.
McClanahan, T.R., Verheij, E. & Maina, J., 2006. Comparing the management effectiveness of a marine park and a multiple-use collaborative fisheries management area in East Africa. Aquatic Conservation: Marine and Freshwater Ecosystems, 16(July 2004), pp.147–165.
Mosquera, I., Cote, I. M., Jennings, S., and Reynolds, J. D., 2000. Conservation benefits of marine reserves for fish populations. Animal Conservation, 3(4), pp.321–332. Osenberg, Craig W.; Smitt, j. R., 1996. Detecting Ecological Impacts. Concepts and
Applications in Coastal Habitats, (i), pp.3–16.
Pomeroy, R.S. Watson, L., Parks, J. and Cid, G. A., 2005. How is your MPA doing? A methodology for evaluating the management effectiveness of marine protected areas. Ocean & Coastal Management, 48(7-8), pp.485–502.
Sciberras, M.,R. Jenkins, R. Mant, M. J. Kaiser,S. J. Hawkins, and A. S. Pullin., 2015. Evaluating the relative conservation value of fully and partially protected marine areas. Fish and Fisheries, 16 pp.58-77.
Shears, N.T., Grace, R. V., Usmar, N. R., Kerr V., and Badcock, R. C., 2006. Long-term trends in lobster populations in a partially protected vs. no-take Marine Park. Biological Conservation, 132(2), pp.222–231.
Shears, N.T. & Babcock, R.C., 2003. Continuing trophic cascade effects after 25 years of no-take marine reserve protection. Marine Ecology Progress Series, 246, pp.1– 16.
Shears & Usmar, 2006. Response of reef fish to partial and no-take protection at Mayor Island (Tuhua). DOC Research & Development Series, 243, pp.1–31.
26
Tupper, M.H., 2007. Spillover of commercially valuable reef fishes from marine protected areas in Guam, Micronesia. Fishery Bulletin, 105, pp.527–537.
Tupper, M.H. & Rudd, M.A., 2002. Species-specific impacts of a small marine reserve on reef fish production and fishing productivity in the Turks and Caicos Islands. , 29(4), pp.484–492.
Viechtbauer, W., 2014. Meta-Analysis Package for R. Journal of Statistical Software, p.229.
27
APPENDIX
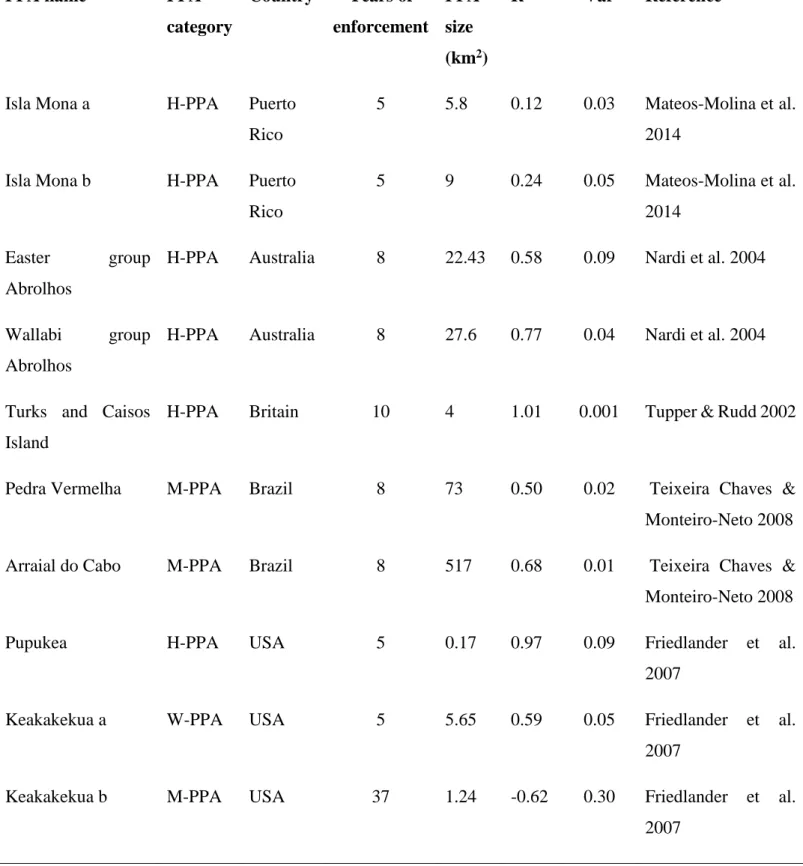
Appendix 1: The summary of studies corresponding to the search criteria.
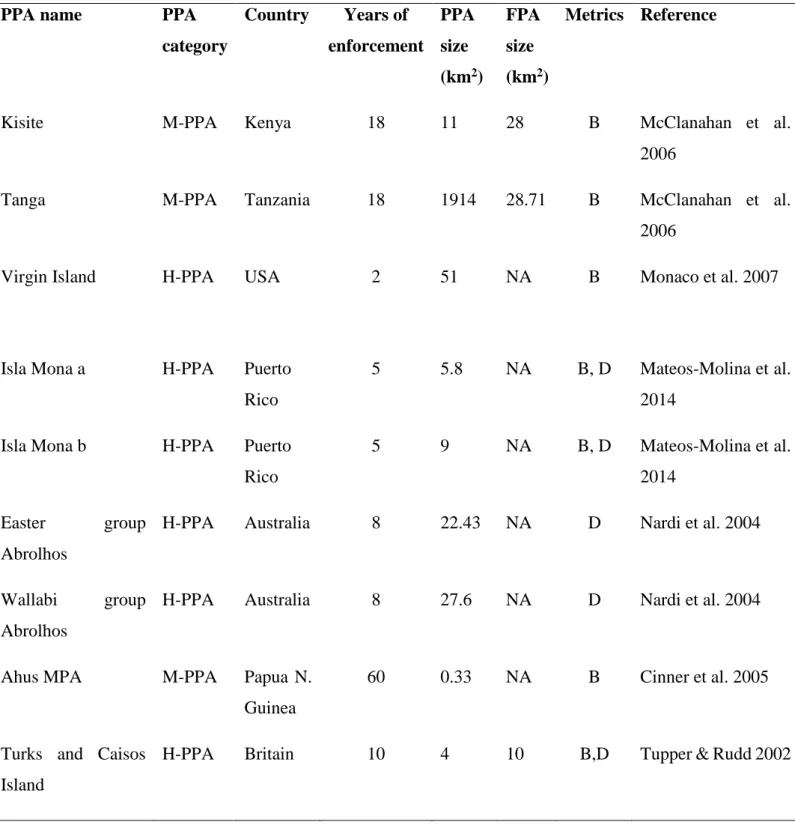
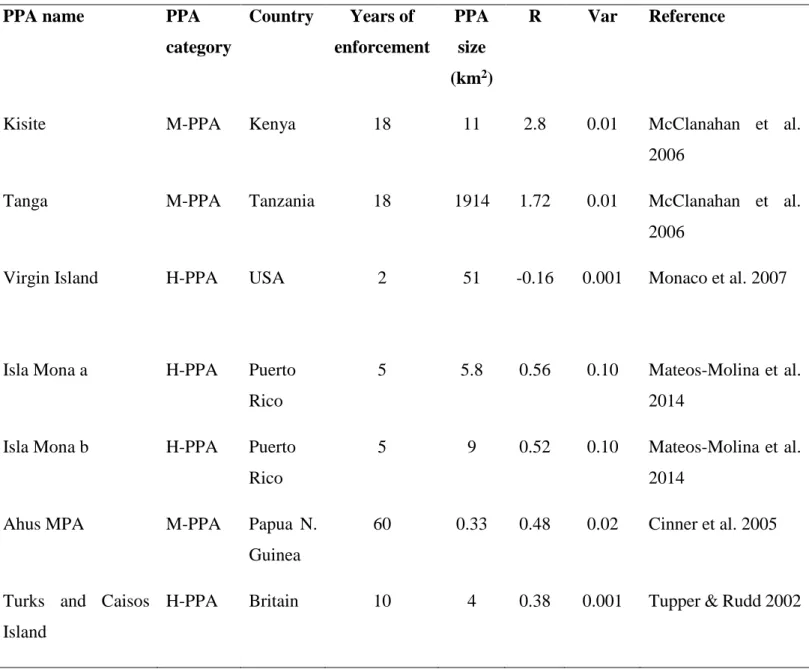
Table S1: The database of the characteristics of each of the partially protected areas included in the weighted-meta analysis investigating the effects of partial protection for biomass and/or density of targeted fish (PPA category: H-PPA = highly regulated extraction zone, M-PPA= moderately regulated extraction zone, W-PPA= weakly regulated extraction zone; Metrics: B=biomass, D=density).
PPA name PPA
category Country Years of enforcement PPA size (km2) FPA size (km2) Metrics Reference
Kisite M-PPA Kenya 18 11 28 B McClanahan et al.
2006
Tanga M-PPA Tanzania 18 1914 28.71 B McClanahan et al.
2006
Virgin Island H-PPA USA 2 51 NA B Monaco et al. 2007
Isla Mona a H-PPA Puerto Rico
5 5.8 NA B, D Mateos-Molina et al. 2014
Isla Mona b H-PPA Puerto Rico
5 9 NA B, D Mateos-Molina et al.
2014 Easter group
Abrolhos
H-PPA Australia 8 22.43 NA D Nardi et al. 2004
Wallabi group Abrolhos
H-PPA Australia 8 27.6 NA D Nardi et al. 2004
Ahus MPA M-PPA Papua N.
Guinea
60 0.33 NA B Cinner et al. 2005
Turks and Caisos Island