Application of neural networks to predict volume in eucalyptus
Leonardo Lopes Bhering1*, Cosme Damião Cruz1, Leonardo de Azevedo Peixoto1, Antônio Marcos Rosado1, Bruno Galveas Laviola2 and Moysés Nascimento1
Received 17 August 2013 Accepted 16 March 2015
Abstract – The aim of this study was to evaluate the methodology of Artificial Neural Networks (ANN) in order to predict wood volume in eucalyptus and its impacts on the selection of superior families, and to compare artificial neural network with regression models. Data used were obtained in a random block design with 140 half-sib families with five replications at three years of age, and four replications at six years of age, both with five plants per plot. The volume was estimated using ANN and regression models. It was used 2000 and 1500 data to train ANN, and 1500 and 1300 to validate ANN for 3 and 6 years of age, respectively. It is concluded that ANN can help improving the accuracy to measure the volume in eucalyptus trees, and to automate the process of forestry inventory and were more accurate in predicting wood volume than almost all regression models.
Keywords: Genetic parameters, gain with selection, plant breeding.
Crop Breeding and Applied Biotechnology 15: 125-131, 2015 Brazilian Society of Plant Breeding. Printed in Brazil
ARTICLE
http://dx.doi.org/10.1590/1984-70332015v15n3a23
1 Universidade Federal de Viçosa, Departamento de Biologia, Campus Universitário, Av. PH Rolphs s/n, 36.570-900, Viçosa, Brazil. *E-mail: leonardo.bhering@ufv.br 2 Embrapa Agroenergia, Parque Estação Biológica, s/n, Asa Norte, 70.770-901, Brasília, Brazil
INTRODUCTION
The large forestry cover in Brazil, combined with excel -lent soils and climate conditions, points to great advantages of investments in the forestry sector in Brazil (Juvenal and Mattos 2002). Approximately 3 million of hectares of for-ests planted for commercial purposes in Brazil are planted with Eucalyptus genus. Investments provided by business which need raw material for energy power and for paper and cellulose, combined with efforts of government and universities’ research institutes, have made Brazil one of the leading producers of eucalyptus in the world.
Clone plantations of eucalyptus hybrids can produce up to 50m3 ha-1year-1. In Chile, the United States, Canada
and Finland the production is 20, 10, 7 and 4 m3 ha-1year-1,
respectively. The total area planted with eucalyptus in Brazil is 3,549,147 hectares. Of this total, the largest producers are Minas Gerais, São Paulo, Bahia and Espírito Santo, contributing with 31%, 23%, 15% and 6%, respectively, and the other states contribute with 25% of the Brazilian production. According to the Sociedade Brasileira de Silvi -cultura, this species generates 16 billion dollars in exports and domestic products, in addition to 2 million of direct and indirect jobs.
Volumetric equations are used to calculate the amount of wood produced, which quantifies the productive potential of the cultivation area, and the farmer and or industry’s income. Several trees are cut down so that diameter and height are measured.
Forestry measurements are an important element in forestry management, since it provides precise information on the Forest, allowing proper decision making for its ac-complishment, in addition to providing the best design for its activities. The two most used variables in the achieve -ment of forestry measure-ments are height and diameter at breast height (DBH), which are used for calculation of the basal area and wood volume existing in a Forest (Freitas and Wichert 1998). For reliability of a forestry inventory, it is necessary to know its sources of error in order to eliminate or to minimize their effect on the precision of the measurements.
calculation of the volume; on the other hand, an error of 1m made when measuring the height corresponds to only 14% of the volume (Couto et al. 1989).
Due to the large number of trees from which DBH and height data are collected, many errors may be made at field level, harming forestry measurement, and consequently the selection of superior genotypes useful for plant breeding program. An alternative is using methodologies of volume prediction based only on the DBH, reducing the labor of field measurements, and resulting in more precise measurements. Artificial neural network is a mathematical or computer model based on biological neural networks (Braga et al. 2007). The Artificial neural network model is a learning method supervised by training data in order to produce models, which generate predictions for response variables (Mugnai et al. 2008).
Agronomic uses for artificial neural networks (ANN) models are found in production predictions in rice (Kaul et al. 2005, Ji et al. 2007), in genetic diversity analysis (Bar-bosa et al. 2011) prediction of diseases using classification of satellites pictures (França et al. 2010), in breeding value prediction in animal (Ventura et al. 2012), in the selection in Alfafa (Nascimento et al. 2013) and sugarcane (Brasileiro et al. 2015).
Neural networks have been used in forestry modeling to estimate several parameters, such as diameter, height and volume of trees, among others, but in eucalyptus breeding, this methodology has not been used yet. Several authors have predicted height based on DBH, age and other statisti -cal information using artificial neural networks (Castaño-Santamaría et al. 2013, Özçelik et al. 2013). Castro et al. (2013) used ANN for models of growth in Eucalyptus. Özçelik et al. (2010) estimated tree bole volumes of 89 Scots pine (Pinus sylvestris L.), 96 Brutian pine (Pinus brutia Ten.), 107 Cilicica fir (Abies cilicica Carr.) and 67 Cedar of Lebanon (Cedrus libani A. Rich.) trees using Artificial Neural Network (ANN). The results reported by the authors suggested that the selected cascade correlation artificial neural network (CCANN) models are reliable for estimating the tree bole volume since they gave unbiased results and were superior to almost all methods in terms of error (%) expressed as the mean of the percentage er-rors. Huang et al. (2009) used neural networks to find the frequency of distribution of classes of diameter and trunk, based on the relative diameter, mean diameter and coef -ficient of diameter variation.
Artificial neural networks have presented higher perfor-mance than regression models due to many factors, such as:
having massive and parallely distributed structure (layers); being able to learn and generalize, which makes them able to solve complex problems; being tolerant to failures and noises; being able to model several variables and their non-linear relationships; being possible to model with categorical variables (qualitative), as well as to numerical variables (quantitative) (Haykin 2001).
Therefore, the objective of this work was to evaluate the methodology of neural networks for predictions of wood volume in breeding programs of eucalyptus and its impacts on selection of superior genetic material, and to compare artificial neural network with regression models.
MATERIAL AND METHODS
Plant material and experimental design
One hundred and forty half-sib families of eucalyptus were evaluated. The experiments were carried out in a random block design with five replications at three years of age, and four replications at six years of age, both with five plants per plot, and with a spacing of 3 x 3 m.
The original individual volume in cm3 was estimated
based on the expression:
, (I) where: π is 3.14159; DBH is the diameter at breast height (cm); height is expressed in cm; and 0.43 is de form factor usually used in Brazilian plant breeding.
The assessed traits were statistically analyzed by using the software Genes (Cruz 2013). The statistical model adopted in this study was a random block with information within the plot, and a varying number of plants among plots, by using the following model:
(II)
Where: Yijk is the observation of the kth individual
assessed in the ith family in the jth block; µ is the overall
mean of the trial; gi is the random effect of the ith genotype
(half-sib family) [i=1,2,....g]; bj is the random effect of the
jth block [j=1,2,...,b]; and ε
ij is the environmental random
effect among plots.
After calculating mean square, it was possible to calcu-lated variance components as follows:
Genetic variance (σ 2
g)
(III)
Among plot variance (σ 2
a)
(IV)
Within plot variance (σ 2
w)
(V)
A number of plants equivalent to the harmonic mean in the mean square expected values was used for estimation, since this number ranged between the different plots. Ac -cording to Ramalho et al. (2000), the use of this procedure is satisfactory when the number of failures is not very large. The mean number of individuals within each plot was achieved by the following expression:
(VI)
The expressions described by Vencovsky and Barriga (1992) were used to determine coefficient of heritability and variation. Heritability associated to selection of means of the half-sib families is given by:
(VII)
Once the genetic parameters are known, it was possible to predict gains with selection by using the expression:
(VIII)
Where: SG is the gains with selection; h2 is the heritabil
-ity; and SD is the selection differential. Selection differential
Selection differential was achieved by the difference between the original mean of the population and the mean of the selected half-sib families, which corresponded to 20% of the half-sib families, that is, the mean of the 14 most productive half-sib families.
Neural network
In this study, it was used multilayer neural networks. The proposed neural network has 1 input layer, 3 intermediate layers and 1 output layer. The input data was the DBH values of the 2100 plants at 3 years of age, and 1400 plants of at 6 years of age for network training. For validating the artificial neural networks, 1400 plants at 3 and 6 years of age were used. The first three blocks were used for training, and the last two blocks were used for validation. Training data was not expanded. In the intermediate layer, the number of neurons per layer varied between 1 to 10 neurons in the first layer, 1 to 20 in the second layer, and 1 to 8 and in the third layer. The output layer consisted of one neuron, and the output was the wood volume based only on the DBH estimated by artificial neural network. This value was known in the
training, but unknown in the validation. The best network architecture was established by the one with higher mean accuracy, considering the 43200 possibilities, calculated by multiplying the number of neurons in each layer, and the possible activation functions (10X20X8X3X3X3).
Activation functions used were:
Linear transfer function (purelin): calculates the neuron’s output by simply returning the value passed to it.
α = purelin(n) (IX)
where: α is the output in each layer, and n is the input in each layer.
Tan-sigmoid transfer function (tansig): Tan-sigmoid out-put neurons are often used for pattern recognition problems, while linear output neurons are used for functions fitting problems. This function is used in multiplayer networks, and is defined by:
α = tansig(n) (X)
log-sigmoid transfer function (Logsig): The function Logsig generates outputs between 0 and 1, as the neuron’s net output goes from negative to positive infinity. This function is defined by:
α = logsig(n) (XI)
The three transfer functions described here are the most commonly used transfer functions for multiplayer networks, but other differentiable transfer function can be created and used if desired.
Bayesian regulation backpropagation (Trainbr) was used to train the neural network, and 1000 epochs (iterations) were used. Trainbr is a network training function, which takes into account the weight and the bias values according to Levemberg-Marquardt optimization. It minimizes a com-bination of squared errors and weights, and then determines the correct combination, in order to produce a network that generalizes well. The process is called Bayesian regulation. The simulation of the analyses was carried out by using software Matlab (MathWorks 2011).
Statistics analysis
It was estimated the spearman correlation and Pearson correlation between half-sib families, and it was calculated the coincidence index between 20% best families selected by the direct and indirect selection method explained below.
hyperbolical 1, hyperbolical 2, logarithmic E, logarithmic 10, reciprocal-log, cubic root, log-log, ln-ln and Exp(X). The coefficient of determination (R2) was used to compare
these models.
RESULTS AND DISCUSSION
When analyses were being carried out, configuration of the network, which adjusted better to the data, so it could be used in the validation, was reached by using different activation functions. For the three years of age data, the best performance was achieved by using four neurons in the first hidden layer, and only three neurons in the second hidden layer. Both layers presented the best performance when tansig activation function was used. A similar explanation was obtained in the analyses of the six years of age, where the first hidden layer presented the best performance when it was made up by four neural, and the second layer made up with two neural. Again, data were better explained by using tansig activation function.
After achieving the best network configuration in the training, the achieved volumes of individuals of families in each replication and plot were estimated to make it possible the comparisons among parameters estimated by original volume and parameters estimated by the volume calculated by neural network.
The use of neural networks to estimate height and volume of trees has been already reported (Silva et al. 2009, Özçelik et al. 2010, Özçelik et al. 2013). The information on height and DBH was used as inputs in the configuration of the adopted network in those studies. The only disadvantage in those studies is that trees with the same DBH and total height, but with different shaft presented the same volume.
Analysis of variance for the two variables (original vol-ume and volvol-ume predicted by the network) for evaluations at three and six years of age for eucalyptus plantation with 140 half-sib families is found in Table 1. It can be concluded that the experiment has genetic variation different from zero, since the F test was significant for the variables evaluated in the evaluation times. Therefore, it is possible to use it for selection of the best families.
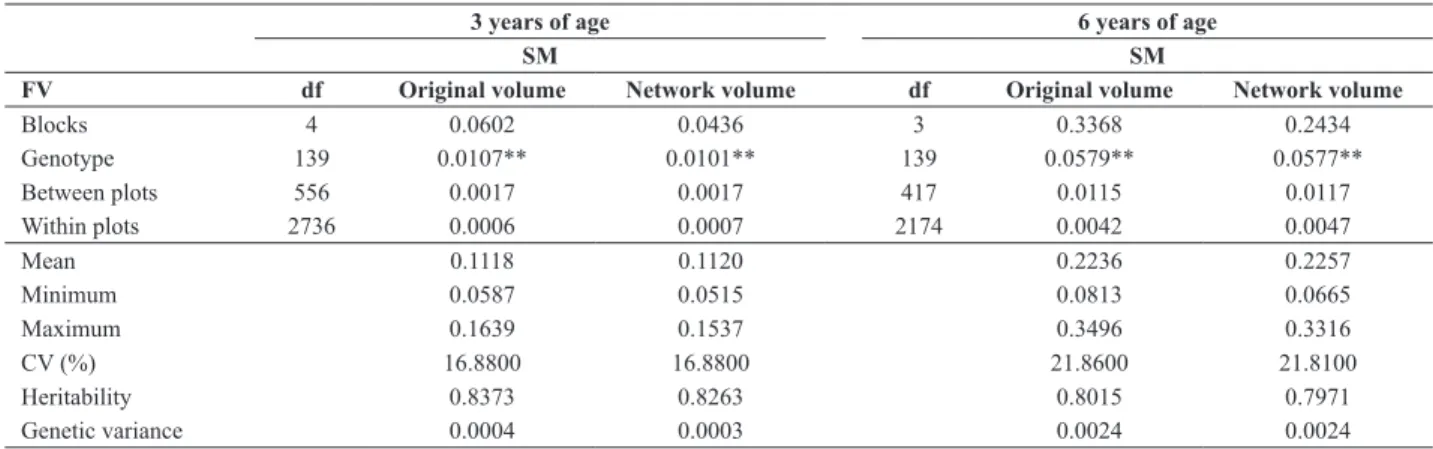
It is also found, in Table 1, that the estimate of mean for both variables was very close in both situations, at three years of age (0.1118 and 0.1120) and at six years of age (0.2236 and 0.2257).
The values obtained with the maximum and minimum for both prediction modes of the volume in the experiment also presented very close values. The coefficient of experi-mental variation (CV), which measures the experiexperi-mental precision, was identical in the evaluation at three years of age (16.88 and 16.88%), and very close in the evaluation at six years of age (21.86 and 21.81%). Therefore, it shows that experimental quality was not affected after volume estimation by the technique of neural networks.
Other important pieces of information to be evaluated in a breeding program are the estimate of genetic variance and heritability, which measure how much of phenotypic variance is explained by genetic causes.
It is found in Table 1 that values of heritability and ge-netic variance, whether in the first evaluation at three years of age (83.73, 82.63% and 0.000367, 0.000341), or in the second evaluation at six years of age (80.15, 79.71% and 0.002414, 0.002394) were very close. Thus, for selection purposes, there would not be gain losses in volume if it was estimated by using Artificial Neural Network. Those facts
Table 1. Mean squares achieved by analysis of variance in random blocks with information between and within plots, mean of the experiment,
mini-mum and maximini-mum values, coefficient of environmental variation (CV), heritability considering unit of mean of half-sib families, and genetic variance between families for experiments measured at three and six years of age, for original volume and volume based on neural networks
3 years of age 6 years of age
SM SM
FV df Original volume Network volume df Original volume Network volume
Blocks 4 0.0602 0.0436 3 0.3368 0.2434
Genotype 139 0.0107** 0.0101** 139 0.0579** 0.0577**
Between plots 556 0.0017 0.0017 417 0.0115 0.0117
Within plots 2736 0.0006 0.0007 2174 0.0042 0.0047
Mean 0.1118 0.1120 0.2236 0.2257
Minimum 0.0587 0.0515 0.0813 0.0665
Maximum 0.1639 0.1537 0.3496 0.3316
CV (%) 16.8800 16.8800 21.8600 21.8100
Heritability 0.8373 0.8263 0.8015 0.7971
Genetic variance 0.0004 0.0003 0.0024 0.0024
show that the network was efficient in estimating individual wood volume and the result of the analyses of variance and descriptive analyses were consistent and very close.
Linear correlation of Pearson among variables revealed a positive value of high and significant magnitude (p<0.01) for both analyses at three years of age and at six years of age (Table 2). Those studies of correlation are very important in the evaluation of magnitude and direction of the relation -ships between both characters and gains to be obtained by indirect selection (Cruz 2006). In this study, correlation above 0.98 shows that the values observed by the network and the original volume are very close.
Moreover, Table 2 shows the values obtained from the correlation of Spearman, which evaluates the changes in the ranks of the variables. In this study, the correlation was significant (p<0.01), and with a value even greater than the one presented by correlation of Pearson, reaching 0.99 at six years of age. Thus, it confirms that the ranking of variables were not changed at a significant amount of data by using any of the variables.
The level of coincidence of material existing in a sample with 20% of the treatments, that is, with 28 superior and 28 inferior half-sib families was calculated. For both ages and for both situations of 28 superior and 28 inferior half-sib families, more than 92% of the half-sib families were the same, that is, of the 28 superior half-sib families, 26 were the same by both methodologies. This was also observed for the 28 lower half-sib families. Models of DBH have recently been used for classification of green tea accessions (Camellia sinenis L.) within different taxonomic groups,
by using measures of leaf morphology as input variables (Pandolfi et al. 2009).
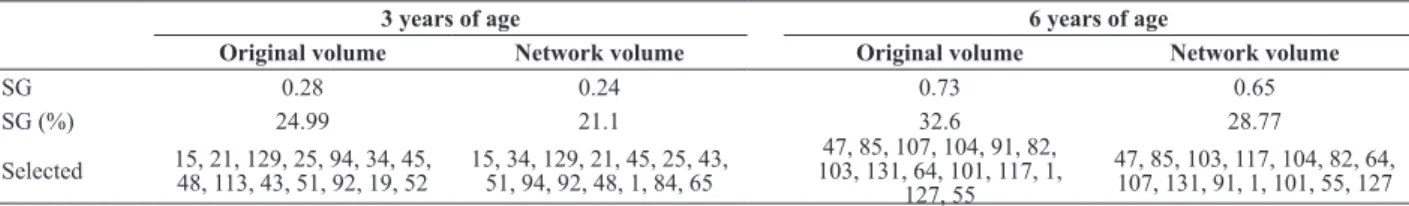
Table 3 shows the predicted gain with selection regarding
direct selection in the original volume and direct selection in the volume achieved with the network. Values of gain with selection were close for both ages. A small percentage value was obtained with gain with selection. The best solution was to obtain the real gain value, which would be the gain obtained after selection and planting of selected individuals.
To complement evaluation of gain with selection, the relationship of half-sib families that would be selected with the selection in each one of the variables is described in Table 3. It can be seen that although gain percentage esti-mate had a small difference between the two variables, the half-sib families selected by the two variables are basically the same for both ages. This confirms that selection based in the phenotype predicted by neural network allows the no occurrence of information loss for breeding purposes, since selection can be carried out, and the genotypes phenotypi -cally superior are the ones which are selected.
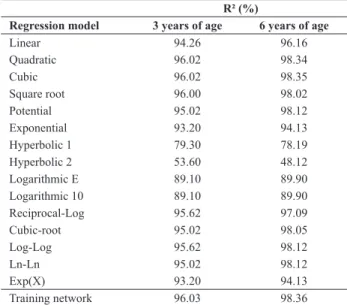
Another alternative for comparing network efficiency is using analyses of regression, which has the objective of estimating the depending variable, based on the independent variable (original volume), that is, the volume estimated without using the height for all individuals. Data used for this analysis were those used for network training. Table 4 shows that only quadratic model and cubic model were equal the value obtained by the artificial neural network (ANN) for the age of three years and six years. Other models had values lower than ANN when these models were compared by the coefficient of determination (R2). This is in
agree-ment with the observation of Haykin (2001), who showed that Neural Network may have a higher prediction than the regression models. Starret et al. (1997) reported that models of ANN had better performance (r2 = 0.984) than the
regression model (r2 = 0.780) for N used in gram. According
to Batchelor et al. (1997), models of ANN achieve better results when compared to traditional statistical methods for prediction of soybean rust.
Thus, the network has become the fastest and the least laborious tool, showing that it is much better to used it rather than performing each of the regression specific software, since regression analyses cannot be carried out simultaneously.
Table 2. Correlation of Spearman and Pearson of original volume and
volume based on artificial neural network of 140 half-sib families of
eucalyptus assessed at three and six years of age
Coefficient of correlation 3 years of age 6 years of age
Spearman 0.9869** 0.9900**
Pearson 0.9837** 0.9857**
**: Significant at 1% of probability by the t test
Table 3. Selection gain (SG) predicted by direct selection for original volume and network estimated volume, with 14 selected individuals (10% of
the population)
3 years of age 6 years of age
Original volume Network volume Original volume Network volume
SG 0.28 0.24 0.73 0.65
SG (%) 24.99 21.1 32.6 28.77
Selected 15, 21, 129, 25, 94, 34, 45, 48, 113, 43, 51, 92, 19, 52 15, 34, 129, 21, 45, 25, 43, 51, 94, 92, 48, 1, 84, 65 103, 131, 64, 101, 117, 1, 47, 85, 107, 104, 91, 82, 127, 55
47, 85, 103, 117, 104, 82, 64,
Therefore, the use of neural networks for prediction of wood volume in eucalyptus breeding program is a useful and feasible methodology, since it is a methodology that does not require the measurement of all height trees. Thus, the errors can be reduced, since measurements can be made with more caution. Artificial neural network is more ef-ficient than other assessed regression models, showing its prediction force.
Many supporting trees are cut down and echeloned for execution of forestry inventory, but if using artificial neural network, only one sample of trees will have its DBH and volume measured. Thus, a much more consistent measurement can be obtained, since the volumes will be better estimated by reducing the error of measurements at field level. This model can be used to help automating the process of forestry inventory, since it significantly reduces cost and time to close inventory. In addition, this approach is less susceptible to human errors during the process of forestry inventory. Another advantage is that once a sample of the trees will be used for the experiment to carry out the network training and subsequent prediction there is no risk of disregarding the differences between species, or the location where the experiment was carried out. The network will be obtained for each experiment and/or location.
It is concluded that Artificial Neural Network can help to improve the accuracy to measure the volume of eucalyptus trees, and to automate the process of forestry inventory. When the Artificial Neural Network was used to predict wood volume, it was possible to select the best genotype, such as variance analysis. Artificial Neural Network was much better than almost all the regression models. ACKNOWLEDGEMENTS
Acknowledgements to Funarbe, Fapemig, Capes and CNPq to financial support.
Table 4. Regression analysis of several models with data used for network
training and efficient comparison based on the coefficient of determina-tion (R2)
R² (%)
Regression model 3 years of age 6 years of age
Linear 94.26 96.16
Quadratic 96.02 98.34
Cubic 96.02 98.35
Square root 96.00 98.02
Potential 95.02 98.12
Exponential 93.20 94.13
Hyperbolic 1 79.30 78.19
Hyperbolic 2 53.60 48.12
Logarithmic E 89.10 89.90
Logarithmic 10 89.10 89.90
Reciprocal-Log 95.62 97.09
Cubic-root 95.02 98.05
Log-Log 95.62 98.12
Ln-Ln 95.02 98.12
Exp(X) 93.20 94.13
Training network 96.03 98.36
Utilização de redes neurais para predição de volume em eucalipto
Resumo – O objetivo deste trabalho foi avaliar a metodologia das redes neurais artificiais (RNA) para predizer o volume de madeira
nos programas de melhoramento de eucalipto e na seleção de famílias comparando as RNA com modelos de regressão. O deline -amento foi em blocos casualizados com 140 famílias de meios-irmãos, 5 e 4 repetições para 3 e 6 anos respectivamente, ambos com 5 plantas por parcela. Para o treinamento da rede, foi utilizado 2000 e 1500 indivíduos, e para validação foram utilizados 1500 e 1300 indivíduos, respectivamente, para 3 e 6 anos. Foi concluído que as RNA pode ajudar a melhorar a acurácia na medição do volume em árvores de eucalipto e automatizar o processo do inventário florestal. As RNA foram mais acuradas na predição do volume de madeira que quase todos os modelos de regressão.
Palavra-chave: Parâmetros genéticos, ganho de seleção, melhoramento de plantas.
REFERENCES
Barbosa CD, Viana AP, Quintal SSR and Pereira MG (2011) Artificial neural network analysis of genetic diversity in Carica papaya L. Crop Breeding and Applied Biotechnology 11: 224-231.
Batchelor WD, Yang XB and Tschanz AT (1997) Development of a neural network for soybean rust development. American Society of Agricultural and Biological Engineers 40: 247-252.
Braga AP, Ferreira ACPL and Ludermir TB (2007) Redes neurais
artificiais: teoria e aplicações. LTC, Rio de Janeiro, 248p.
Brasileiro BP, Marinho CD, Costa PMA, Cruz CD, Peternelli LA and
Barbosa MHP (2015) Selection in sugarcane families with artificial neural networks. Crop Breeding and Applied Biotechnology 15:
72-78.
Castaño-Santamaría J, Crecente-Campo F, Fernández-Martínez JL, Barrio-Anta M and Obeso JR (2013) Tree height prediction approaches for uneven-aged beech forests in northwestern Spain. Forest Ecology and Management 307: 63-73.
Couto HTZ, Batista JLF and Rodrigues A (1989) “Mensuração e gerenciamento de pequenas florestas”. Documentos Florestais 5:
1-37.
Cruz CD (2006) Programa Genes: biometria. UFV, Viçosa, 175p.
Cruz CD (2013) Genes: a software package for analysis in experimental statistics and quantitative genetics. Acta Scientiarum. Agronomy 35: 271-276.
França MM, Fernandes Filho EI and De Lima BT (2010) Análise do uso da terra no município de Viçosa-MG mediado por classificações supervisionadas com redes neurais artificiais e Maxver. Revista
Brasileira de Geografia Física 2: 92-101.
Freitas AG and Wichert MCP (1998) Comparação entre instrumentos tradicionais de medição de diâmetro e altura com o criterion.
IPEF - ESALQ/USP, Piracicaba, 6p.
Haykin S (2001) Redes neurais: princípios e prática. Bookman, Porto
Alegre, 900p.
Huang J, Zhao J, Gao G, Meng X and Guan G (2009) Prediction of stand diameter distribution with artificial neural network.
In 5th International conference on natural computation. Natural Computation, Tianjin, p.79-82.
Ji B, Sun Y, Yang S and Wan J (2007) Artificial neural networks for rice
yield prediction in mountainous regions. Journal Agriculture science 145: 249-261.
Juvenal TL and Mattos RLG (2002) O setor florestal no Brasil e a importância do reflorestamento. BNDES Setorial, Rio de Janeiro,
30p.
Kaul M, Hill RL and Walthall C (2005) Artificial neural networks for
corn and soybean yield prediction. Agricultural Systems 85: 1-18.
MathWorks (2011) Matlab 7.12: getting started guide. Natick, Massachusetts, 276p.
Mugnai S, Pandolfi C, Azzarello E, Masi E and Mancuso S (2008) Camellia japonica L. genotypes identified by an artificial neural network based on phyllometric and fractal parameters. Plant systematics and evolution 270: 95-108.
Nascimento M, Peternelli LA, Cruz CD, Nascimento ACC, Ferreira
RP, Bhering LL and Salgado CC (2013) Artificial neural networks
for adaptability and stability evaluation in alfalfa genotypes. Crop Breeding and Applied Biotechnology 13: 152-156.
Özçelik R, Diamantopoulou MJ, Brooks JR and Wiant Jr HV (2010) Estimating tree bole volume using artificial neural network models for four species in Turkey. Journal of Environmental Management 91: 742-753.
Özçelik R, Diamantopoulou MJ, Crecente-Campo F and Eler U (2013) Estimating Crimean juniper tree height using nonlinear regression and artificial neural network models. Forest Ecology and Management 306: 52-60.
Pandolfi C, Mugnai S, Arazello E, Bergamasco S, Masi E and Mancuso S (2009) Artificial neural networks as a tool for plant identifi cation:
a case study on Vietnamese tea accessions. Euphytica 166: 411-421.
Peres RDN (1989) “Errores en al medicion de alturas totales com Clinometro Suunto y un vara de longitude conecida”. Tatascan 6:
25-30.
Ramalho MAP, Ferreira DP and Oliveira AC (2000) Experimentação em genética e melhoramento de plantas. UFLA, Lavras, 303p.
Silva MLM, Binoti DHB, Gleriani JM and Leite HC (2009) Ajuste do modelo de Schumacher e Hall e aplicação de redes neurais artificiais
para estimar volume de árvores de eucaplito. Revista Árvore 33:
1133-1139.
Starrett SK, Starrett SK and Adams GL (1997) Using artificial neural networks and regression to predict percentage of applied nitrogen
leached under turfgrass. Commun. Soil Science and Plant Analysis 28: 497-507.
Vencovsky R and Barriga P (1992) Genética biométrica no
fitomelhoramento. Revista Brasileira de Genética, Ribeirão Preto,
496p.
Ventura R, Silva M, Medeiros T, Dionello N, Madalena F, Fridrich A,
Valente B, Santos G, Freitas L and Wenceslau R (2012) Use of artificial neural networks in breeding values prediction for weight at 205 days