Contents lists available atScienceDirect
Industrial Crops and Products
j o u r n a l h o m e p a g e :w w w . e l s e v i e r . c o m / l o c a t e / i n d c r o p
Flexible polyurethane foams based on 100% renewably sourced
polyols
L. Ugarte
a, A. Saralegi
b, R. Fernández
a, L. Martín
a, M.A. Corcuera
a, A. Eceiza
a,∗ a“Materials + Technologies” Group, Department of Chemical and Environmental Engineering, Polytechnic School, University of the Basque Country (UPV/EHU), Pza Europa 1, 20018 Donostia-San Sebastian, SpainbLaboratory of Separation and Reaction Engineering (LSRE), Associate Laboratory LSRE/LCM, Polytechnic Institute of Braganc¸a, Campus Santa Apolónia Ap. 1134, 5301-857 Braganc¸a, Portugal
a r t i c l e
i n f o
Article history: Received 11 June 2014
Received in revised form 1 September 2014 Accepted 15 September 2014
Available online 5 October 2014
Keywords:
Microphase separation AFM
Peak force quantitative nanomechanics Vegetable oil based polyols
Flexible polyurethane foam
a b s t r a c t
Since polyol is one of the major components in polyurethane foam synthesis, introducing renewably sourced polyols in the foam formulation leads to materials with high renewable carbon content. A series of flexible polyurethane foams with variations in polyol composition were synthesized with castor oil based Lupranol Balance®50 polyether polyol and corn based polytrimethylene ether glycol mixtures. Water was
used as the unique and eco-friendly blowing agent. The effect of the relative amount of each polyol on the structure and properties was analyzed by optical microscopy, Fourier transform infrared spectroscopy, thermogravimetric analysis, tensile and compressive tests, dynamic mechanical analysis and atomic force microscopy. The average molecular weight and hydroxyl number of the polyol components showed to influence the foaming reaction and hence the structure and properties of the polyurethane foam. The newly developed peak force quantitative nano-mechanics technique was used to map the elastic modulus values of foam cell struts and it seemed to be adequate to assess the purity of the different phases.
© 2014 Elsevier B.V. All rights reserved.
1. Introduction
Flexible polyurethane foams have been widely used in many applications such as mattresses, seating and car industry and they are gaining great interest in areas such as biomedicine, intelligent materials and nanocomposites (Hodlur and Rabinal, 2014; Kang et al., 2013; Liu et al., 2013; Singhal et al., 2014). Nowadays, there is a growing concern about environmental issues in material syn-thesis. This reason together with crude price fluctuations have encouraged scientific community to develop materials, including polyurethanes, based on renewable resources which do not depend on petroleum based raw materials (Rashmi et al., 2013). Regarding renewable-based resources, vegetable oils have received special attention as raw materials for polyol synthesis (Ionescu et al., 2012; Narine et al., 2007; Palanisamy et al., 2011; Sharma et al., 2014).
Helling and Rusell (2009)carried out a life cycle assessment analysis for vegetable oil based polyols and demonstrated that a reduction of 33–64% on fossil resources consumption as well as a lowering on greenhouse gas emissions could be achievable by using soy or castor oil.
∗Corresponding author. Tel.: +34 943017185.
E-mail address:[email protected](A. Eceiza).
Foam synthesis involves two main reactions: blowing and gelling. Blowing reaction arises from the reaction of an isocyanate group with water and yields urea and carbon dioxide, which expands the air bubbles entrapped inside the reactive mixture. Gelling reaction implies an isocyanate group and a hydroxyl group to form a urethane linkage. The microstructure is accepted to be composed by both physical and chemical crosslinks. Physical crosslinks arise when urea groups of sufficient size and concen-tration establish hydrogen bonding interactions with other urea groups and phase separate from soft segments into hard domains (Dounis and Wilkes, 1997). Chemical crosslinks are the result of the urethane reaction, whereby a covalent network is formed between polyurea oligomers and polyol soft segments through urethane bonds. The microstructure and morphology depend on several fac-tors such as the competition between the two main reactions, mobility of urea groups, the level of crosslinks arised from the reaction between the diisocyanate and polyol and the specific inter-actions between polyol and polyurea segments (Heintz et al., 2005; Li et al., 2002).
Determining the mechanical properties on the micro-and nanoscale is a matter of interest in materials property analy-sis. Nanoindentation techniques are widely used to assess local mechanical properties. However, this method is time consuming and presents various uncertainties when determining the local
elastic modulus (Miller et al., 2008; Varam et al., 2014). When working with soft materials such as polymers, the high deforma-tions produced in the material and the importance of adhesive forces are important challenges when using nanoindentation anal-ysis (Gupta et al., 2007; Kohn and Ebenstein, 2013; VanLandingham et al., 2011). Peak force quantitative nano-mechanics is a new technique that allows the mapping of mechanical properties by using a scanning probe microscope at a similar scanning speed to tapping mode. With difference to tapping mode atomic force microscopy, the controlled variable is the maximum force (peak force) applied to the surface and it is maintained constant during the scan. Force vs separation curves are obtained and information about adhesion force, elastic modulus, deformation and dissipation can be extracted (Adamcik et al., 2011). The reduced elastic mod-ulus can be determined by using the Derjaguin–Muller–Toporov (DMT) model shown in Eq.(1)(Derjaguin et al., 1975).
Finteraction=
4 3E
∗
R(d−d0)3 (1)
whereFinteractionis the tip-sample force,E* is the reduced elastic
modulus,Ris the tip radius andd−d0is sample deformation.
The reduced modulus is related to the sample modulus by Eq.
(2).
E∗=
1−2sEs +
1−
2tip
Etip
−1(2)
whereE* is the reduced elastic modulus,
sandtipare thePois-son’s ratios of sample and tip respectively andEsandEtipare the
elastic modulus of sample and tip respectively. Considering that
Etipis much higher, sample Young’s modulus (Es) can be calculated
if
sis known (Pittenger et al., 2012).The aim of this work was to synthesize flexible polyurethane foams using bio-derived polyols and to analyze the effect of variations in polyol composition over foam morphology and prop-erties. Synthesis was carried out in a single step process and foams were cured in an open mold. Characterization was realized by optical microscopy, Fourier transform infrared spectroscopy (FTIR), thermogravimetric analysis (TGA), thermal conductivity measurements, tapping mode atomic force microscopy (TM-AFM), peak force quantitative nanomechanics atomic force microscopy (PFQNM-AFM), mechanical testing and dynamic mechanical anal-ysis (DMA).
2. Experimental
2.1. Raw materials and synthesis
A series of flexible polyurethane foams with variations in polyol mixture composition were synthesized with castor oil based Lupra-nol Balance® 50 polyether polyol, kindly supplied by BASF, and
polytrimethylene ether glycol (PO3G) obtained from corn sucrose (Ugarte et al., 2014). Amine catalyst Tegoamin®B75 and tin
cata-lyst Kosmos® 29, together with surfactant Tegostab® B-4900 (all
three from Evonik) and distilled water as blowing agent, were used in the B-side of the formulation. Toluene diisocyanate (TDI), gen-erously supplied by Bayer, was used as diisocyanate in the A-side of the formulation. Hydroxyl number of Lupranol Balance®50 and
PO3G were determined by titration according to ASTM D 4274-05. All reactants were used as received. Polyols main properties are summarized inTable 1.
Foams were synthesized at room temperature by reacting A-side with B-side in a two-step reaction. Polyol or polyols mixture, cata-lysts, water and surfactant were mixed at 2000 rpm for 2 min. Then, the fixed amount of TDI was incorporated and mixing continued for 10 s at the same speed. The mixture was then quickly poured into an
Table 1
Main properties of the polyols.
Property Lupranol Balance®50 PO3G
OH number (mg KOH g−1)
49.7 79.4
Functionality 2.7 2
Number average molecular weight (g mol−1)
3048 1413
open mold to left the foam rise freely. Foams were cured at room temperature for at least 24 h before characterization. Isocyanate index was maintained constant (I.I. = 120) in all foams. Maximum PO3G substitution was 20%. With higher substitution values, foam-ing and gellfoam-ing reactions were not well balanced with the fixed catalysts quantities and the obtained foams were not acceptable.
Foam designation and formulations are indicated inTable 2.
2.2. Characterization techniques
2.2.1. Cell size and density
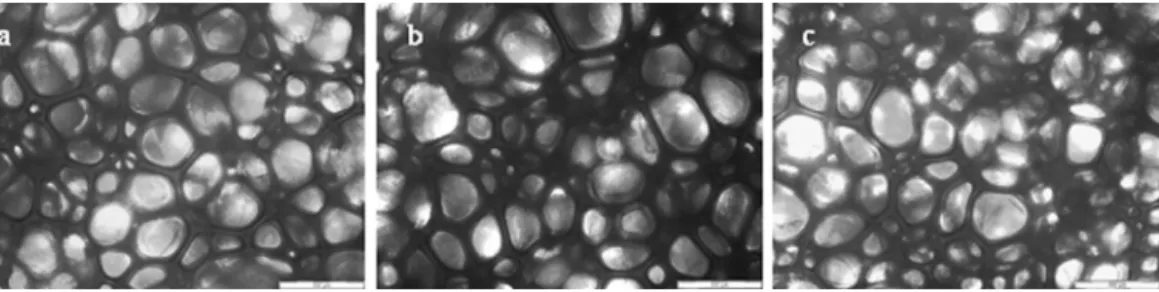
Core density of samples was determined according to ASTM D-3574-11, test A. Four measurements were made for each sample. Cell size of foams was analyzed by a Nikon Eclipse E 600 optical microscope. Twenty-five measurements of cell average diameter were made on each sample, using a 50×magnification lens.
2.2.2. Fourier transform infrared spectroscopy
Attenuated total reflectance Fourier transform infrared spec-troscopy (ATR-FTIR) was used to characterize the functional groups of the synthesized polyurethane foams. Measurements were per-formed with a Nicolet Nexus FTIR spectrometer equipped with a MKII Golden Gate accessory, Specac, with diamond crystal as ATR element at a nominal incidence angle of 45◦with a ZnSe lens.
Single-beam spectra of the samples were obtained after averaging 64 scans in the range from 4000 to 800 cm−1with a resolution of 4 cm−1. All
spectra were obtained in the transmittance mode.
2.2.3. Thermogravimetric analysis
Analysis was performed on a TGA/SDTA 851 Metler Toledo equipment to evaluate thermal stability of polyurethane foams. Samples were heated from room temperature to 650◦C at a heating
rate of 10◦C min−1under a nitrogen atmosphere. For comparison
purposes, a foam with the same formulation to PF-100 but based on a petrochemical polyether polyol supplied by Repsol and named PF-PC, was also analyzed. It had an equivalent molecular weight of 1167 g eq−1and a hydroxyl number of 48 mg KOH g−1. The
formu-lation of PF-PC was adjusted in order to have similar cell size and density characteristics to PF-100 foam.
2.2.4. Thermal conductivity
Thermal conductivity measurements were carried out in a PVT 100 Haake equipment with a 556-1082 sensor model at 35◦C.
Cylindrical-shaped foam samples with a diameter of 9 mm were
Table 2
Designation and formulation of synthesized polyurethane foams (PF). All formula-tions are based on 100 parts by weight of polyol (php).
Component PF100 PF95 PF90 PF85 PF80
Lupranol Balance®50 100 95 90 85 80
PO3G – 5 10 15 20
Water 3.5 3.5 3.5 3.5 3.5
prepared and sensor voltage was set at 2.5 V. As data deviation was very low, two measurements were made for each sample.
2.2.5. Atomic force microscopy
Microstructure of cell struts was analyzed by TM-AFM. For spec-imen preparation, small pieces of foam were put in silicone rubber molds and they were filled with a low-viscosity epoxy mixture. The air entrapped inside foams was removed by applying low vac-uum before curing the epoxy at 60◦C for 24 h. Specimens were
cut with a Leica EM FC6 cryo-ultramicrotome equipped with a diamond knife and operated at−120◦C. Images were obtained in
tapping mode at room temperature with a Nanoscope IIIa scan-ning probe microscope (MultimodeTMDigital Instruments), using
an integrated force generated by cantilever/silicon probes, applying a resonance frequency of ca 180 kHz. The cantilevers were 125 Nm long, with a tip radius of 5–10 nm. Morphological and quantitative nanomechanical properties of foam cell struts were also analyzed by PFQNM-AFM using the epoxy embed foam samples. Since peak force tapping mode controls accurately the force applied, the defor-mation of the sample is small and located at the nano-scale. Thus, the possible reinforcement effect caused by the epoxy over the cell walls could be neglected. Measurements were carried out using a Bruker Dimension Icon AFM operated under peak force mode. High resolution mapping of elastic modulus was performed under room conditions with an integrated TAP 150A tip having a resonance frequency of 142–162 kHz, spring constant of ca. 3.6 Nm−1and
esti-mated tip radius of 40 nm. For comparison purposes, a foam based on PF100 formulation but with 6.5 php of water (designated as PF100H) was synthesized and epoxy embed, to observe differences in microstructure and nanomechanical properties when increasing urea percentage in the foam.
2.2.6. Mechanical properties
Tensile properties of polyurethane foams were analyzed accord-ing to ASTM D-3574-11, test E. A MTS equipment with a load cell of 250 N and pneumatic grips was used to measure the modulus of elasticity, ultimate tensile strength and percentage elongation at break. Tests were performed at a crosshead rate of 500 mm min−1.
Tensile properties were averaged for at least three specimens. Measurements of compression properties were carried out according to ASTM D-3574-11, test C in a MTS equipment with a load cell of 10 kN and compression plates. Tests were performed at a crosshead rate of 50 mm min−1and final force was determined
after 60 s. Three specimens per sample were at least analyzed. All tensile and compressive properties were measured in the foam rise direction.
2.2.7. Dynamic mechanical analysis
DMA was performed in tensile mode with an Eplexor 100 N analyzer, Gabo equipment. Measurements were carried out at a scanning rate of 2◦C min−1 from −100 to 200◦C, using
an initial strain of 2%. The operating frequency was 1 Hz. Approximate dimensions of foams were 20 mm×5.5 mm×3.5 mm
Table 3
Density and cell size of synthesized foams.
Sample Density (kg m−3) Cell size (m)
PF100 42.00±0.97 263.29±74.21 PF95 40.65±0.97 252.77±114.32 PF90 38.55±0.54 287.54±150.24 PF85 39.20±0.65 322.89±143.28 PF80 42.35±0.94 275.39±103.47
(length×width×thickness). DMA measurements were also per-formed in the foam rise direction.
3. Results and discussion
3.1. Density and cell size
Density measurement results are shown in Table 3. Cellular structure and cell size of the foams were observed by optical microscopy (Fig. 1) and cell size values are also resumed inTable 3. It was observed that density decreased when increasing PO3G content until a 10% substitution, and then increased. The same tendency was observed byTu et al. (2008) when substituting a petrochemical polyol with epoxidized soybean oil with higher hydroxyl number.Lim et al. (2008)analyzed the effect of polyol hydroxyl number in polyurethane foam formulations. They also observed that when increasing hydroxyl number while maintain-ing isocyanate index constant, the density reached a minimum and then increased. It was concluded that the decrease of the molecular weight when increasing hydroxyl number caused a better mobility of the mixture and the blowing efficiency increased. Upon the mini-mum value, the increase of viscosity due to the intensive formation of allophanate and biuret crosslinks is believed to hinder foaming reactions. Moreover, the increased reactivity of highest PO3G sub-stitution polyol mixtures may have fastened the gelling reaction and the cell structure became strong enough before it was blown (Kang et al., 2012) keeping the cell size small.
PF90 had the lowest density and the highest cell anisotropy as well as one of the highest cell sizes. Cell size results showed a direct relationship with foam density. Foams with the highest density had the smallest cell sizes and lowest cell anisotropy. PF100 and PF80 showed very similar structures.
3.2. FTIR
ATR-FTIR results of polyurethane foams ranging from 100% to 80% Lupranol Balance®50 polyol showed transmittance bands
cor-responding to both main reactions taking place in polyurethane foam chemistry: urethane and urea bonds. As shown inFig. 2, all spectra were quite similar but slight differences due to polyol com-position were observed.
Transmittances at wavenumbers 1223 cm−1 and 1730 cm−1
were assigned to the ester asymmetric absorbance and the ester carbonyl absorbance (Singhal et al., 2014), respectively. It was
Fig. 2.FTIR spectra of the synthesized foams on the range from 1800 cm−1 to 1100 cm−1. (For interpretation of reference to color in this figure legend, the reader is referred to the web version of this article.)
Fig. 3.Peak deconvolution for PF80 sample. (For interpretation of reference to color in this figure legend, the reader is referred to the web version of this article.)
observed that as the Lupranol Balance® 50 content in the foam
formulation decreased, ester carbonyl absorbance peak intensity diminished due to the incorporation of ether groups in the formu-lation instead of ester groups.
In the amide I region, the bands corresponding to free C O stretching of urea (around 1715 cm−1) and urethane (around
1730 cm−1) were observed (Elwell et al., 1996). The
deconvo-lution of the observed peak allowed calculating the relative areas corresponding to each type of stretching. An example of the decon-volution is shown inFig. 3.
The area and the wavenumber (WN) corresponding to each peak are summarized inTable 4.
As PO3G content increased, shifts to lower wavenumbers were observed for both free urea and free urethane stretching vibra-tion and the total area also diminished. On the same fashion,
Table 4
Analysis of free urethane and free urea areas for PF100, PF90 and PF80 samples.
Sample Free urethane Free urea Rurea/urethane
Area WN Area WN
PF100 77.2 1734 267.8 1716 3.5 PF90 89.8 1733 145.0 1715 1.6 PF80 108.1 1731 101.9 1712 0.9
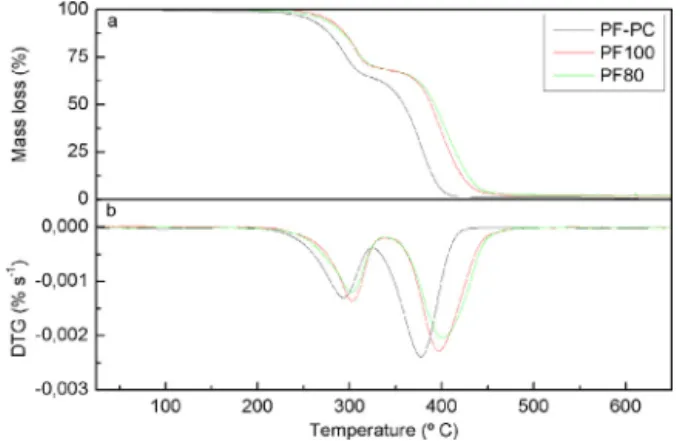
Fig. 4.(a) TGA thermograms of PF-PC, PF100 and PF80 foams and (b) DTG curves of PF-PC, PF100 and PF80 foams. (For interpretation of reference to color in this figure legend, the reader is referred to the web version of this article.)
urea/urethane ratio value diminished as PO3G content increased. Results suggest that as PO3G is incorporated in the formulation, ureas may be able to form ordered domains as less free urea groups were observed by ATR-FTIR analysis.
The transmittance band at 1640 cm−1corresponds to bidentate
(hydrogen bonded) urea and could be used as an identification of ordered hard domains (Heintz et al., 2005). As a general tendency, it was observed that foams with the highest quantity of PO3G in the formulation showed the most intense peaks. The results agree with the deconvolution analysis, indicating the formation of more ordered urea domains as the short glycol is incorporated in the formulation.
3.3. Thermal properties
Thermal degradation properties of polyurethane foams are essential regarding a safe use. In this way, the thermal degradation behavior of bio-based polyurethane foams was compared with a petrochemical polyol based foam. Thermograms of polyurethane foams under nitrogen atmosphere are shown in Fig. 4. Petro-chemical polyol based foam maintained stable until 200◦C, while
bio-based polyurethane foams started degradation around 220◦C.
Results showed that degradation occurred in two steps. The first step was assigned to degradation of urea and urethane linkages (Ravey and Pearce, 1997). According to first derivative ther-mogravimetric (DTG) curve, the maximum urea and urethane degradation rate for the petrochemical polyol based foam and bio-based foams were detected at 290◦C and 300◦C respectively. The
second step corresponds to polyol degradation (Allan et al., 2013). Analyzing the maximum degradation rate temperature, bio-based polyols conferred enhanced thermal stability (400◦C) comparing
with petrochemical polyether polyol (377◦C). Char formation was
negligible in all cases, with a maximum of 2.3% for PF100 foam. Thermal conductivity values of foams were very similar with an average of 0.069 W m−1K−1, indicating that they all have
simi-lar open-closed cell proportions. Values were quite high comparing with other data reported in literature for foams obtained from both vegetable oil based polyols and petrochemical polyols (Badri, 2012; Jeong et al., 2009). This could be due to the foam disposition during the analysis, which could be slightly compressed by the tempera-ture probe.
3.4. Foam strut morphology and elastic modulus
Fig. 5.AFM 5m×5m tapping mode phase images of (a) PF100, (b) PF80, and (c) PF100H and (d) positioning of AFM tip on cell strut.
(Yilgor and Yilgor, 2007), urea rich regions may appear brighter than polyol soft regions (Aneja and Wilkes, 2002). On the analyzed figures, microphase segregation of different phases was observed (Lan and Haugstad, 2011) with bright regions dispersed in a dark continuous phase. According to relative dissipation energies, it was concluded that bright regions correspond to urea rich domains dis-persed in polyol rich domains. In PF80 sample, soft polyol domains seemed to be purer since in PF100 sample more small bright
crystals were observed dispersed in soft domains. Comparing PF100 and PF100H samples, it could be said that in PF100H, the urea hard domains create a more interconnected network across the contin-uous soft domain.
Topographic and elastic modulus mapping images obtained with PFQNM-AFM are shown inFig. 6. Represented elastic modu-lus profiles were randomly selected from dark, low modumodu-lus areas. To obtain an average modulus value of such regions, six profiles
Fig. 6.AFM topographic 3D 3m×3m images (left), elastic modulus 3m×3m images (center) and cross-sectional elastic modulus profiles (right) of (a) PF100, (b)
Table 5
Roughness and elastic modulus data of PF100, PF80 and PF100H samples.
Sample Roughness (nm) Elastic modulus (MPa)
Raa Rqb
PF100 4.25 5.92 191±44
PF80 3.18 4.07 159±10
PF100H 7.58 9.54 106±12
aArithmetic average roughness. b Root mean square roughness.
were extracted and the average value was calculated on each sam-ple. Results together with sample roughness are summarized in
Table 5.
On elastic modulus mapping images, bright areas with high modulus were clearly distinguished from low modulus dark regions. Given that polyureas are more rigid that polyurethanes (Yilgor and Yilgor, 2007), it might be determined that bright areas correspond to urea rich domains. Taking this into account, the images are in accordance with TM-AFM phase images, where urea rich domains appear dispersed in a soft segment rich matrix. Modulus values were quite in accordance with previous works. For instance, Schön et al. (2011) used peak force quantitative nano-mechanics equipment to characterize the elastic modulus of segmented thermoplastic polyurethanes. Obtained modulus values were of the same order of magnitude although those of foams were higher. The increase of modulus on foams was attributed to the urea domains dispersed in the soft domains. The decrease in mod-ulus from PF100 to PF80 could indicate a better phase separation as PO3G is introduced in the formulation. A purer soft phase involved a lower number of urea domains dispersed in the polyol rich phase and this may have lowered the average modulus of the soft phase in PF80 sample. This result was in accordance with FTIR analy-sis. PF100H sample showed the lowest modulus in dark phases, suggesting that the increased urea quantity on this foam favored their association and thus phase separation was enhanced. Rough-ness values increased both as PO3G was eliminated from polyol composition and more water was incorporated in the formulation.
3.5. Mechanical properties
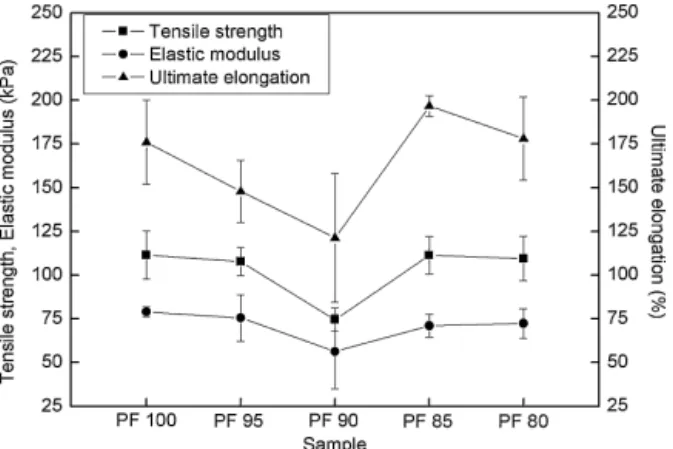
Results concerning tensile strength, elastic modulus and ulti-mate elongation are shown inFig. 7.
Tensile properties showed a very similar behavior to density and cell size. As a general tendency, it was observed that as foam den-sity increased and cell size decreased, tensile behavior enhanced. PF90 showed the poorest tensile properties, the foam with highest cell size and one of the highest cell anisotropy. Compression force
Fig. 7.Tensile strength (), elastic modulus (䊉) and ultimate elongation () of synthesized samples.
Fig. 8.CFD values of synthesized foams.
deflection (CFD) value results are shown inFig. 8. According toTu et al. (2008), compressive properties of foams seem to be influ-enced by both density and crosslinking density. On synthesized series, as PO3G has higher hydroxyl value than Lupranol Balance®
50, the number of equivalent OH groups increased with the incor-poration of PO3G to the formulation. Since isocyanate index was maintained constant in all samples, the quantity of NCO groups in the foam increased with the addition of PO3G. It seemed that until 10% of PO3G substitution, the effect of density decrease overlapped crosslinking effect and CFD values were not enhanced. However, in foams with high PO3G substitution, both density and crosslinking density increased and compressive properties increased, especially in PF80 sample.
3.6. Dynamic mechanical properties
The evolution of storage modulus and tanıvalues with tem-perature was analyzed by DMA (Fig. 9). Storage modulus showed two plateau regions, the one at low temperatures corresponding to glassy state and the one at high temperatures corresponding to rubbery state of the foam. Obtained values were quite similar, how-ever, the porous nature of the foams made very difficult to measure the real area and hence to obtain reliable modulus values (Das et al., 2009). This drawback is avoided in tanıanalysis since values are not influenced by the sample area. According to storage modulus evolution, samples showed a single tanıpeak at around−40◦C,
corresponding to the beginning of molecular motions in the polyol
chains. Results were similar to other works with bio-based polyols (Das et al., 2009; Sonnenschein and Wendt, 2013; Tu et al., 2009). As a general tendency, glass transition temperature values slightly shifted to lower temperatures as PO3G was incorporated to the polyol mixture.
4. Conclusions
Bio-based polyols showed to be good candidates for being used in flexible polyurethane foam synthesis. Foams with polyol mix-tures ranging from 100% castor oil based Lupranol Balance®to 20%
of PO3G substitution were successfully synthesized by a one shot method in an open mold. Foams with an open celled structure and acceptable densities were obtained. Results indicated that the incorporation of PO3G in the formulation favored hydrogen bond-ing between urea groups, suggestbond-ing that phase separation was enhanced. Bio-based foams showed improved thermal stability, with no significant mass loss until 220◦C. Morphological analysis of
foam struts revealed the existence of a phase separated structure. Nanomechanical properties of different phases were measured by peak force quantitative nanomechanics AFM and results were satis-factorily used to asses phase separation in polyurethane foam strut. Observations suggested that phase separation was enhanced when incorporating PO3G in the polyol formulation. Polyol composition was believed to alter the reactivity and obtained three-dimensional structures, thus affecting mechanical properties of the foams.
Acknowledgements
Authors thank financial support from University of the Basque Country (PIFUPV047/2011), Basque Government (IT776-13 and S-PE13UN091), Spanish Ministry of Economy and Competitiveness (MINECO) (IPT-2012-0728-420000) and European Union (PIRSES-2012-318996). Technical support provided by SGIker (UPV/EHU, MINECO, GV/EJ, ESF) is gratefully acknowledged.
References
Adamcik, J., Berquand, A., Mezzenga, R., 2011. Single-step direct measurement of amyloid fibrils stiffness by peak force quantitative nanomechanical atomic force microscopy. Appl. Phys. Lett. 98,http://dx.doi.org/10.1063/1.3589369, 193701/1-193701/3.
Allan, D., Daly, J., Liggat, J.J., 2013. Thermal volatilization analysis of TDI-based flex-ible polyurethane foam. Polym. Degrad. Stab. 98, 535–541,http://dx.doi.org/ 10.1016/j.polymdegradstab.2012.12.002.
Aneja, A., Wilkes, G.L., 2002. On the issue of urea phase connectivity in formulations based on molded flexible polyurethane foams. J. Appl. Polym. Sci. 85, 2956–2967, http://dx.doi.org/10.1002/app.10863.
Badri, K.H., 2012. Biobased polyurethane from palm kernel oil-based polyol. Polyurethane, 447–470,http://dx.doi.org/10.5772/47966.
Das, S., Dave, M., Wilkes, G.L., 2009. Characterization of flexible polyurethane foams based on soybean-based polyols. J. Appl. Polym. Sci. 112, 299–308, http://dx.doi.org/10.1002/app.29402.
Derjaguin, B.V., Muller, V.M., Toporov, Y.P., 1975. Effect of contact deformations on adhesion of particles. J. Colloid Interface Sci. 53, 314–326,http://dx.doi.org/ 10.1016/0021-9797(75)90018-1.
Dounis, D.V., Wilkes, G.L., 1997. Structure–property relationships of flexible polyurethane foams. Polymer 11, 2819–2828,http://dx.doi.org/10.1016/S0032-3861(97)85620-0.
Elwell, M.J., Ryan, A.J., Grünbauer, H.J.M., Van Lieshout, H.C., 1996. In-situ studies of structure development during the reactive processing of model flexible polyurethane foam systems using FT-IR spectroscopy, syn-chrotron SAXS, and rheology. Macromolecules 29, 2960–2968,http://dx.doi. org/10.1021/MA9511208.
Gupta, S., Carrillo, F., Cheng, L., Pruitt, L., Puttlitz, C., 2007. Adhesive forces significantly affect elastic modulus determination of soft polymeric materials in nanoindentation. Mater. Lett. 61, 448–451, http://dx.doi.org/ 10.1016/j.matlet.2006.04.078.
Heintz, A.M., Duffy, D.J., Nelson, C.M., Hua, Y., Hsu, S.L., 2005. A spectroscopic analysis of the phase evolution in polyurethane foams. Macromolecules 38, 9192–9199, http://dx.doi.org/10.1021/ma051599w.
Helling, R.K., Rusell, D.A., 2009. Use of life cycle assessment to characterize the environmental impacts of polyol products options. Green Chem. 11, 380–389, http://dx.doi.org/10.1039/b815833a.
Hodlur, R.M., Rabinal, M.K., 2014. Self assembled graphene layers on polyurethane foams as highly pressure sensitive conducting composite. Compos. Sci. Technol. 90, 160–165,http://dx.doi.org/10.1016/j.compscitech.2013.11.005.
Ionescu, M., Wan, X., Bili ´c, N., Petrovi ´c, Z.S., 2012. Polyols and rigid polyurethane foams from cashew nut shell liquid. J. Polym. Environ. 20, 647–658, http://dx.doi.org/10.1007/s10924-012-0467-9.
Jeong, Y.-S., Choi, H.-J., Kim, K.-W., Choi, G.-S., Kang, J.-S., Yang, K.-S., 2009. A study on the thermal conductivity of resilient materials. Thermochim. Acta 490, 47–50, http://dx.doi.org/10.1016/j.tca.2009.02.015.
Kang, S.M., Lee, S.J., Kim, B.K., 2012. Shape memory polyurethane foams. Express Polym. Lett. 6, 63–69,http://dx.doi.org/10.3144/expresspolymlett.2012.7. Kang, S.M., Kwon, S.H., Park, J.H., Kim, B.K., 2013. Carbon nanotube reinforced
shape memory polyurethane foam. Polym. Bull. 70, 885–893,http://dx.doi.org/ 10.1007/s00289-013-0905-4.
Kohn, J.C., Ebenstein, D.M., 2013. Eliminating adhesion errors in nanoindentation of compliant polymers and hydrogels. J. Mech. Behav. Biomed. 20, 316–326, http://dx.doi.org/10.1016/j.jmbbm.2013.02.002.
Lan, Q., Haugstad, G., 2011. Characterization of polymer morphology in polyurethane foams using atomic force microscopy. J. Appl. Polym. Sci. 121, 2644–2651, http://dx.doi.org/10.1002/app.34005.
Li, W., Ryan, A.J., Meier, I.K., 2002. Effect of chain extenders on the morphology development in flexible polyurethane foam. Macromolecules 35, 6306–6312, http://dx.doi.org/10.1021/ma020231l.
Lim, H., Kim, S.H., Kim, B.K., 2008. Effects of the hydroxyl value of polyol in rigid polyurethane foams. Polym. Adv. Technol. 19, 1729–1734,http://dx.doi. org/10.1002/pat.1188.
Liu, H., Liu, Z., Yang, M., He, Q., 2013. Superhydrophobic polyurethane foam mod-ified by graphene oxide. J. Appl. Polym. Sci. 130, 3530–3536,http://dx.doi. org/10.1002/app.39406.
Miller, M., Bobko, C., Vandamme, M., Ulm, F.J., 2008. Surface roughness crite-ria for cement paste nanoindentation. Cem. Concr. Res. 38, 467–476, http://dx.doi.org/10.1016/j.cemconres.2007.11.014.
Narine, S.S., Kong, X., Bouzidi, L., Sporns, P., 2007. Physical properties of polyurethanes produced from polyols from seed oils: II. Foams. J. Am. Oil Chem. Soc. 84, 65–72,http://dx.doi.org/10.1007/s11746-006-1008-2.
Palanisamy, A., Rao, B.S., Mehazabeen, S., 2011. Diethanolamides of castor oil as poly-ols for the development of water-blown polyurethane foam. J. Polym. Environ. 19, 698–705,http://dx.doi.org/10.1007/s10924-011-0316-2.
Pittenger, B., Erina, N., Su, C., 2012. Bruker Application Note AN128, Rev. B0. Rashmi, B.J., Rusu, D., Prashantha, K., Lacrampe, M.F., Krawczak, P., 2013.
Development of water-blown bio-based thermoplastic polyurethane foams using bio-derived chain extender. J. Appl. Polym. Sci. 128, 292–303, http://dx.doi.org/10.1002/app.38183.
Ravey, M., Pearce, E.M., 1997. Flexible polyurethane foam: I. Thermal decom-position of a polyether-based, water-blown commercial type of flexible polyurethane foam. J. Appl. Polym. Sci. 63, 47–74, DOI:10.1002/(SICI)1097-4628(19970103)63:1<47::AID-APP7>3.0.CO;2-S.
Schön, P., Bagdi, K., Molnár, K., Markus, P., Pukánszky, B., Vansco, G.J., 2011. Quantitative mapping of elastic moduli at the nanoscale in phase sepa-rated polyurethanes by AFM. Eur. Polym. J. 47 (4), 692–698,http://dx.doi.org/ 10.1016/j.eurpolymj.2010.09.029.
Sharma, C., Kumar, S., Unni, A.R., Aswal, V.K., Rath, S.K., Harikrishnan, G., 2014. Foam stability and polymer phase morphology of flexible polyurethane foams synthesized from castor oil. J. Appl. Polym. Sci. 131 (17), 406681–406688, http://dx.doi.org/10.1002/app.40668.
Singhal, P., Small, W., Cosgriff-Hernandez, E., Maitland, D.J., Wilson, T.S., 2014. Low density biodegradable shape memory polyurethane foams for embolic biomedical applications. Acta Biomater. 10, 67–76,http://dx.doi.org/ 10.1016/j.actbio.2013.09.027.
Sonnenschein, M.F., Wendt, B.L., 2013. Design and formulation of soybean oil derived flexible polyurethane foams and their underlying polymer structure/property relationships. Polymer 54, 2511–2520,http://dx.doi.org/ 10.1016/j.polymer.2013.03.020.
Tu, Y.C., Suppes, G.J., Hsieh, F.H., 2008. Water-blown rigid and flexible polyurethane foams containing epoxidized soybean oil triglycerides. J. Appl. Polym. Sci. 109, 537–544,http://dx.doi.org/10.1002/app.28153.
Tu, Y.C., Suppes, G.J., Hsieh, F.H., 2009. Thermal and mechanical behavior of flexible polyurethane-molded plastic films and water-blown foams with epoxidized soybean oil. J. Appl. Polym. Sci. 111, 1311–1317,http://dx.doi. org/10.1002/app.29178.
Ugarte, L., Fernández-d’Arlas, B., Valea, A., Gonzalez, M.L., Corcuera, M.A., Eceiza, A., 2014. Morphology–properties relationship in high renewable content polyurethanes. Polym. Eng. Sci. 54, 2282–2291, http://dx.doi.org/10.1002/ pen.23777.
VanLandingham, M.R., Villarubia, J.S., Guthrie, W.F., Meyers, G.F., 2011. Nanoindentation of polymers: an overview. Macromol. Symp. 167, 15–43, DOI:10.1002/1521-3900(200103)167:1<15::AID-MASY15>3.0.CO; 2-T.
Varam, S., Rajulapati, K.V., Bhanu Sankara Rao, K., 2014. Strain rate sensitivity studies on bulk nanocrystalline aluminium by nanoindentation. J. Alloys Compd. 585, 795–799,http://dx.doi.org/10.1016/j.jallcom.2013.09.116.