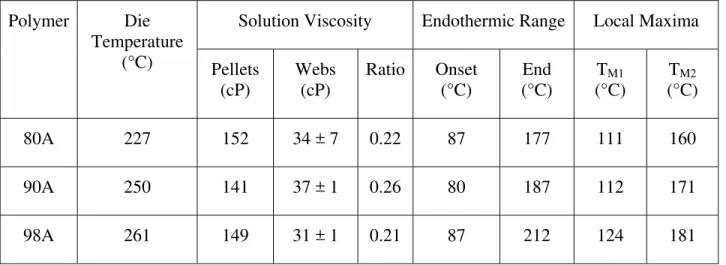
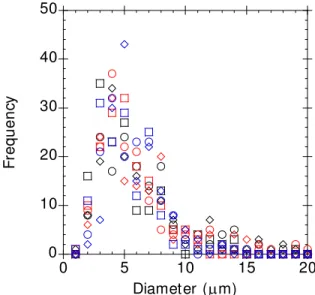
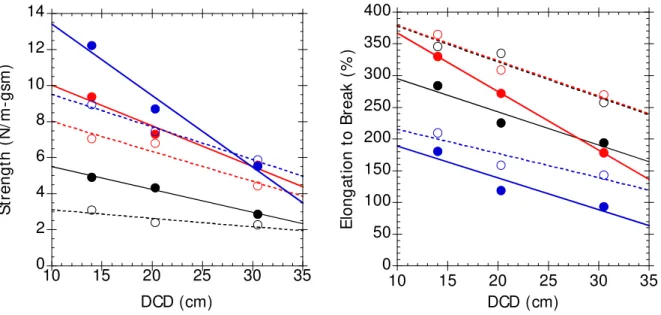
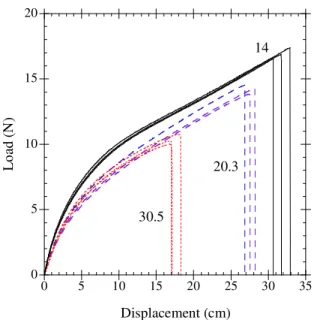
Polyether Based Thermoplastic Polyurethane Melt Blown Nonwovens
Texto
Imagem
Documentos relacionados
We observed that thoracic mobility decreases with the progression of pregnancy in the three anatomical points considered, and respiratory muscle strength also decreases during
For the same nominal protection thickness the criticai temperature and fire resistance time decreases with increasing the degree of utilisation. In the SHS and CHS protected
The study [4] on tensile properties of treated and untreated groundnut shell filled natural rubber composites reported that the tensile strength of the composite decreases
According to the results presented, tensile strength, elongation at break, vicat softening point, melting tem- perature, crystallization temperature, tensile strength (MD)
Improvements in some properties, such as the longitudinal modulus of elasticity, are frequently associated with decreases in other properties, such as the limit of tensile
By increasing the oxygen ratio, the deposition rate decreases and subsequently crystalline quality degrades as it related to the decrease of the grain size,
creased by increasing the diameter of pulse shaper. The rising time decreases and dispersion becomes seriously with the increasing of the striker bar velocity. 2) By
The blends with thermoplastic starch using 30% glycerol were less rigid and had a lower tensile strength than the specimen with TPS25 (25% glycerol), and higher elongation at
