INFLUENCING FACTORS ON USER ACCEPTANCE OF LOCATION-BASED ADVERTISING OUTSIDE AND INSIDE RETAIL STORES
Eric Stange
Dissertationsubmitted as partial requirement for the conferral of
Master in Marketing
Supervisor:
Prof. Paulo Miguel Rasquinho Ferreira Rita, ISCTE Business School, Departamento de Marketing, Operações e Gestão Geral
Resumo
De 2013 a 2014, a penetração do smartphone a nível mundial aumentou 25%, até 1.6 biliões de usuários. Até ao ano de 2018, são esperadas que mais de 2.5 biliões de pessoas usem smartphones, com o tempo médio de uso a ser atualmente já maior do que o da televisão. Com o crescente aumento do tempo que as pessoas gastam no uso dos seus smartphones, cresce também o impacto destes dispositivos no comportamento das pessoas. Já hoje, os smartphones são vistos como pessoais e, muitas vezes, confiáveis como primeira fonte para informação necessária. Em concordância com estes desenvolvimentos, partes significativas de orçamentos de marketing são deslocadas dos canais tradicionais para os canais móveis e os profissionais de marketing procuram por novas oportunidades para entregar mensagens de publicidade a potenciais clientes. Com a publicidade baseada em localização, os profissionais de marketing têm um instrumento que é capaz de facultar informação em relação direta com a localização geográfica de um usuário, num momento em que o usuário a vê como relevante e é mais provável que aja em resultado. Graças a uma nova tecnologia designada de Beacon, o rastreamento de localização é agora possível mesmo dentro de edifícios fechados e preciso até menos de um metro. De forma a que os profissionais de marketing usem essa informação, os consumidores têm de dar o seu consentimento e instalar um aplicativo dedicado nos seus smartphones. Dentro desta tese, foram analisados os fatores que influenciam o consentimento da publicidade baseada em localização por parte dos usuários. A aplicação da pesquisa estatística dos dados, coletados num estudo com 109 usuários internacionais de smartphones, levou às conclusões de que a utilidade percebida desta tecnologia de publicidade é o que influencia mais os usuários, seguido da facilidade de uso e da atitude geral para com a publicidade. Os resultados podem contribuir para o futuro desenvolvimento de campanhas de publicidade baseadas em localização, fornecendo aos profissionais de marketing perceções substanciais em fatores-chave para campanhas bem sucedidas.
Palavras-chave: publicidade móvel; mobile marketing; a publicidade baseada em localização; fatores de aceitação de tecnologia; beacons
Abstract
From 2013 to 2014, smartphone penetration worldwide rose by 25% up to 1.6 billion users. By the year 2018 even more than 2.5 billion people are expected to use smartphones, with the average use time being already today higher than the one of television. With the increasing time people spend using their smartphones, also the impact of this devices on people’s behavior grows. Already today, smartphones are perceived as personal and often trusted as the first source for necessary information. In accordance with these developments, significant shares of marketing budgets are shifted from traditional media to the mobile channel and marketers look for new possibilities to deliver advertising messages to potential customers. With location-based advertising, marketers have an instrument, which is capable of delivering information in direct relation to a user’s geo-location at the time when a user perceives them as relevant and is most likely to react upon it. Thanks to a new technology called Beacon, location tracking is now possible even inside closed buildings and accurate up to less than one meter. In order for marketers to use this technology, customers need to give their approval and install a dedicated app on their smartphones. Within this thesis, factors that influence users’ acceptance of location-based advertising were analyzed. Application of statistical research on the data, collected in a study with 109 international smartphone users, led to the conclusions that the perceived usefulness of this advertising technology influences user’s acceptance the most, followed by the ease of use and the overall attitude toward advertising. The results can contribute to future development of location-based advertising campaigns, providing marketers with substantial insights on key factors for successful campaigns.
Keywords: mobile advertising; mobile marketing; location-based advertising; technology acceptance factors; beacons
Table of contents
1 Introduction ... 1
1.1 Location-based marketing and the new possibilities of beacons ... 1
1.2 Objectives and relevance of this paper ... 4
2 Literature review and conceptual model ... 6
2.1 Literature review from a marketing view ... 6
2.2 Literature review from a technological view ... 9
2.3 Literature review from a psychological view ... 14
2.4 Relation between marketing, technology and psychology... 16
2.5 Conceptual model ... 17
3 Methodology ... 22
3.1 Development of survey ... 22
3.2 Development of multiple linear regression model ... 26
4 Results ... 30
4.1 Sample group analysis ... 30
4.2 Research on sociodemographic data ... 34
4.3 Hypotheses analysis ... 35
5 Conclusion ... 36
5.1 Theoretical contributions ... 36
5.2 Relevancy to practice ... 37
5.3 Limitations ... 39
5.4 Opportunities for future research ... 41
References ... 42
List of abbreviations
BLE Bluetooth Low Energy GPS Global Positioning System
IEEE Institute of Electrical and Electronics Engineers LAA Location-aware advertising
LBA Location-based advertising
RSSI Received Signal Strength Indication SIG Bluetooth Special Interest Group UUID Universally Unique Identifier WIFI Wireless Fidelity
WLAN Wireless Local Area Network
List of figures
Figure 1: Conceptual model ... 17
Figure 2: Frequency statistics of the criterions ... 26
Figure 3: Scatterplot for the regression model with LBA in general ... 28
Figure 4: Distribution of participants' age groups ... 30
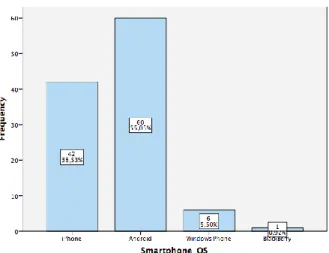
Figure 5: Distribution of smartphone operation systems amongst respondents ... 31
Figure 6: Smartphone use to search for information online ... 32
Figure 7: Smartphone search behavior by location ... 33 Figure 8: Questionnaire concept ... VII Figure 9: Survey data ... IX Figure 10: Variables used for research ... IX Figure 11: Overview results hypotheses testing for acceptance of LBA in general ... XIX Figure 12: Overview results hypotheses testing for acceptance of LBA with beacons ... XX
1 Introduction
1.1 Location-based marketing and the new possibilities of beacons
With the introduction of the first generation iPhone by Apple Inc. in 2007, the experience for users when consuming mobile Internet services for the first time became comparable with the rich Internet experience they were used to from their fixed line Internet connections. While the iPhone’s high price point limited its accessibility to early adopters, the distribution of low and medium cost smartphones running the free android operating system by Google Inc. made mobile Internet services available for a broader audience. From 2013 to 2014, smartphone penetration worldwide rose by 25% to 1.64 billion smartphone users. Even though the annual growth rate is expected to slow down, the absolute number of smartphone users will increase to 2.56 billion people by 2018, which accounts for over one third of consumers worldwide (eMarketer, 2014). According to (Ericsson, 2014), 90% of the world’s population who are over six years old will have a mobile phone by 2020. And people spend more and more of their time looking at the screen in their hands. The average smartphone user in the UK spends 2 hours and 26 minutes per day with his smartphone – calls not included (eMarketer, 2015). In the US, smartphone users even spend 2 hours and 57 minutes per day on average on smartphone usage, which is more than the time they spend in front of the television (2h 48min) (BloombergBusiness, 2014). Even more interesting for marketing professionals than the pure use time is that smartphones are perceived as a very personal device. For example, Matt Yorke, president of IDG Strategic Marketing Services says: "It sits by my bed, it's the alarm clock, it's the last thing I see at night and the first thing I see in the morning" (Worcester Business Journal, 2012). Furthermore, users connect with their peer groups via various instant messenger apps, their favorite social networks or platforms according to their respective interests. The era of smartphones deeply influenced/effected various areas of people’s lives including work, personal interaction and media consumption. After broadband Internet and video-on-demand made users independent from program schedules, smartphones give users the freedom to consume media completely independent from time and place. The average daily using hours of traditional media like TV, Radio or Newspaper are constantly declining; in 2014 already people in 26 out of 32 analyzed countries spent more time online rather than with traditional forms of media (Mander, 2014). While the change in media
consumption is proven by statistics and is undisputed, it is surprising that advertising spending so far is not shifting accordingly. This is especially noticeable in mobile media consumption, which already accounts for 20% of total media consumption with only 4% of the total advertising spending allocated to this medium (BloombergBusiness, 2014). While advertising in traditional media struggles with high wastage due to limited targeting possibilities, mobile advertising can be delivered more specifically thanks to unique device identifiers like Android’s Advertising Identifier (Google Inc. , 2015) or the Apple AD ID (Apple Inc., 2015). When consumers move to mobile, advertisers who try to reach consumers have to move as well; especially due to new targeting possibilities, which make mobile advertising more interesting for marketers, a budget shift can be expected that will align the money spent on advertising with the importance of the medium.
Furthermore, statistics indicate that smartphones are widely used on the go. For example, more than 40% of search queries made from mobile devices have a local reference (Göpfert, 2015). Answering location-related search queries with suitable offers could be a remunerative business, given users would accept this kind of advertising and perceive it as useful instead of being irritated by the high level of privacy invasion. The possibility to reach a specific customer right at the place and time of purchase seems to be the ultimate marketing tool, which is why several authors stress that location-aware advertising will be a critical success factor for retailers in the near future (Cookson, 2015), (Kaushal, 2013) (Davis T. , 2013), and has the potential to result in significant revenues for service providers, wireless carriers, application developers and integrators. Even though e-commerce is on the rise, in Western Europe in 2013 traditional stationary retail still accounts for 90.5% of total retail sales of goods (Ecommerce Europe, 2014), which makes it attractive for marketers to address consumers right at the point of sale. Marketers aim to enrich the traditional shopping experience and draw a link between online and offline shopping to influence the customer decision in the moment when it happens. While traditional, satellite or cell-ID based technologies for location-based advertising might be limited indoors, Beacon technology allows to link online and offline worlds by allowing indoor location tracking. Especially, the iBeacon standard introduced by Apple Inc. in 2013, which is supported for iOS Devices with iOS 7 or higher and android devices running on version 4.3 or higher, allows developers a comfortable implementation of this technology. With this technology, marketers are given the possibility to contact exactly the customer they want to reach at exactly the time when they
want to reach them and even exactly the place where they want to reach them. Location-based advertising (LBA) also allows direct communication with consumers without time or location barriers (Zolfaghar, Khoshalhan, & Rabiei, 2012).
It can be expected that, in future years, a consumer culture will develop which will determine the conditions under which the majority of consumers will be willing to share their data with enterprises. There is the chance that users will perceive LBA as useful and see the benefits they get from advertising, which is specifically customized to their respective location. However, there is also the possibility that users will be made to feel uncomfortable by marketers intruding on their privacy. Hence customers must recognize a benefit for themselves and find the data usage proportionate, while the enterprise that wants to use data marketing has to create an atmosphere of safety and transparency (Bloching, Luck, & Ramge, 2012).
1.2 Objectives and relevance of this paper
The increase of smartphone penetration and usage time will result in greater attention by marketers who are interested in applying mobile marketing technologies in order to reach their potential customers. To achieve profitability while using mobile marketing technologies, it is essential to apply technology, for example smartphone applications, that is accepted and used by the target audience. For this reason, research on mobile marketing acceptance and especially the factors which influence the acceptance of mobile marketing activities, become more important (Burmann & Warwitz, 2014). One promising technology in the field of mobile marketing is location-based advertising, which recently became available inside closed shops or malls due to the development of a new technology called Beacon (see chapter 2.2). Hence the primary objective of this paper is to understand the factors that influence the users’ intention to use or not use location-based advertising in general, as well as based on the Beacon technology. In order to obtain a deep understanding of customers’ reasoning, existing research on this topic will be reviewed as well as established acceptance research models. From that, factors that may influence users’ attitudes toward LBA will be identified and used to state a number of hypotheses. The conceptual model, as well as the development of the survey, will be presented before the empirical data will be statistically analyzed. Finally, the results will be presented and discussed in regards to their theoretical contributions and managerial implications. The results of this paper can be applied by marketing professionals to build effective location-based mobile marketing strategies, which will be accepted by the intended target group.
Several authors have engaged in the topic of location-based advertising and have already isolated factors that seem to influence consumer acceptance (Richard & Meuli, 2013), (Zolfaghar, Khoshalhan, & Rabiei, 2012), (Brunner II & Kumar, 2007). However, so far no research has focused especially on the Beacon technology and the possibility to track the consumers’ location inside closed buildings such as shopping centers or retail stores. While existing research focuses on location-based advertising in the form of tracking only the area where a customer resides, this paper also examines the consumers’ attitudes toward very accurate location tracking inside retail stores and analyzes the factors influencing the acceptance of this technology, with acceptance being the precondition for use. Furthermore, the fast-changing environment of the analysis justifies the relevance of this work. Research
based on a survey conducted in 2010 with 260 respondents (Richard & Meuli, 2013) seems out-of-date when 56.9% of them indicated, that they have never surfed the Internet by using their mobile phone’s browser. Only five years later, 93.6% use Internet on their smartphones at least several times a week (see 4.1 Sample group analysis for details). Understanding Internet as a key feature of smartphones, a fundamental change in people’s usage behavior suggests to also review their attitude toward Internet related technologies like location-based advertising. As the survey conducted within this study is responded to by a significant share of German citizens, this paper will also contribute to German research, where so far almost no scientific research exists on the users’ intentions to agree to location-based marketing activities (Burmann & Warwitz, 2014). Existing research suggests that a series of factors influence customers’ acceptance of location-based advertising (Amen, 2010); (Burmann & Warwitz, 2014); (Richard & Meuli, 2013). This paper will examine if the same factors that influence the attitude towards traditional location-based advertising also influence the attitude towards very accurate location-based marketing conducted indoors, or if there are different or additional factors to consider. In particular, the impact of the perceived control about personal data, as one possible factor on customers’ attitudes toward mobile marketing, shall be investigated, as people in Western Europe and North America have become very sensitive to data privacy in recent years (Cohen & Balz, 2013). The so-called “NSA affair” in Summer 2013, and the corresponding public debate surrounding data privacy, attracted attention to this topic in Europe and especially in Germany. Even though marketers place huge hopes in mobile location-aware advertising, underestimating users’ privacy concerns or failing to deliver mobile advertising in a way that users accept, could be a huge game-changer; which is why it is so important to gain a deep understanding of potential customers’ feelings about this new technology prior to implementing it.
2 Literature review and conceptual model
2.1 Literature review from a marketing viewIn 2012, one billion people were using smartphones. Worldwide smartphone usage has risen to 1.6 billion users and will exceed two billion in 2015 or early 2016 (ZenithOptimedia, 2015). Even though the growth rate will slow down, by 2018 smartphone usage is expected to have grow on average by 15% a year, (eMarketer, 2014). This vast distribution of smartphones has profoundly changed people’s behavior in a variety of ways. According to (Google, 2013), 61% of German smartphone users access the Internet on the go every single day. Smartphones have become ubiquitous and the relationship to this kind of device more personal than to any other device. Smartphones are used for multiple purposes including entertainment, communication, creativity and utility as well as online purchases of products and services (ZenithOptimedia, 2015) (Google, 2013). People rely on their smartphones to help them make better decisions. They use them as navigation systems if they require directions, to compare prices between retail stores and online stores, or to find out if it is faster to take the underground transit or the bus. A recent survey shows that smartphone users spend an average of 2 hours and 26 minutes a day on their smartphones (eMarketer, 2015). Having a direct communication channel to people, which is used for a long duration every day and is also perceived as personal and reliable, logically attracts marketers and advertising companies alike. Studies show that, particularly digital natives – consumers who grew up with the Internet (Prensky, 2001) - switch their media channel up to 27 times per nonworking hour (Steinberg, 2012). This results from people not focusing on one media channel like TV or Radio anymore, but using smartphones or tablets while consuming other kinds of media. The rise of mobile-only users (ZenithOptimedia, 2015) is likely to intensify this effect. The increasing importance of smartphones is likely to influence marketers to shift their advertising budgets from traditional media to the mobile channel. Studies expect more than half of all new advertising spending globally between 2014 and 2017 to go into mobile (ZenithOptimedia, 2015).
One of the most promising forms of mobile advertising seems to be geo-targeted mobile advertising, as it is perceived as relevant and useful by users who are located at, or close to a position, which is related to the advert (Manyika, et al., 2011). As companies try to invest
their marketing spending in the most profitable way, they need to find forms of advertising, which are able to grab the attention of the targeted customers. Location-aware advertising seems to be one of these forms.
In order to dive deeper into the topic of location-aware advertising, it is necessary to define the use of terms. Within the field of marketing, mobile marketing is understood as “a set of practices that enables organizations to communicate and engage with their audience in an interactive and relevant manner through any mobile device or network” (Mobile Marketing Association, 2015). Mobile advertising, in turn, is a field within mobile marketing and describes the approach to address potential customers by placing advertising on their mobile devices. (Leppäniemi, Karjaluoto, & Salo, 2004) describe mobile advertising as “any paid message communicated by mobile media with the intent to influence the attitudes, intentions and behavior of those addressed by the commercial messages”. Mobile advertising includes banner advertising, in-app advertising, text message advertising and a variety of other forms - one of them being location-aware advertising. According to (Burmann & Warwitz, 2014), to date, no uniform definition for location-aware advertising has been established. However, the main character of LAA is the utilization of the consumer’s current position in combination with other attributes, aiming to deliver advertising that is relevant to the consumer in a certain moment at a certain time. In comparison with mass advertising, LAA aims to return a higher relevance for the potential customer, create excitement and result in Click Through Rates, up to five times higher than the industry average (Verve Wireless, Inc, 2013). Using big data analysis in combination with LAA can leverage the marketing effect with detailed personal information about potential customers and their preferences.
Location-aware advertising can be divided according to the initialization in push and pull. In the event that a user actively searches for information (e.g. a nearby restaurant) and as a reaction to this search query he or she receives an advertisement for a local restaurant on his or her smartphone, this form of location-aware advertising is called pull. Google’s data reveals that 88% of smartphone users in Germany search for local information right where and when they need it. 78% act upon the search result - they contact the store or make a purchase (Google, 2013). In combination with the possibilities of big data and strong algorithms, LAA becomes an extremely powerful tool. In this context, the data collected by a smartphone regarding usage and search behavior is of greater value than from a desktop
computer because of the added location attribute. Smartphones can be used for information research independent from time and place in almost every situation. By linking the search behavior of customers to their respective location and time, conclusions can be drawn on place and time of the need for certain information. From these findings, individual user profiles can be created and used to address customers in a customized way. Smartphone data and modern technologies such as big data analysis hereby allow marketers not only to create profiles for groups of customers, but individual profiles for single customers. Linkage and integration of information from different sources allows marketers to address context-sensitive, extremely personalized advertising to the right person at the right time at the right place (Burmann & Warwitz, 2014).
Pushed LAA in turn refers to the advertising a user receives on his or her phone without an
active search; it is merely triggered by the smartphone entering a predefined geolocation. By combining digital geographic information with location coordinates from a smartphone, it becomes possible to determine when it enters or leaves a predefined area. This so-called geo-fencing is already commonly used, mainly in security-relevant cases. Car rental companies, which want to make sure their cars are only used within one country for example, equip their cars with GPS transmitters and define the permitted driving area within their system. If a car leaves the allowed area, the system recognizes and sends a notice to the company. The same system is used by security transport companies, which predefine the routes of their trucks. As soon as a truck digresses, the system gives alarms the company. For the use case of location-aware advertising, it is less interesting if a customer leaves a certain area; Marketers are rather interested in customers entering a certain area, for example a walking distance radius around a shop. Geo-fences are set up using GPS or cell tower triangulation to determine the position of a smartphone. These technological procedures, however, reach their limits when it comes to locating smartphones within closed buildings. To determine positions of smartphones within closed buildings, more creative approaches like Wi-Fi, ultrasound or Beacons need to be used (see chapter 2.2. for more detail).
2.2 Literature review from a technological view
There are several technological possibilities to realize the tracking of a smartphone. The most common ones shall be outlined below.
GPS
Officially introduced in July 1995, the Global Positioning System is a satellite navigation system under operation by the United States Government. Currently 30 Satellites are surrounding the earth in medium earth orbit at an altitude of approximately 20.200 km and are returning position and time information (PNT, 2015). The US Government makes the system freely accessible enabling receivers to pick up the signal and determine their positions in real time. The basic principal of GPS is that a positioning satellite sends a radio signal containing its current location and time. A receiver (e.g. a smartphone) is then able to calculate its own position, independent of the satellite. By calculating the time the signal needs to reach from the satellite to the receiver, an estimation of the position is determined. This calculation becomes more precise the more satellites are in reach of the receiver. To calculate an accurate position on a flat map, position data from at least three satellites is necessary. To determine a position in a three-dimensional room, position data of at least four satellites is necessary. With the help of different accuracy enhancing systems, GPS nowadays is accurate up to one meter (GSA, 2015). One disadvantage of GPS is that it is susceptible to disturbances like snow or wet leaves, and is increasingly, if not completely ineffective in closed buildings.
Cell ID
Mobile network providers have another system that determines the position of a mobile phone, independent from satellites. Cell tower triangulation is a method to calculate a phone’s position based on the mobile network cell the phone uses at a certain time. Every base transceiver station has a unique Cell ID which links a database to the position data of the transceiver. By knowing which cell a phone is using, how strong the signal is and how far it is from the neighboring cells, it is possible to calculate the approximate position of a phone. For accurate positioning on a flat map, at least three cell towers need to be in reach of the phone. The accuracy of this method is highly dependent on the density of cell towers in an area; In
urban areas where network cells are smaller, the system functions more precisely than in rural areas, where one transceiver sometimes covers several kilometers.
WIFI
A wireless local area network (WLAN) usually has a range of 30 to 100 meters on open terrain and considerably less within closed buildings with walls, which interfere with the signal. If a smartphone is connected to a WLAN, it means it has to be within the WLAN’s range, which is why this connection can be used for estimation of the smartphone’s position. The accuracy is dependent on the strength of the WLAN signal the phone receives, the received signal strength indication (RSSI). Another, more accurate, method of utilizing WiFi1 for positioning is wireless fingerprinting. This method works with predefined profiles of locations based on the unique combination of different WiFi signals in reach and their corresponding strength (Lawson, 2012). This method is accurate up to a few meters; however, it requires an initial setup of location fingerprints, either the first time a phone is in a location, or by a service provider capturing WiFi location fingerprints (Bshara, Orguner, Gustafsson, & Van Biesen, 2010).
Ultrasound
A less common method, but proven in practice, is utilized by customer loyalty company Shopkick. As their business model is based on rewarding people for entering certain partner shops, they had to find a system that would work inside closed buildings and distinguish between a user walking by a shop and one walking into it. By using ultrasounds that are unable to penetrate walls, Shopkick ensures that only users inside the shop get rewarded. The ultrasounds are at too high a frequency for humans to hear and can travel up to 46 meters inside a store. A smartphone, with the dedicated app running, can process the sounds using its built-in microphone. With each store having its own unique set of sounds, the app is able to determine which store the customer is in.
1 WiFi is, for marketing purposes, an invented term, which stands for Wireless Fidelity, analogous to Hi-Fi. It
Terrestrial transmitters
The functional principal of GPS, but with stationary transmitters on buildings and cell towers, is used in a positioning system developed by an Australian company called Locata. Because the transmitters send much stronger signals to receivers than satellites can from space, positioning is determined almost instantly and is accurate up to five centimeters. With a signal strength that penetrates walls, this technology also works indoors. Terrestrial transmitters only function local, but can be useful for areas with poor GPS coverage or indoors. Receivers that are able to pick up the signals and operate with them are high in price (around $2.500 vs. $5 for a standard GPS receiver) and are therefore currently merely of interest to professional customers like governmental organizations or, for example, transportation companies (Lawson, 2012) (Locata, 2015).
Bluetooth Beacons
Bluetooth is an industry standard according to IEEE 802.15.12 and developed during the 1990s by the Bluetooth Special Interest Group3, which contains the technical specifications for short-range data transmission via radiocommunication. The original purpose of Bluetooth technology was to facilitate the exchange of data between mobile devices and computers without the need for cables. The Bluetooth standard was refined over the years to increase the transmission speed as well as the allowed packet size. The latest version of the core specification adopted by the Bluetooth Special Interest Group is 4.2 from 2nd December 2014 (Bluetooth SIG, 2015).
2 Institute of Electrical and Electronics Engineers, worldwide organization of engineers 3 The Bluetooth Special Interest Group (SIG) is a collective of more than 8,000
organizations and companies, which are interested in the development and the distribution of Bluetooth technology. The collective was founded in 1998 by Ericsson, IBM, Intel, Nokia and Toshiba and extended in 1999 by 3Com, Lucent, Microsoft and Motorola. Bluetooth SIG is the owner of the Bluetooth trademark and publisher of the Bluetooth specification.
Since Version 4.0 was released in April 2010, the extension Bluetooth Smart was added to the Bluetooth standard. Also referred to as Bluetooth Low Energy or Bluetooth LE (BLE), this new standard limits the range as well as the speed of the data transmission in order to significantly decrease energy consumption levels, compared to the original standard. Therefore the application of BLE is focused on use-cases which compliment long-lasting devices with little data to transmit (e.g. wearable devices). Bluetooth Smart is not a mandatory part of the Bluetooth standard but optional for manufacturers of any Bluetooth-enabled device. For this reason, a Bluetooth 4.0 device is not necessarily able to communicate with a Bluetooth Smart device. Devices referred to as Bluetooth Smart-ready are able to communicate via the original Bluetooth standard as well as via Bluetooth Smart. This requires two separate transmitters built into the device; one for Bluetooth communication and one for Bluetooth Smart communication.
Based on the BLE technology, Apple Inc. introduced a proprietary standard for indoor navigation in 2013 called iBeacon (Apple Inc., 2015). The name of the technology derives from its basic functional principle. Similar to a lighthouse, a transmitter sends a signal in fixed intervals without knowing if and who is receiving it. This technology can be used to establish a region around an object, enabling a device (usually a smartphone) to determine when it enters or leaves this region and estimate the distance to the transmitter. As one example of this technology’s use in LBA, users who have installed an app and given permission to share their location data can receive push notifications on their smartphone’s home screen as soon as they enter an area pre-defined by the beacon. Via BLE, the transmitting object sends only the following information, which is organized within a three-level hierarchy:
o UUID with 16 bytes o Major with 2 bytes o Minor with 2 bytes
The Universally Unique Identifier (UUID) indicates in a standard notation the highest hierarchy in a group of beacons, which could, for example, be a company. The major indicates the next level, which could, for example, be the location of the different stores of a company. The lowest level stated by the Minor, could, for example, identify the different departments within a specific store. As the transmitter only gives the three described
alphanumeric values, in order to determine the position of a smartphone the necessary background logic has to be provided by an application installed on the smartphone. Additional to the provided information, the smartphone uses the Received Signal Strength Indication (RSSI) to determine the proximity to the beacon as well as the accuracy of the estimation of the proximity. The stronger the signal, the higher the accuracy of the proximity estimation. The perceived proximity can have four different states: immediate, near, far or unknown. Immediate indicates that the smartphone is very close to the transmitting beacon. Apple does not provide detailed information about what is meant by ‘very close’ in their technical documentation. However, the state ‘near’ is described as indicating a distance of one to three meters to the beacon. The state ‘far’ indicates that the accuracy of proximity estimation is too poor to provide information on the distance. According to Apple’s specification, this does not necessarily mean that the smartphone is physically far from the beacon; instead it indicates a low accuracy of proximity estimation, which could be attributed to a variety of reasons - for example, an obstacle blocking the signal. The state ‘unknown’ indicates that the device is not able to determine the proximity to the beacon or that the ranging process has just begun. If not only the relative distance to the beacon is of interest but also the position of the smartphone within a two-dimensional space, it can be calculated with the principle of trilateration, which will not be explained in detail in this paper. In essence, the smartphone needs to receive the signals from three different beacons in order to determine the position of a smartphone using trilateration, Further, in order to determine the position within a three-dimensional room, four beacons in range are necessary.
With a suitable app installed, a smartphone or other device will be able to automatically pick up the signal from these beacons and calculate its relative position. This again can be used to trigger different kinds of contextual actions. While the principal of triangulation is the same for location tracking with Cell ID, GPS and beacons, the main difference between the technologies is that beacons, for the first time, allow location tracking inside closed buildings. While Cell ID and GPS have limited functionaliy -if any- within closed buildings, beacons are developed especially for short-range location tracking and work just as well inside of buildings as outside.
2.3 Literature review from a psychological view
Research on factors influencing the attitude toward location-based advertising in general already exists (Lee, 2010), (Yousif, 2012), (Richard & Meuli, 2013), and states several factors relevant to the acceptance of this technology; for example: entertainment, informativeness, irritation, personalization, privacy, credibility, personal relevance, incentives, subjective norms or perceived behavioral control.
In order to perform research on acceptance, it is necessary to have a closer look at the term ‘acceptance’ itself. Based on the research of (Müller-Böling & Müller (1986)) acceptance theory differentiates between the aspect of attitude and the aspect of behavior. Acceptance therefore contains an attitude toward a certain behavior and the behavior itself.
In the field of research on the acceptance of new technologies, several authors have suggested theoretical models. The three most widely accepted ones which have proven themselves useful are the technology acceptance model (TAM), the task-technology fit model (TTF) as well as the unified theory of acceptance and use of technology (UTAUT). These will be explained in more detail later. All three models share the same origin, which is the theory of reasoned action (TRA) introduced by Fischbein & Ajzen (1975 & 1980) (Fischbein & Ajzen, 1975) (Ajzen & Fischbein, 1980). Based in the social psychological sciences, TRA explains the relationship between behavioral intention (BI), attitude (A) and subjective norm (SN). Furthermore, this theory suggests that a person’s behavior is likely to follow their behavioral intention. In other words, if a person intends to do something, it is likely that the person will. The behavioral intention in turn is determined by the person’s attitude toward the respective behavior and the subjective norm (BI = A + SN), which makes a person’s attitude toward a behavior an essential requirement for the actual behavior. According to (Fischbein & Ajzen, 1975), attitude is a combination of a person’s beliefs about the consequences of a certain behavior and his or her evaluation of these consequences. Subjective norm on the other hand is explained as a combination of a person’s beliefs about expectations from relevant others and his or her intention to comply with these expectations. In other words, a person is likely to perform a behavior if he or she is expecting a positive consequence and if he or she is expecting relevant others to accept the behavior. A decade after introducing TRA, Ajzen himself revised the theory and added a third component, the perceived behavioral control.
Now called the theory of planned behavior (TPB), it suggests that the perceived behavioral control of a person influences his or her behavioral intention while the actual behavioral control influences the actual behavior (Ajzen, 1991).
Technology Acceptance Model TAM 1989 (Davis F. D., 1989)
In order to explain why people accept or reject information technology, the Technology Acceptance Model suggests two factors, which seem to have a significant influence on system use. A person’s belief in the ability of a system to increase his or her job performance is described as the perceived usefulness. The belief about the effort it takes to use a system is described as the perceived ease of use. While both factors influence the intention to use a system, perceived ease of use also influences the perceived usefulness to a certain extent, as a system that is hard to use is perceived to be less valuable.
Task-Technology Fit Adoption Model TTF 1995 (Goodhue & Thompson, 1995)
(Goodhue & Thompson, 1995) describe the Task-Technology fit (TTF) as “the degree to which a technology assists an individual in performing his or her portfolio of tasks” (p. 216). Later Dishaw and Strong (Dishaw & Strong, 1999) also state that the only reason for or against the use of technology is the user’s perception of the fit between the abilities of the technology and the user’s needs. Whether an individual evaluates the TTF as positive - which would lead to a positive attitude toward the use of the technology - or negative, is determined by three factors: the task, the technology and the individual. All three factors are influenced by sub-factors themselves and together influence the decision to use or not use a system.
Unified Theory of Acceptance and Usage of Technology UTAUT 2003 (Venkatesh, Morris, Davis, & Davis, 2003)
In their paper from 2003, (Venkatesh, Morris, Davis, & Davis) proposed a model which combines elements of eight prominent models already existing in the field of technology acceptance research. The new model was empirically tested and proven to outperform the existing models when used with the original data, as well as with data from two new studies. The model uses a total of four key factors to explain user intention toward system use. Three
of these are assumed to directly determine the behavioral intention: performance expectancy, effort expectancy and social influence. The fourth one, facilitating conditions, is assumed to directly determine the actual usage behavior. The first three factors also influence the usage behavior indirectly through the behavioral intention.
2.4 Relation between marketing, technology and psychology
Extensive literature review on all of the three above-mentioned areas was necessary before developing a concept for the actual analysis. One aim of this paper is to find out if the technology used for LBA has an influence on users’ acceptance. Depending on the technology used for the necessary location tracking, a different level of accuracy can be reached. While GPS tracks accurately up to a few meters and only in open-air areas, Beacons allow for far more accurate tracking even inside closed buildings. This level of accuracy allows advertising campaigns to reach people on a more personal level. Hence LBA is not necessarily perceived in the same way when using different technologies. For this reason, the accuracy factor shall be addressed in this research by analyzing the user acceptance for LBA in general as well as for LBA with the very accurate Beacon technology. As past research has only focused on the aforementioned psychological influencing factors, the technology as a factor also brings in a new perspective for the scientific research on this topic. From a marketing perspective it is desirable to get insights on if and how the accuracy factor, determined by the technology used, influences user acceptance, in order to adjust future campaigns by employing the technology with which users are most comfortable.
2.5 Conceptual model
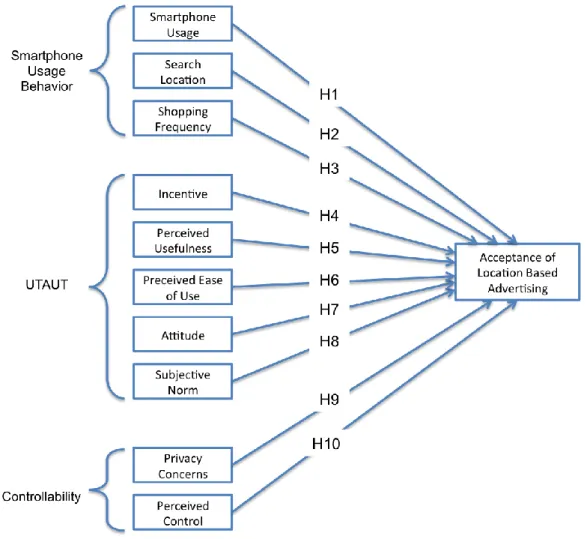
Based on the review of existing theories conducted in chapter 2.1 to 2.3, ten hypotheses regarding the influential factors on the acceptance of LBA are proposed in this paper. All hypotheses try to explain the relation between independent attributes/variables of users and their acceptance of location-based advertising. In other words, they attempt to explain if and how various factors influence the users’ acceptance. The hypotheses are structured in a conceptual model combining potentially influential factors taken from the literature review as well as from different technology acceptance models. The conceptual model is divided into three sections: smartphone usage behavior, UTAUT and controllability.
Figure 1: Conceptual model
As it was not justifiable to test the actual behavior of people, it seemed reasonable to ask them for their behavioral intention and assume that their actual behavior will follow their intention (in accordance with (Venkatesh, Morris, Davis, & Davis, 2003, P. 427), “intention as a
predictor of behavior”. Hence, the intention of people to use LBA in combination with their intention to recommend it to friends is defined as acceptance of LBA in the context of this paper (consider chapter 3: Methodology for details).
In addition to the hypotheses, which will be described in greater detail to follow, statistical research has been conducted on the sociodemographic data of the respondents in order to analyze the influence of age, gender or educational level on the acceptance of location-based advertising.
Based on the carefully conducted literature review, it seems reasonable to assume that people with a higher acceptance for smartphones in general also tend to have a higher acceptance to utilize them for the application of LBA. The extent to which the smartphone is accepted in general shall be measured by the intensity of usage. Therefore:
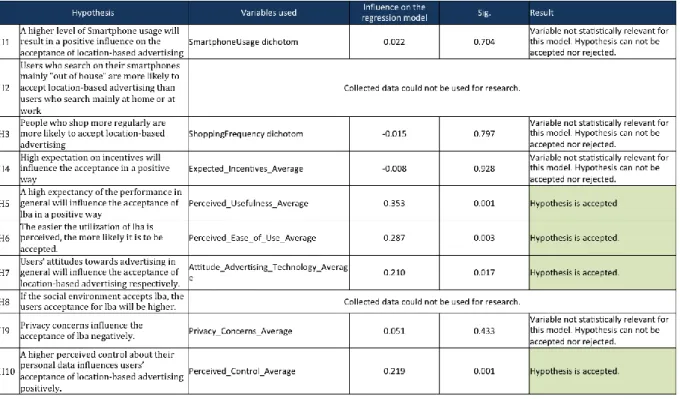
H1: A higher level of smartphone usage will result in a positive influence on the acceptance of location-based advertising
As already mentioned in the literature review, statistics indicate that smartphones are widely used on the go. In Germany, for example, 67% of private smartphone owners never leave the house without them (Google, 2013) and more than 40% of search queries made from mobile devices have a local reference (Göpfert, 2015). These facts lead to the assumption that where a smartphone is used influences the acceptance of LBA. Hence:
H2: Users who search on their smartphones mainly “out of house” are more likely to accept location-based advertising than users who search mainly at home or at work
As one of the main applications of location-based advertising is to promote local shops or special offers, it seems obvious that people who frequently go shopping would have a higher interest in LBA than people who go shopping less often. It can be assumed that people who have a higher interest in a topic are also more likely to accept a technology dealing with this topic.
Therefore:
H3: people who shop more regularly are more likely to accept location-based advertising
Another goal of this study was to test if the UTAUT can be applied to location-based advertising. Hypotheses H4 to H8 are therefore based on the UTAUT key factors, performance expectancy, effort expectancy and social influence, which are supposed to directly influence a user’s behavioral intention; in this case the intention to accept location-based advertising. The key factor facilitating conditions from the UTAUT is supposed to directly influence the actual behavior of a user. As the actual behavior is not tested during this study, facilitating conditions will also not be tested.
According to (Venkatesh, Morris, Davis, & Davis, 2003) the expectation of high performance from a system or a technology influences the acceptance of the respective technology positively. In other words, if users have the expectation of getting positive results from the use of a given technology, they are more likely to accept and use that technology. In the case of location-based advertising, the performance can be measured by the benefit the user gets from using the technology. This benefit can, for example, be a financial one in the form of a discount, a voucher or a similar incentive for the purchase of a product in which the user is interested. Customers must recognize a benefit for themselves and find the data usage proportionate (Bloching, Luck, & Ramge, 2012). Therefore:
H4: High expectation of incentives will influence the acceptance in a positive way
The benefit can also be more abstract in the form of entertainment for the user or relevant information on products that the user is interested in. Hence:
H5: A high expectancy of the performance in general will influence the acceptance of LBA in a positive way
The perceived performance of a technology is always seen alongside the perceived effort of using the technology. If a technology is too hard to use, it loses value in the perception of the
user. In other words, if the effort needed to use a technology is perceived as to high in comparison to the benefit of the technology, it influences the perceived performance negatively (Venkatesh, Morris, Davis, & Davis, 2003, P. 446-451). Consequently:
H6: The easier the utilization of LBA is perceived, the more likely it is to be accepted.
As the theory of planned behavior already indicates that attitude influences behavioral intention, it seems reasonable to assume that a user’s attitude toward LBA influences their acceptance of it. Despite the technological elements of LBA, it is still a form of advertising; so it can be assumed that a user’s general attitude toward advertising also influences their attitude toward location-based advertising. Hence:
H7: Users’ attitudes toward advertising in general will influence their acceptance of location-based advertising respectively.
The UTAUT key factor social influence indicates that people tend to be more likely to accept a technology if it is accepted in their peer group as well (Venkatesh, Morris, Davis, & Davis, 2003, P. 451-453). It can be assumed that the acceptance of LBA will be higher in cases where family, friends and colleagues use LBA or consider it useful. In short:
H8: If the social environment accepts LBA, the users’ acceptance for LBA will be higher.
To unleash the full potential of location-based advertising, it is necessary for users to allow providers to use their location data, link it to their user profile and do research on the buying behavior of the user. Users might consider this kind of information very personal and might have concerns about the processing of their personal data. Especially since public debates about the use of personal data have been rapidly increasing in the last four years, people have become more sensitized to this topic. It therefore seems obvious to test the influence of privacy concerns on the acceptance of LBA.
The theory of planned behavior already indicates that the perceived control of a behavior influences the intention to behave respectively (Ajzen, 1991). This leads to the assumption that the perceived control of the use of the personal data in the context of location-based advertising also influences the acceptance of this technology. In short:
H10: A higher perceived control of their personal data influences users’ acceptance of location-based advertising positively.
3 Methodology
3.1 Development of survey
In order to test the hypothesis stated in chapter 2.5, a scientific survey has been conducted. The survey was developed and prepared in March and the beginning of April 2015 and was open for answers over a period of four weeks from the 8th April to the 5th May. The survey was conducted online only and designed to be comfortably accessible via a personal computer, a tablet or a smartphone. Pretests with volunteers were carried out with a focus on comprehensibility of the questions as well as average time to complete the questionnaire. In order to keep the number of aborted surveys low, it was ensured that the questionnaire would not take longer than five minutes to answer. This was achieved by keeping questions short and grouping questions in a way that multiple questions were verbalized similarly. Furthermore, multiple choice and scaled answers allowed quick and stress-free participation for the interviewees. The online survey was conducted with the web-based software SoSci Survey4, which is especially designed for scientific research projects. SoSci Survey is financed by business customers and free to use for scientific or university purposes. It was chosen because of the variety of possible question designs, the reporting capabilities and its references. Also, data output in an SPSS readable format was a mandatory requirement. As most major German universities work with this tool, it can be assumed that the data collection works accurately and according to scientific requirements. After design and test, the survey was opened to the public on the 8th April 2015, and accessible under the weblink https://www.soscisurvey.de/lba2015/. It was then repeatedly advertised on the social media platform Facebook5 as well as with flyers containing the weblink and a QR Code, which were distributed at Humboldt University Berlin as well as at Jacob-und-Wilhelm-Grimm-Zentrum Berlin6. Interviewees could choose between German and English language on the first page of the survey.
The development process of the survey ran through three stages: 1) Definition of necessary data; 2) Structure of questionnaire; 3) Set up of questions and related answer options.
4www.SoSciSurvey.de operated by SoSci Survey GmbH, Marianne-Brandt-Str. 29, 80807 München, Germany 5www.facebook.com operated by Facebook Inc., 1601 Willow Road, Menlo Park, CA 94025, USA
6
The necessary data to test the hypothesis was grouped into four sections within the questionnaire, which are Personal Description, UTAUT, Controllability and Behavioral Intention. The section Personal Description contained a total of eight questions, four regarding sociodemographic data and four regarding the smartphone usage behavior of the interviewees. The hypotheses were tested using data from the sections smartphone usage behavior, UTAUT and controllability.
The section UTAUT was developed in accordance with the Unified Theory of Acceptance and Usage of Technology (Venkatesh, Morris, Davis, & Davis, 2003) and the questions were partially adopted from (Richard & Meuli, 2013), (Davis F. D., 1989), (Ajzen, 1991) as well as (Spil & Schuring, 2005). In this section, the interviewees were given statements and asked to which extent they agreed with them. In order not to overwhelm the participants, the statements were grouped into three sub-sections: Performance Expectancy, Effort Expectancy and Social Influence (section names were not shown to participants). Each group consisted of three or four statements, starting with the same main clause (see Appendix 0). For measurement, the usage of a five-point Likert-type scale seemed appropriate in order to keep the complexity low but still provide a sufficient variety for interviewees to express the extent to which they agree with a statement. The scale was anchored with 1 = ‘strongly disagree’ and 5 = ‘strongly agree’.
The section Controllability was divided into two sub-sections: Privacy Concerns and Perceived Control Of Personal Data. Each section contained a group of three questions regarding the respective topic. Several authors have indicated that privacy concerns play a major role in the acceptance of personalized advertising (Haghirian & Madlberger, 2005), which is why the hypothesis should be tested for location-based advertising as well. Perceived Control Of Personal Data was adopted from the factor Perceived Behavioral Control, which was used in the theory of planned behavior (Ajzen, 1991). The theory states that the perceived control of a behavior is one important factor to influence a person’s intention. It therefore suggests testing if the perceived control of personal data in relation to privacy concerns influences the intention to use location-based advertising.
The last section of the questionnaire covers the behavioral intention of the interviewees, or more specifically the intention to use location-based advertising. The answers from this
section were used as dependent variable that was explained by a number of independent variables from other questions. As it was not possible to verify the actual behavior of the test persons, the behavioral intention was used as a substitute, assuming that behavioral intention leads to actual behavior. In order to test for a difference in the acceptance of location-based advertising outdoors and indoors with beacon technology, the two questions in this section were asked once in regards to based advertising in general and once to location-based advertising inside shops or malls.
In order to conduct statistical analysis, the collected data had to be prepared for better handling. Below, the variables that were used for the analysis are explained in more detail (see also Appendix 0).
As the goal of this work is to identify factors that influence the acceptance of location-based advertising, it is mandatory to have a dependent variable or criterion, “acceptance”, in order to test various independent variables, “predictors”, for their influence on the dependent variable. As mentioned in 2.5, the actual behavior of people could not be measured. Instead, people were asked for their intention to behave and it was assumed that their actual behavior would follow their intention. The dependent variable “acceptance” was then calculated from the mean value of people’s intention to use LBA in general and their intention to recommend LBA in general to friends. The scale used in the questionnaire was a 5-point Likert-type scale, so the results for “acceptance” can vary from 1 to 5 with increasing levels of approval. For further research, the new variable Acceptance_LBA was used.
Analogous to the preparation of the variable ‘Acceptance_LBA’, the variable ‘Acceptance_LBA_Beacon’ has been calculated from people’s intention to use LBA inside shops or malls and their intention to recommend same to friends. The variable’s name was derived from the Beacon technology, which is used for LBA inside shops and malls.
To test the influence of smartphone usage (hypothesis one), the retrieved variable ‘SmartphoneUsage’ could not be used as the results of the sample group were too homogeneous - with 77.1% stating they use their smartphone “every day”. As a solution, the variable was transformed into a dichotomous variable. The five possible characteristics from the original variable - “Every day”, “Several times a week”, “Once a week”, “Once a month”
and “Less or never” - were grouped in to only two - “Every day” and “Less than every day”. The same approach was used for the variable ‘ShoppingFrequency’, which was transformed from “Every day”, “Several times a week”, ”Once a week”, “Once a month” and “Less or never” to “Once a week or less” and “More than once a week”.
The testing of hypotheses four through ten required the merging of individual variables to new ones. For example, H4 states that a high expectation of incentives will influence the acceptance in a positive way. In order to measure the expectation of incentives, participants were given three different statements and asked to state their level of approval. The statements were:
- PE01_02: I would expect location-based advertising to provide useful product recommendations.
- PE01_03: I would expect location-based advertising to provide vouchers for shops I like.
- PE01_04: I would expect location-based advertising to provide discounts for shops I like.
The three original variables were used to derive the new variable ‘Expected_Incentives_Average’ by calculating the mean value.
Expected_Incentives_Average = (PE01_02 + PE01_03 + PE01_04) / 3
The scale used in the questionnaire was a 5-point Likert-type scale, so the results for each statement can vary from 1 to 5 with increasing level of expectation. This also applies for the new variable, which was then used for further research.
The variables required in order to test H5 through H10 were calculated accordingly (for details, see Appendix 0).
3.2 Development of multiple linear regression model
Before testing the influence of various predictors of the criterion, a closer look was taken at the criterion itself. To rule out the risk of having a homogenous set of answers, simple frequency analyses was conducted for Acceptance_LBA as well as for Acceptance_LBA_Beacon.
Figure 2: Frequency statistics of the criterions
Both variables represented results within the whole range of the scale, thus a sufficient heterogeneous picture (see Appendix 0). Furthermore, it was observed that in both cases the mean and median were quite close together (Acceptance_LBA: Mean = 2.6, Median = 2.5; Acceptance_LBA_Beacon: Mean = 2.8, Median = 3.0) which is a positive sign for a sufficient normal distribution of residuals in order to use the variable in a linear regression model. In contrast, the predictors SmartphoneUsage and ShoppingFrequency both showed quite homogenous distributions, which is why they were dichotomized, each with just two possible characteristics (see also chapter 3.1).
To test the proposed hypotheses, two multiple linear regression models have been calculated - one model to test the hypotheses in regards to location-based advertising in general and a second one to test the hypotheses in regards to location-based advertising inside closed buildings with the help of Beacon technology. As a result of a disadvantageous set up during survey preparation, the collected data on the factors ‘Search Location’ and ‘Social Norm’ could not be incorporated into the regression models (see 5.3 Limitations for details). For this reason, both models operate with eight instead of ten independent predictors and one dependent variable. Hence the hypothesis H2 regarding the search location as well as the hypothesis H8 regarding the social norm could not be tested.
In order to perform a multiple linear regression model, certain conditions need to be verified in advance.
1. Additivity and linearity 2. Independent residuals
3. Homogeneity of variance (or homoscedasticity of variance) 4. Normally distributed residuals
5. No multicollinearities between the independent variables
Additivity and linearity
The regression model is a linear model, used to explain linear relations between variables. The regression model follows the equation:
𝑦𝑖 = 𝑏0+ 𝑏1 × 𝑥1+ 𝑏2 × 𝑥2+ . .. +𝑏𝑛 × 𝑥𝑛 𝑦𝑖 = 𝑐𝑟𝑖𝑡𝑒𝑟𝑖𝑜𝑛, 𝑑𝑒𝑝𝑒𝑛𝑑𝑒𝑛𝑡 𝑣𝑎𝑟𝑖𝑎𝑏𝑙𝑒 𝑏0 = 𝑐𝑜𝑛𝑠𝑡𝑎𝑛𝑡 𝑥1− 𝑥𝑛 = 𝑝𝑟𝑒𝑑𝑖𝑐𝑡𝑜𝑟𝑠 𝑏1− 𝑏𝑛 = 𝑟𝑒𝑠𝑝𝑒𝑐𝑡𝑖𝑣𝑒 𝑖𝑛𝑓𝑙𝑢𝑒𝑛𝑐𝑒 𝑜𝑓 𝑝𝑟𝑒𝑑𝑖𝑐𝑡𝑜𝑟
This equation assumes additivity of the predictors, so every predictor in the equation contributes to the explanation of the variance of the criterion.
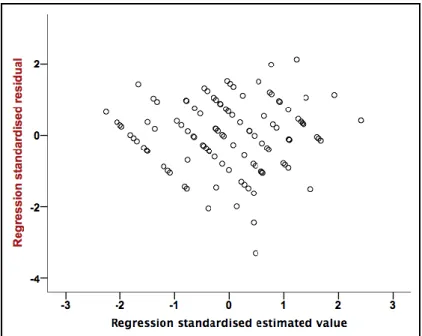
Linearity between the predictors and the criterion needs to be validated before the regression model can be utilized. Linear relations between variables can be identified by analyzing the scatterplot of the model (see Figure 3). In case the linearity were violated, the scatterplot would show a recognizable pattern, most likely an inverted U. As the scatterplot of the regression model for LBA in general is inconspicuous and shows a mixed point cloud without recognizable clusters or patterns, there is no reason to assume the linearity of the model would be violated. Analysis of the second model for LBA inside shops or malls produced the same result (see Appendix 0).
Figure 3: Scatterplot for the regression model with LBA in general
Independent residuals
Another important condition is that every answer in the dataset is independent from the other answers. Logically this is a given as the participants answered the questionnaire on their own and were not influenced by other participants. To prove this condition, a Durbin-Watson Test for the independence of residuals was conducted and expected to return a value between 1.5 and 2.5 (Field, 2013) in order to prove independence. A smaller value than 1.5 would indicate a positive correlation between the residuals. A higher value than 2.5 would indicate a negative correlation. Both regression models, Acceptance of LBA in general as well as acceptance of LBA inside shops or malls, showed a Durbin-Watson Value close to 2 (Durbin-Watson LBA: 2.056; Durbin-Watson LBA_Beacon: 2.206), which proves the independence of residuals within the used test group (see Appendix 0).
Homogeneity of variance (or homoscedasticity of variance)
Homoscedasticity means that the error term, which disturbs the relation between the dependent and the independent variable, remains the same across all values of the independent variable. This means if the criterions value is high or low, the distribution of errors should remain the same. To validate this condition, again the scatterplot of the model was analyzed. In case of heteroscedasticity, the scatterplot would show a more or less obvious pattern in the form of a funnel with a higher variance of errors on one side. As the scatterplots
of both models are in inconspicuous without noticeable patterns, there is no reason to assume that homoscedasticity of the model would be violated.
Normally distributed residuals
A closer look at the regression of the standardized residual shows that it almost follows a normal distribution. This condition is important to prove that deviations from the model are random and not systematic or caused by a measurement mistake. By comparing the standardized residual from the regression model with LBA in general as criterion and the one from the regression model with LBA inside shops or malls as criterion, it can be seen that LBA in general comes closer to a normal distribution. In both models, the residuals are sufficiently normally distributed to meet the preconditions to use the regression model (see Appendix 0).
No multicollinearities between the independent variables
To detect multicollinearities between the independent variables of a model, the Variance Inflation Factor is used. The VIF is a means used to ensure that not two or more independent variables explain the same variance of the dependent variable. According to (Field, 2013), there is no problem with multicolliniearities to be expected with a VIF smaller than five. All VIF values for both models showed factors significantly smaller than five; therefore multicollinearity was not evident (see appendix 0).
4 Results
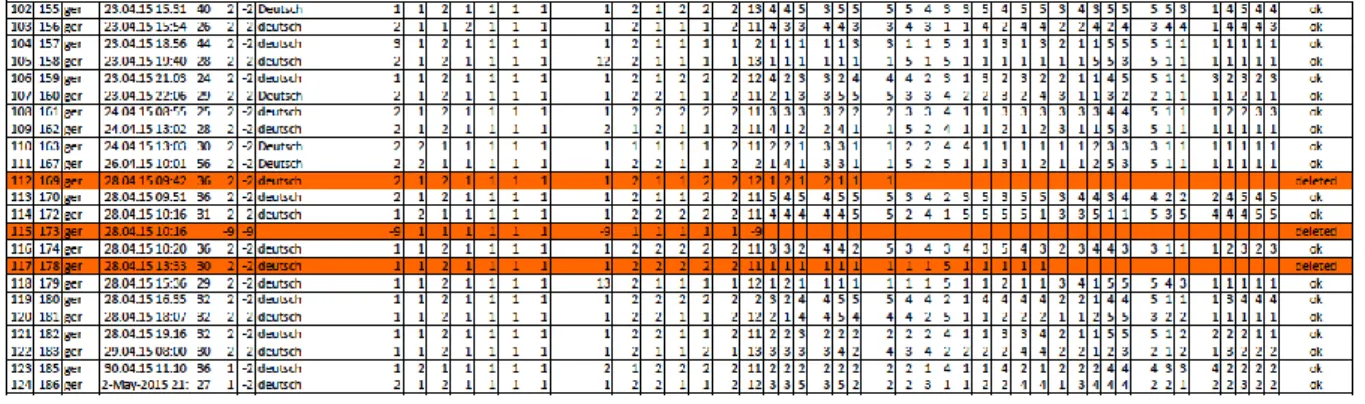
When the survey was closed on the 5th May, it had 124 responses. From these responses, fifteen were not valid because the interviewee dropped out of the survey before completing it. Particularly if the important last questions regarding the usage intention were not answered, the dataset was deemed useless for research purposes. Refer to the Appendix for more details on the collected and eliminated datasets. After elimination of invalid datasets, 109 valid responses could be used for research.
4.1 Sample group analysis
The sample group consisted of 109 valid respondents (n=109) ranging in age from 20 to 56 with a mean average at 28,8 years.
Figure 4: Distribution of participants' age groups
Participants were asked for their age in an open question, to which any numeric answer would be accepted. For further analysis, the results were grouped within SPSS into the following age groups: ’20-25 years’, ‘26-30 years’ as well as ’31 years and older’. Figure 4 shows the distribution of participants within these groups. Almost half of the participants of the study fall in the age group 26-30 which can be explained by the fact that the survey was answered predominantly by students.