Research Article
The Pricing of Portuguese Privatisation
Second Initial Public Offerings
Rui Alpalhão
Department of Finance, ISCTE Business School, Avenida das Forc¸as Armadas, 1649-026 Lisbon, Portugal Correspondence should be addressed to Rui Alpalh˜ao; [email protected]
Received 8 October 2013; Accepted 1 April 2014; Published 21 May 2014 Academic Editors: L. Grilli, D. Pick, A. Rodriguez-Alvarez, and J. Zarnikau
Copyright © 2014 Rui Alpalh˜ao. This is an open access article distributed under the Creative Commons Attribution License, which permits unrestricted use, distribution, and reproduction in any medium, provided the original work is properly cited.
The paper studies the pricing of PSIPOs (privatization second initial public offerings) PIPOs of companies that had been public in the past. A dataset comprising all the Portuguese companies nationalized in 1975 and privatized in the late eighties and nineties is used. Findings on short- and long-run pricing of IPOs and PIPOs are summarized, and implications for the pricing of PSIPOs are discussed. Short- and long-run returns are computed, using three alternative methods (buy and hold abnormal returns, wealth relatives, and cumulative abnormal returns) in the long-run analysis. Short-run overpricing is identified, unlike the underpricing pattern revealed by most IPO research. This initial overpricing is essentially found to be corrected in the first trading month. In the long-run, no evidence of overpricing is found, again unlike the usual conclusion of the IPO literature, and more in line with empirical evidence on second IPOs. Results provide support to the conclusion that privatization IPOs tend to be less underpriced than standard IPOs and that firms coming back to the market for a second IPO tend to be less underpriced than pure IPOs and provide a good rating for the performance of the Portuguese Republic pricing stocks in the Portuguese privatization program.
1. Introduction
Initial public offerings (IPOs) are the first public offering of shares by a company. Although an IPO occurs, by definition, once in the life cycle of a company, it is possible that a firm reenters the public equity markets after an IPO and a subsequent delisting. In these cases, a “second” IPO takes place, termed a SIPO (second initial public offering). The privatization wave that swept the financial markets from the seventies on created a special category of IPO, the PIPO (pri-vatization initial public offerings), IPOs where the offering firm is held by the State. Since privatized firms through PIPOs were, in some cases, listed firms when their nationalization took place, their PIPOs were, in reality, second IPOs. This paper studies the price performance of these twice special offerings, privatization second initial public offerings, or PSI-POs. Organization is as follows:Section 2covers short-run underpricing,Section 3discusses long-run returns,Section 4 addresses methodology, results are presented in Section 5, andSection 6concludes.
2. Short-Run IPO and PIPO Underpricing
It is a well-established fact that IPOs are underpriced; that is, that a wealth transfer from original shareholders to new shareholders occurs when a firm’s shares are offered to the public for the first time. This underpricing is a function of the offering price. By definition, a firm going public is previously unlisted, so its pre-IPO market price (𝑃𝑗0∗) is unknown. Nevertheless, it can be inferred from the initial market price (𝑃𝑗1) through𝑃∗
𝑗0=
𝑃𝑗1𝑁𝑗1− 𝑃𝑗 IPO(𝑁𝑗1− 𝑁𝑗0)
𝑁𝑗0 , (1)
where 𝑁𝑗1 and 𝑁𝑗0 represent, respectively, the number of shares outstanding before and after the IPO (if no shares are issued in the IPO, then 𝑁𝑗1 = 𝑁𝑗0 and 𝑃𝑗0∗ = 𝑃𝑗1)
and𝑃𝑗 IPOis the IPO price. If the original shareholders place
shares at a price below𝑃𝑗0∗, wealth is transferred to the new
Volume 2014, Article ID 652712, 13 pages http://dx.doi.org/10.1155/2014/652712
shareholders, granting them abnormal returns which, from the old shareholders’ point of view, are an additional cost of going public.
Several empirical studies, carried out in different markets and within various institutional frames, point to the fact that these implicit costs of going public are significant (Ritter [1] for the United States, Dawson [2] for Malaysia, Alpalh˜ao [3], Vieira and Serra [4], Almeida and Duque [5], and Borges [6] for Portugal, Husson and Jacquillat [7] for France, Koh and Walter [8] for Singapore, Wethyavivorn and Koo-Smith [9] for Thailand, McGuiness [10] for Hong Kong, Kunz and Aggarwal [11] and Drobetz et al. [12] for Switzerland, Levis [13] for the United Kingdom, Rydqvist and H¨ogholm [14] for Sweden, Lee et al. [15] for Australia, Krishnamurti and Kumar [16] for India, Engelen [17] for Belgium, ´Alvarez and Gonz´alez [18] for Spain, G¨unther and Rummer [19] for Germany, Aggarwal et al. [20] for Brazil, Chile, and Mexico, Loughran et al. [21] for a 25-country sample).
This generalized empirical evidence of underpricing is confirmed by the analysis of PIPO (Jenkinson and Mayer [22] for the United Kingdom and France, Menyah and Paudyal [23] for the United Kingdom, Paudyal et al. [24] for Malaysia, Su and Fleisher [25] for China, Jelic and Briston [26, 27] for Hungary and Poland, respectively, Jelic et al. [28] for Poland, Almeida and Duque [5] and Vieira and Serra [4] for Portugal, Omran [29] for Egypt, and Perotti and Guney [30], Dewenter and Malatesta [31], Choi and Nam [32], Jones et al. [33], Ljungqvist et al. [34], and Huang and Levich [35] for multicountry samples).
All these authors suggest, more or less assertively, that PIPO initial underpricing tends to exceed IPO underpricing. Some of these papers explicitly test and confirm this relation, namely, Jenkinson and Mayer [22], Menyah and Paudyal [23], Choi and Nam [32], Ljungqvist et al. [34], and Almeida and Duque [5]. On the contrary, both the papers on Poland of Aussenegg [36] and Jelic et al. [28] as well as the multicountry studies of Dewenter and Malatesta [31], Choi and Nam [32], and Huang and Levich [35] do not report significant differences. With the opposite findings, for example, lower PIPO underpricing relatively to IPO underpricing, one finds only the Vieira and Serra [4] results for Portugal.
Regarding SIPO samples, Muscarella and Vetsuypens [37] who have coined the acronym identify underpricing in their American sample, although significantly below the one posted by an IPO control sample. Derrien and Kecsk´es [38] find similar results in their sample of British IPO that were, before their so-called “initial” offer, the subject of an introduction to the public equity market. In their 119 AIM-listed company sample, Derrien and Kecsk´es [38] find underpricing for these quasi-initial offerings 10% to 33% below the one found in a “pure” IPO control sample.
Summing up, we have empirical evidence pointing to underpricing in IPOs generally speaking, larger underpric-ing in PIPOs than in IPOs unrelated to privatization pro-grammes, and smaller underpricing in SIPOs than in truly initial IPOs.
Theories accounting for the generalized presence of underpricing are widely surveyed in the literature; Ljungqvist [39] is a very useful summary. The specific case of PIPO has
received less attention. Nevertheless, Perotti [40] and, before, B¨os [41] presented asymmetric information models (building on earlier research on IPO underpricing along the same lines, e.g., Allen and Faulhaber [42], Grinblatt and Hwang [43], and Welch [44]) in which the issuing State has an informational advantage over investors, as well as (contrary to what happens with corporate issuers in IPOs) the ability to transfer wealth from the to-be shareholders through policy decisions (e.g., regulation, barriers to entry, and taxation). In Perotti [40], the States signal their commitment to refrain from wealth trans-fers detrimental to postoffering shareholders by retaining a shareholding in the privatized company and by underpricing. Generally speaking, one would expect to find, in asymmetric information models, underpricing varying with uncertainty over the offering. This being the case, and given that PIPOs are offerings of more mature companies than IPOs, a lower underpricing in PIPOs relatively to IPOs should be expected. Nevertheless, given the emerging nature of most of the capital markets in economies where privatizations are in the agenda, the hypothesis that potential PIPO underpricing in emerging markets should be lower than IPO underpricing in emerging markets but higher than IPO underpricing in mature markets should not be discarded. Biais and Perotti [45] offer a different rationale for this apparent paradox, cunningly named “Machiavellian privatization,” after the Italian Renaissance diplomat and writer Niccol`o Machiavelli. In this model, the underpricing’s rationale is the wish by right-wing governments to incentivize middle class voters to become shareholders and consequently align their interests with those of higher-income voters thus deepening support base and increasing reelection chances. In this mind frame, the issuing Government does not assess underpricing as a financially-minded corporate issuer would, but rather as a vote raising vehicle. Consequently, highly underpriced privatizations will be successes from the relevant point of view, even if far from revenue-maximizing.
Also relevant is the fact that the several goals, both economic and political, usually linked to privatization pro-grammes give to policy-makers incentives to underprice which are significantly higher than the ones faced by a corporate issuer: underpricing can trigger popular support for a broad privatization programme, and underpricing helps popular capitalism. Given the fact that a Government pursuing a privatization programme will be a frequent issuer, unlike a corporation which taps the IPO market only once, Governments’ investment in reputation built through under-pricing tends to be more valuable and thus generates a greater appetite for underpricing.
Size of stock markets also matters. Frequently, privatiza-tion programmes are carried out in small, emerging markets. As the privatized companies are frequently the biggest in their home markets (Boutchkova and Megginson [46]), weak demands in small markets can trigger higher underpricing to allow the successful placing of relatively large offers, as is typically the case of a PIPO.
Jones et al. [33] offer an alternative explanation, suggest-ing that Governments deliberately underprice PIPO more than corporate issuer underprice their IPOs to bring the fees paid to book runners down, to compensate for the fact that
they will hire them much more frequently than a corporate issuer.
For SIPOs in general, information asymmetry models should predict lower underpricing than for IPOs, since the previous track record of the company in the market should drive uncertainty down. This being the case, expected underpricing in PSIPOs should be lower than the ones posted by PIPOs.
The Portuguese IPO initial returns have been docu-mented in previous research. Alpalh˜ao [3], using a sample of 62 IPO, all of private issuers and all marketed in 1986 and 1987, that is, before the privatization program and during the only Portuguese IPO wave worthy of the name, reports a 54.4% initial return. Almeida and Duque [5] and Vieira and Serra [4] use samples collected after the start of the privatization program and comprising both PIPO (most of which PSIPO) and IPO launched by private issuers (the Vieira and Serra [4] sample also includes secondary offerings by privatized firms). A brief description of these papers’ approaches is inTable 1.
Almeida and Duque [5] study a sample of 21 IPO mar-keted between 1992 and 1998, among which 11 PIPO, of which 9 PSIPO, and report initial returns between 4.74% (with equal weights (as in Alpalh˜ao [3]) and 18.70% (value weighted). All PSIPO are part of our sample (Bonanc¸a, Mundial-Confianc¸a, Imp´erio, Cr´edito Predial Portuguˆes, Uni˜ao de Bancos Portugueses, in this case after the rebranding to Banco Mello following the takeover by Jos´e de Mello, Cimpor, Banco de Fomento e Exterior, Portucel Industrial and EDP). The two PIPO which are not PSIPO included are Portugal Telecom and Brisa. Portugal Telecom is a special case, because it absorbed one of the few firms which maintained a listing before and after the Exchange closure in 1974, R´adio Marconi, and thus had a part of its assets listed since the market reopened, in 1976. Brisa was, initially, a firm owned by private shareholders, founded by banker Jorge de Brito, the controlling shareholder of Banco Intercontinental Portuguˆes, after whom the firm was named (Brito, SA) but was never listed before the IPO.
The Almeida and Duque [5] initial returns are substan-tially below the ones reported by Alpalh˜ao [3], which is hardly surprising, given the market development and sophistication which occurred in the meantime, and specially the shortening of the interval between an initial public offer and the start of trading in the Exchange. The fall in underpricing relatively to the eighties IPO wave is confirmed by the underpricing found by the private issuer backed offers (13.33% with equal weights and 16.95% with value weights), but the relation between PIPO and IPO is ambiguous, since the PIPO initial returns are higher only with value weights.
Vieira and Serra [4] study 19 PIPO and report abnormal initial returns of 3.38%, statistically different from zero. The PIPO underpricing is found to be lower than contemporane-ous IPO underpricing.
3. Long-Run Returns
It is well established in the literature that the generally applicable initial underpricing is reverted in the long-run
in a similarly general way (Shaw [47] for Canada, Ritter [48] and, more recently, Carter et al. [49] for the United States, Keloharju [50] for Finland, Levis [51] for the United Kingdom, McGuiness [10] for Hong Kong, Lee et al. [15] for Australia, Kunz and Aggarwal [11] for Switzerland, Ljungqvist [52] for Germany, Cai and Wei [53] for Japan, Marisetty and Subrahmanyam [54] for India, Aggarwal et al. [20] for Brasil, Chile, and M´exico). Posting dissenting conclusions, we find Kim et al. [55] for Korea, Brav and Gompers [56] and Gompers and Lerner [57] for the United States, and Degeorge and Derrien [58] for France. Stehle et al. [59], in their research of German IPO, Almeida and Duque [5] and Vieira and Serra [4] for Portugal, Aussenegg [36] for Poland, and Drobetz et al. [12] for Switzerland find long-run abnormal returns not significantly different from zero.
This pattern is not reported in most studies of PIPO buy-and-hold strategies (Levis [51] and Menyah et al. [60] for the United Kingdom, Jelic and Briston [26] for Hungary, Paudyal et al. [24] for Malaysia, Boardman and Laurin [61], Foerster and Karolyi [62], Dewenter and Malatesta [31], Perotti and Oijen [63], and Megginson et al. [64] for multicountry samples). With opposite results, and thus in line with IPO empirical evidence, we find Aggarwal et al. [20] for Chile, although with a sample of only 9 PIPO, Almeida and Duque [5] and Vieira and Serra [4] for Portugal, B¨ulent Aybar [65] for a multinational sample of American Depositary Receipts, Omran [29] for Egypt, and Choi et al. [66] for a multinational sample and using size-matched benchmarks.
The available SIPO research (Degeorge and Zeckhauser [67], Mian and Rosenfeld [68], and Holthausen and Larcker [69]) does not find the long-run overpricing pattern reported for IPO, and Mian and Rosenfeld [68], with an American sample from 1983 and 1988, even find positive and significant, abnormal returns.
To the best of our knowledge, no PSIPO research was ever produced (although the Almeida and Duque [5] and Vieira and Serra [4] samples also include PSIPOs). However, both the IPO empirical evidence and the SIPO literature point to the prevalence of positive abnormal returns.
Theories offering explanations for the generally found initial underpricing cannot account for the generally found long-run overpricing. The signalling theories would even point in the opposite direction. Although before Ritter [48] long-run overpricing was essentially absent from the litera-ture, Miller [70] offered an interesting rationale, dropping the standard asset pricing assumption of homogeneous expecta-tions. Without such homogeneous expectations and taking into account the usually small size of an IPO, a relatively small number of investors (the ones most bullish about the offer) will be enough to have the shares placed, making the initial price hardly an unbiased estimator of all publicly available information. The initial market price will, on the contrary, tend to be the most optimistic investors’ appraisal, and these will tend to pump the prices up in the initial trades. As the divergence of opinion washes out, starting from the high levels registered after the start of trading, prices will tend to drop, even if the average investor’s target price remains constant.
Table 1: Portuguese IPO research.
Period Borges [6] Almeida and Duque [5] Vieira and Serra [4] Alpalh˜ao [3]
1987–2004 1992–1998 1989–2001 1986-1987
Offer category
57 IPO in 1987, 43 after 1987, the former either with the State or private shareholders as issuers, including Portugal Telecom, notwithstanding the Companhia Portuguesa R´adio Marconi previous listing
All IPO listed in the Lisbon Official Market, either with the State or private shareholders as issuers, including Portugal Telecom
All privatizations, both primary and secondary offers, including Portugal Telecom
All IPO
Sample size 100 (19 PIPO) 21 (11 PIPO) 42 (19 PIPO) 62 (0 PIPO)
Time frame 1 day, 36 months 1 year (247 days) 1, 7, 30 days; 6, 12, 18, 24, 30, and
36 months 30 days
Return definition Daily, log Daily, log Daily, log Daily, level
Performance
measure CAR CAR, WR CAR CAR
Benchmark index BTA (1987), PSI Geral (1988 on) PSI Geral PSI Geral, S&P500 BTA
Weightings EW EW, VW (weights formed with
initial prices) EW EW
This table summarizes the results of Portuguese IPO research. IPO stands for initial public offers. PIPO means initial public offers which are privatizations. CAR are cumulative abnormal returns, with the market proxied by the benchmark index. WR means wealth relatives. EW means equal weights for each security and VW weights given by the initial prices of the shares offered in IPO.
Miller [70] does not claim that investors behave irra-tionally, only that their rational opinions diverge. Aggarwal and Rivoli [71] go farther, assuming that IPO investors might show, at least from time to time (Loughran et al. [21] would later term these times “windows of opportunity” for issuers) a tendency to overprice in the first trading days out of simple thoughtlessness. The long-term effects of such behaviour should not be significantly different from those implied by Miller [70]. Schultz [72] showed that, due to what he terms pseudo market timing meaning that companies tend to go ahead with their IPOs following high market prices (which is confirmed, e.g, by Pagano et al. [73] for Italy and by Loughran et al. [21] for 14 out of 15 countries included in their multicountry sample), the long-run IPO underperformance, if measured in event time, occurs even if issuers are unable to foresee future returns or identify “windows of opportunity”.
To the best of our knowledge, the higher sustainability of the prices of privatization offers and of “second” initial offers has not generated rationalizations in the literature. However, the history of “second” initial offers, however remote in time, does suggest, at least, a lower divergence of opinion and, thus, a smaller reversion of returns as time goes by.
4. Methodology
4.1. Initial Returns. Alpalh˜ao and Alves [74] show that
the Portuguese PSIPOs have been floated at prices which implicitly show a return during the years between delisting and relisting significantly below the public market equivalent return. Analysis of the PSIPO initial market returns is required to shed light on the sustainability of privatization offer prices. To do so, we compute returns 𝑅𝑗𝑑 for every 𝑗 company relatively to each of the first trading days following the PSIPO(𝑑 = 1, 2, . . . , 20). We define 𝑑 = 1 as the initial
return, computed as the buy and hold return from the offer price to the first trading day closing price:
𝑅𝑗1= 𝑃𝑗1𝑃− 𝑃𝑗0
𝑗0 , (2)
where 𝑃𝑗0 is the 𝑗th firm PSIPO price and 𝑃𝑗1 is the first trading day closing price for the same firm.
For𝑑 = 2, . . . , 20,
𝑅𝑗𝑑= 𝑃𝑗𝑑− 𝑃𝑗𝑑−1
𝑃𝑗𝑑−1 . (3)
Taking the average of𝑁 PSIPO, we define the portfolio average return as
𝑅𝑃𝑑= ∑
𝑁
𝑛−1𝑅𝑗𝑑
𝑁 . (4)
We define the cumulative returns between day 1 and day 𝑠 (𝑠 = 1, . . . , 20) as the sum of average returns:
𝑅𝑃𝐶𝑠=∑𝑠
𝑑=1
𝑅𝑃𝑑. (5)
We defer a discussion of the methodology for cumulating returns to the next section, since the short twenty-day horizon under analysis is adequately treated without need for more elaborate techniques.
We also define initial abnormal return, AR𝑗1, as
AR𝑗1= 𝑅𝑗1− 𝑅𝑗Ψ, (6) where𝑅𝑗Ψis the return on the market portfolio, proxied by the PSI Geral index:
𝑅𝑗Ψ= Ψ𝑗1Ψ− Ψ𝑗0
where Ψ𝑗1 is the value of the PSI Geral index for the first trading day of the𝑗th PSIPO and Ψ𝑗0is the value of the same index on the𝑗th PSIPO day.
For𝑑 = 2, . . . , 20,
𝑅Ψ𝑑= Ψ𝑑− Ψ𝑑−1
Ψ𝑑−1 . (8)
The average return of an equally weighted 𝑁 PSIPO portfolio, for𝑑 = 1, . . . , 20, is given by
AR𝑑= ∑
𝑁
𝑛=1AR𝑗𝑑
𝑁 . (9)
Finally, and as done with the gross returns, we define cumulative abnormal returns between day 1 and day𝑠 as the sum of average abnormal returns:
CAR𝑠=
𝑠
∑
𝑑=1
AR𝑑. (10)
For each security, the corresponding abnormal return is CAR𝑗𝑠=
𝑠
∑
𝑑=1
AR𝑗𝑑. (11)
To test the null hypothesis of zero CAR, we use the parametric test statistic (on the properties of this test statistic, see Kothari and Warner [75]):
𝑡CAR,𝑠= CAR𝑗𝑠
𝜎 (CAR𝑗𝑠) /√𝑁
, (12)
where CAR𝑗𝑠is the sample mean and𝜎(CAR𝑗𝑠) is the sample standard deviation of abnormal returns.
4.2. Long-Run Returns. The literature (Barber and Lyon [76],
Kothari and Warner [77], and Lyon et al. [78]) makes available several alternative methods for the quantification of long-run returns, namely, buy and hold abnormal returns, wealth relatives, and cumulative abnormal returns, briefly described in the following sections.
4.2.1. Buy and Hold Abnormal Returns. One alternative,
preferred by Barber and Lyon [76] and Lyon et al. [78] is the so-called buy and hold abnormal returns, BHAR for short, consisting in the capitalization of period (usually monthly) returns, from which returns earned on a bench-mark portfolio, or on a control sample, chosen on the back of attributes (e.g., size, industry) of the stocks under analysis, are subtracted.
The daily returns of the𝑗th PSIPO are defined as 𝑅𝑗𝑑= 𝑃𝑗𝑑𝑃− 𝑃𝑗𝑑−1
𝑗𝑑−1 , (13)
where 𝑃𝑗𝑑 is the closing price of stock 𝑗 on 𝑑 day. The corresponding return on month𝑚 (with 𝑘 trading days and
calculating monthly returns from monthly close prices) is similarly defined as
𝑅𝑗𝑚=∏𝑘
𝑑=1
(1 + 𝑅𝑗𝑑) − 1. (14) We continue to use the PSI Geral index as our benchmark portfolio, like we did when computing initial returns. Alter-natives such as size-matching methods (as in, e.g., Loughran and Ritter [79]) are infeasible, taking into account the small size and lack of industrial diversity of the Portuguese Exchange, abundantly clear in the impossibility of finding a company of similar size to EDP (even with the standard convention of identical two-digit industry code and asset value with difference below 30%). Fortunately, these methods are also less relevant in the Portuguese case, given that their relative advantage comes from the fact that the initial offers are usually small, unlike the members of blue chip indices, which does not apply to PSIPO. On the other hand, what Barber and Lyon [76] and Lyon et al. [78] call new listing bias is particularly relevant in the Portuguese case, because the privatized companies are part of the benchmark portfolio and have significant weightings in it.
The PSI Geral daily return is defined as 𝑅𝜓𝑑= Ψ𝑑− Ψ𝑑−1
Ψ𝑑−1 , (15)
whereΨ𝑑designates the PSI Geral value on the𝑑th day. Like in (14), we define the monthly return on the bench-mark portfolio as
𝑅𝜓𝑚=∏𝑘
𝑑=1
(1 + 𝑅𝜓𝑑) − 1. (16) When delisting generates absence of data for one of the sample constituents, we follow Gompers and Lerner [57], making both the missing stock return and the benchmark portfolio return equal to zero. The alternative—truncate the sample—would be feasible but would not deliver the average return earned by an investor carrying out an executable trading strategy, because the use of the proceeds from the delisting of the stocks taken private would remain undefined. Each month𝑚’s average return, 𝑅𝑚, is obtained by taking the average of the various stocks:
𝑅𝑚= 𝑁1 ∑𝑁
𝑛=1𝑅𝑗𝑚,
(17) where𝑁 is the sample size.
A security’s return over an𝑀-month period is given by BHR𝑗𝑀=
min(𝑀,𝑠)
∏
𝑚=1
(1 + 𝑅𝑗𝑚) − 1, (18) where𝑠 stands for the month in which a security eventually ceases trading. This statistic measures the total return deliv-ered by a strategy in which a stock is held for𝑀 months, or,
in case the stock ceases trading before, until its exit from the market. The portfolio mean return is given by
BHR𝑀= 1 𝑁 𝑁 ∑ 𝑗=1 BHR𝑗𝑀. (19)
The buy and hold return in our benchmark portfolio for the period𝑀 is similarly defined as
BHR𝜓𝑀=
min(𝑀,𝑠)
∏
𝑚=1
(1 + 𝑅𝜓𝑚) − 1. (20) With reference to BHRΨ𝑚, we can compute each security’s BHAR, defined as
BHAR𝑗𝑀= BHR𝑗𝑀− BHR𝜓𝑀. (21) The portfolio mean return for the homologous period is
BHAR𝑀= 1 𝑁 𝑁 ∑ 𝑗=1 BHAR𝑗𝑀. (22)
To test the hypothesis of zero BHAR in an 𝑁-stock sample, we use the parametric test statistic:
𝑡BHAR=
BHAR𝑗𝑀 𝜎 (BHAR𝑗𝑀) /√𝑁
, (23)
where BHAR𝑗𝑀is the sample mean and𝜎(BHAR𝑗𝑀) is the abnormal returns sample standard deviation.
4.2.2. Wealth Relatives. Ritter [48] introduced wealth
rela-tives as a method to interpret and adjust buy and hold returns. Wealth relatives are defined as
WR𝑀= 1 + BHR𝑀
1 + BHR𝜓𝑀. (24)
A WR above one indicates outperformance, whilst a WR below one means underperformance.
Fama [80] sees WR as more appropriate for the measure-ment of long-run returns than BHAR, due to the treatmeasure-ment given to the cumulation of returns (Fama [80] illustrates this point with a simple, yet clear, example, assuming, for the sake of simplicity, a single stock; imagine that, during the first year, its price increases by 10%, while the benchmark portfolio produces zero return. In the four following years, both the stock and the benchmark portfolio increase by 100%. The 5-year BHAR will be 20% (= 1.1× 2 − 1.0 × 2), while the WR will produce a truthful outperformance of 10% (1.1× 2 ÷ 1.0 × 2)).
4.2.3. Cumulative Abnormal Returns. The most common
alternative to BHAR is the cumulative abnormal returns (CAR) preferred by Fama [80] and Mitchell and Stafford [81]. The choice of one method over the other, taking into consideration their respective pros and cons, is usually based
on the assumed trading strategy and on the hypothesis meant to be tested. Specifically, a 12-month CAR allows testing if the abnormal monthly return of the sample companies for the year under appreciation is equal to zero, while annual BHAR allow testing if the annual mean abnormal return is equal to zero. On other words, CAR ignore the capitalization of returns, while BHAR include this factor.
We define the abnormal returns of the𝑗th offering, always relatively to PSI Geral, for the𝑚 month as
AR𝑗𝑚= 𝑅𝑗𝑚− 𝑅Ψ𝑚. (25)
For the portfolio of 𝑁 shares, the adjusted return for month𝑚 is the arithmetic mean of the adjusted returns for the relevant month:
AR𝑚= 1 𝑁 𝑁 ∑ 𝑗=1 AR𝑗𝑚. (26)
The abnormal cumulative returns from month 1 to month 𝑠 are the sum of the mean adjusted returns:
CAR𝑠=
𝑠
∑
𝑚=1
AR𝑚. (27)
For each security, the corresponding adjusted return is
CAR𝑗𝑠 =
𝑠
∑
𝑚=1
AR𝑗𝑚. (28)
As mentioned above, to test the null hypothesis of zero CAR, we use the parametric test statistic as follows:
𝑡CAR,𝑠= CAR𝑗𝑠
𝜎 (CAR𝑗𝑠) /√𝑁, (29)
where CAR𝑗𝑠is the sample mean and𝜎(CAR𝑗𝑠) is the sample standard deviation of the abnormal returns.
When a company is delisted before the end of the period, the next month’s portfolio return becomes the weighted aver-age return of the remaining shares; that is, monthly portfolio rebalancing applies, with the proceeds from delisting(s) being allocated to the surviving offerings (this restriction can, as previously stated, be lifted using the computation of buy and hold returns).
−40.0 −20.0 0.0 20.0 40.0 60.0 80.0 0 1 2 3 4 1989 1990 1991 1992 1993 1994 1995 1996 1997 Ret. PSI G. (%) # PSIPO
Figure 1: Time series of Portuguese PSIPO and annual returns of the PSI Geral index.
5. Results
5.1. Data and Sample Selection. The sample includes the 15
PSIPO made between 1989 and 1997 (Figure 1). From 1989 to 1995 offers took place in each and every year, and only twice (in 1993 and 1995) a single offer came to market. 1996 was the first PSIPOless year since the Portuguese privatization programme began, and 1997 saw the last PSIPO, with the EdP offer. After that, the Portuguese privatization programme comprised solely secondary offers of the large nonfinancial companies privatized in multiple stages. A significant relation between the number of PSIPO and the level of the market index is not visible, which suggests that analysing in event time is appropriate.
Given the time span covered, long-run performance is assessed over 12-, 36-, and 60-month intervals.
All companies in the sample have available aftermarkets of, at least, 12 months. The Banco de Fomento e Exterior return series is too short to allow the computation of 36-month returns (and, naturally, of 60-36-month returns), due to being taken private, after roughly 28 months in the market, following the acquisition offer placed by BPI in December 1996, after winning, in August 1996, the bid for the second stage of the Banco Fonsecas & Burnay privatization. This being the case, sample size drops to 14 for the 36-month time frame. Two additional offers—Bonanc¸a and UBP—produced return series of more than 36, but less than 60 months. Bonanc¸a, controlled by Banco Portuguˆes do Atlˆantico after its privatization, was taken private in 1995 following the 1995 bid for Atlˆantico by BCP and Imp´erio, which made its free float minuscule. UBP also exited the market in 1996, for the same reason and following the same bid, which eventually put the bank under the influence of Jos´e de Mello SGPS, parent company of Imp´erio. Sample size for the 60-month time frame is thus reduced to 12.
5.2. Initial Returns. Table 2shows the PSIPO portfolio initial
returns, both gross and abnormal. Its time series is shown in Figure 2.
Initial returns, both gross and abnormal, are similar and significantly different from zero for a 5% significance level
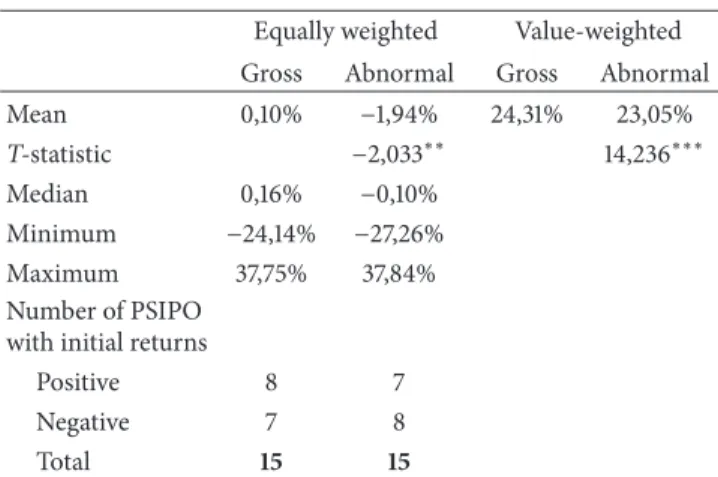
Table 2: Initial returns.
Equally weighted Value-weighted Gross Abnormal Gross Abnormal
Mean 0,10% −1,94% 24,31% 23,05% T-statistic −2,033∗∗ 14,236∗∗∗ Median 0,16% −0,10% Minimum −24,14% −27,26% Maximum 37,75% 37,84% Number of PSIPO with initial returns
Positive 8 7
Negative 7 8
Total 15 15
This table reports the fifteen privatization second initial public offerings (PSIPO) statistics. Asterisks show statistical significance:∗∗∗ shows differ-ence from zero with a 1% significance, and∗∗ shows difference from zero for a 5% significance level. Equally weightedshows means computed with equal weights; value-weighted shows means weighted by the value of the initial privatization offer. BTA J/89 Alian O/89 Cent N/90 BPA D/90Bona J/91 BES J/91M-C A/92 Imp ́e N/92 CPP D/92 UBP F/93 Cimp J/94 BPSM N/94 BFE D/94 Port J/95 EdP J/97 60.00 40.00 20.00 0.00 −40.00 −20.00 (%)
Figure 2: Initial abnormal returns (case by case, across time, 1989– 97).
when adjusted for market movement. They vary between a highly adverse for the investor minimum of −24.14% gross and −27.26% after adjustment in the UBP offer and a maximum of 37.75% gross and 37.84% adjusted in the EDP offer. The high weight of the EDP offer, given the high underpricing posted, causes significantly positive mean value-weighted initial returns. We do not, however, grant this weighted mean particular relevance, both because its value is attributable essentially to a single offer and because an analysis based on equal weights shows the results of a strategy of investing equal amounts in every privatization offer, which we find to be more realistic than a value-weighted investment strategy.
Our PSIPO sample produces results which are differ-ent from available PIPO studies, with statistically differdiffer-ent from zero overpricing. We fail to find evidence that the Portuguese Government behaved in a way consistent with the underpricing mode usually attributed to private issuers. Our results, although different from previous research results,
1.00 0.00 −9.00 −8.00 −7.00 −6.00 −5.00 −4.00 −3.00 −2.00 −1.00 1 2 3 4 5 6 7 8 9 10 11 12 13 14 15 16 17 18 19 20 (%) CAR CR
Figure 3: Short-run aftermarket of Portuguese PSIPO.
both Portuguese and international, are fully consistent with the expectation of lower PSIPO underpricing relative to PIPO underpricing and show that the negative return found for the investment in these companies while their capital remained private (Alpalh˜ao and Alves [74]) was partially reverted with the initial market valuation of the shares. The Portuguese State proved to be more efficient pricing the privatization offers (which were not undervalued) than managing the assets of the companies floated (task in which beating the target of beating the market benchmark was not attained).
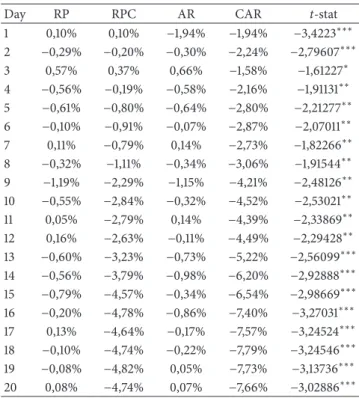
It is important to find out if this effect remained in the aftermarket.Figure 3posts the evolution of cumulative mean return in the first twenty trading days, both before and after adjustment for market movements. Data are inTable 3.
The pattern of cumulative returns is similar, both before and after adjustment for market movement. The peak is registered on the third day, following a correction of the initial return in the second trading day. Abnormal cumulative returns are never positive, and cumulative raw returns are positive on the first and third day only. Cumulative raw returns are not significantly different from zero, for a 5% significance level, on the third day only, and are statistically different from zero, for a 1% significance level, for every day from the 13th on.
One can conclude that the initial overpricing, while being moderately reversed immediately after the initial trades, is not reverted in aftermarket. The negative abnormal returns earned by the Republic during the years in which companies remained private were partially corrected during the initial market trades of the shares. Evidence thus exists of wealth transfers
(1) from all Portuguese citizens to investors in privatiza-tion offers and
(2) among secondary market investors, from the slower to buy PSIPO to the faster.
In absolute terms, the identified abnormal return is of −6.128.368.014$71, calculated applying to the Republic’s investment the average abnormal mean annual return of −28.25% for an average holding period of 19.4 years. This amount represents a wealth loss equivalent to 34.2% of the 1997 GDP, the process’s final year, or 5.1% of the cumulative
Table 3: Time series of short aftermarket returns.
Day RP RPC AR CAR t-stat
1 0,10% 0,10% −1,94% −1,94% −3,4223∗∗∗ 2 −0,29% −0,20% −0,30% −2,24% −2,79607∗∗∗ 3 0,57% 0,37% 0,66% −1,58% −1,61227∗ 4 −0,56% −0,19% −0,58% −2,16% −1,91131∗∗ 5 −0,61% −0,80% −0,64% −2,80% −2,21277∗∗ 6 −0,10% −0,91% −0,07% −2,87% −2,07011∗∗ 7 0,11% −0,79% 0,14% −2,73% −1,82266∗∗ 8 −0,32% −1,11% −0,34% −3,06% −1,91544∗∗ 9 −1,19% −2,29% −1,15% −4,21% −2,48126∗∗ 10 −0,55% −2,84% −0,32% −4,52% −2,53021∗∗ 11 0,05% −2,79% 0,14% −4,39% −2,33869∗∗ 12 0,16% −2,63% −0,11% −4,49% −2,29428∗∗ 13 −0,60% −3,23% −0,73% −5,22% −2,56099∗∗∗ 14 −0,56% −3,79% −0,98% −6,20% −2,92888∗∗∗ 15 −0,79% −4,57% −0,34% −6,54% −2,98669∗∗∗ 16 −0,20% −4,78% −0,86% −7,40% −3,27031∗∗∗ 17 0,13% −4,64% −0,17% −7,57% −3,24524∗∗∗ 18 −0,10% −4,74% −0,22% −7,79% −3,24546∗∗∗ 19 −0,08% −4,82% 0,05% −7,73% −3,13736∗∗∗ 20 0,08% −4,74% 0,07% −7,66% −3,02886∗∗∗ The table reports values of average return of EW PSIPO portfolio, gross (RP and RPC) and abnormal (AR and CAR), period (RP and AR) and cumulative (RPC and CAR), for days 1 to 20.∗∗∗, ∗∗, and ∗ denote, respectively, a return statistically different from zero for 1%, 5%, and 10% significance levels.
GDP from 1989 to 1997 or 140.7% of the proceeds of privatization offers between 1989 and 2003.
Alpalh˜ao [82] reports a wealth transfer from the share-holders of nationalized companies to all Portuguese citizens of 0.15% of the 1978 GDP. Our results documented a second wealth transfer, this one from all Portuguese citizens to share-holders of privatized companies, of 5.1% of the cumulative GDP from 1989 to 1997. On aggregate, the balance is frankly negative for the Portuguese citizens as a whole.
The investors who benefited from this wealth transfer saw their holdings loose value during the securities’ initial trades, making, in the short run, a PSIPO flipping strategy more profitable than a buy and hold strategy.
5.3. Long-Run Returns. The last section showed that the
behaviour of the stock prices of Portuguese reprivatized companies generated negative abnormal returns. This section extends the analysis’ time frame, to quantify possible wealth transfers between investors who purchased shares from the Republic in privatization offers and investors who, having been absent from the privatization offers, bought holdings in the privatized companies in the secondary market.
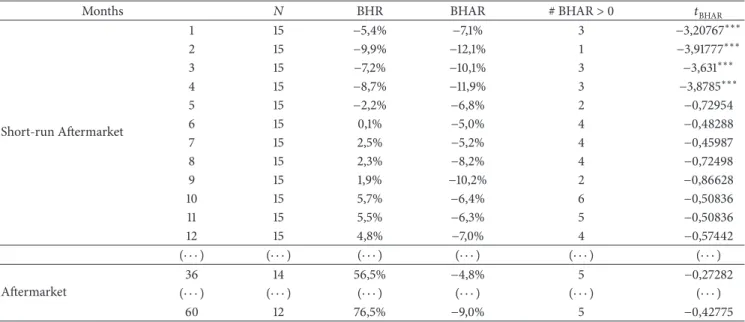
5.3.1. Buy and Hold Abnormal Returns. The sample’s BHR and
BHAR are posted inTable 4and depicted inFigure 4. We find negative and statistically different from zero returns in the first months, and we cannot reject, for a 10% significance level, the null hypothesis of zero returns from
Table 4: 1 to 12-, 36-, and 60-month BHR and BHAR.
Months 𝑁 BHR BHAR # BHAR> 0 𝑡BHAR
Short-run Aftermarket 1 15 −5,4% −7,1% 3 −3,20767∗∗∗ 2 15 −9,9% −12,1% 1 −3,91777∗∗∗ 3 15 −7,2% −10,1% 3 −3,631∗∗∗ 4 15 −8,7% −11,9% 3 −3,8785∗∗∗ 5 15 −2,2% −6,8% 2 −0,72954 6 15 0,1% −5,0% 4 −0,48288 7 15 2,5% −5,2% 4 −0,45987 8 15 2,3% −8,2% 4 −0,72498 9 15 1,9% −10,2% 2 −0,86628 10 15 5,7% −6,4% 6 −0,50836 11 15 5,5% −6,3% 5 −0,50836 12 15 4,8% −7,0% 4 −0,57442 (⋅ ⋅ ⋅ ) (⋅ ⋅ ⋅ ) (⋅ ⋅ ⋅ ) (⋅ ⋅ ⋅ ) (⋅ ⋅ ⋅ ) (⋅ ⋅ ⋅ ) Aftermarket 36 14 56,5% −4,8% 5 −0,27282 (⋅ ⋅ ⋅ ) (⋅ ⋅ ⋅ ) (⋅ ⋅ ⋅ ) (⋅ ⋅ ⋅ ) (⋅ ⋅ ⋅ ) (⋅ ⋅ ⋅ ) 60 12 76,5% −9,0% 5 −0,42775
The table reports returns earned with a buy and hold strategy of the equally weighted Portuguese PSIPO portfolio for 1 to 12, 36, and 60 months following the first (or only) public offer, both with (BHAR) and without (BHR) adjustment for market movements.∗∗∗, ∗∗, and ∗ denote, respectively, a return statistically different from zero for a significance level of 1%, 5%, and 10%.
−20.0 20.0 0.0 40.0 60.0 80.0 100.0 (%) 1 5 9 13 17 21 25 29 33 37 41 45 49 53 57 BHR BHAR
Figure 4: BHR and BHAR time series.
the 5th month on. The number of months with positive returns, with this methodology, is 13 (the 16th to the 19th, the 23th to the 28th, the 43rd, the 44th, and the 51th).
Figure 5 shows individual BHAR on the 60th month, organized by PSIPO date. The analysis of individual cases shows the scarcity of offers with very high abnormal returns and highlights the concentration of such offers in the early years of the privatization process. The two most successful cases on the long-run are shown to be one of the 1989 privatizations (Totta & Ac¸ores) and the Banco Portuguˆes do Atlˆantico offer, two years later. The two last offers (Portucel in 1995 and EDP in 1997) both post negative abnormal returns in this time frame.
The individual analysis of offers suggests interesting pat-terns, the small sample size notwithstanding. The statistically not different from zero portfolio BHAR, when broken down offer by offer, reveals less positive BHAR (6) than negative ones (8). The time pattern suggests a trend shaped like a tunnel growing smaller, with the early offers generating both
200.00 150.00 100.00 50.00 0.00 −100.00 −50.00 (%) BTA J/89
Alian O/89Cent N/90 BPA D/90 BES J/91 M-C A/92 Imp ́e N/92CPP D/92 Cimp J/94BPSM N/94 Port J/95EdP J/97
Figure 5: BHAR 60 months after the PSIPO held between July 1989 and June 1997 (for the 12 companies that remained listed for at least 60 months).
very and very low BHAR, and the latter offers showing a less scattered pattern, far from the earlier highs and lows.
The offer method used in PSIPO varied significantly and consistently over time. The eight first offers were auctions (all Dutch auctions, except for Mundial-Confianc¸a, in which a single block was auctioned), followed by two fixed price offers and two bookbuilt offers. The eight auctions translated into only three positive BHAR (37.5%), while the (two) fixed price offers produced (two) positive BHAR and the (two) bookbuilt offers generated (two) negative BHAR. With the caution that the small sample size recommends, one is led to conclude that results match expectations, pointing to higher capacity of the offer methods which extract information from investors to generate pricings less prone to translate into positive long run abnormal returns. Curiously, this pattern is not present in initial returns: the relation between these and long-run returns is inverse, with a correlation coefficient
1 0.95 0.9 0.85 0.8 0.75 0.7 1 5 9 13 17 21 25 29 33 37 41 45 49 53 57 WR
Figure 6: Wealth relatives over time.
70.0 60.0 50.0 40.0 30.0 20.0 10.0 0.0 −20.0 −10.0 1 4 7 10 13 16 19 22 25 28 31 34 37 40 43 46 49 52 55 58 CAR CR (%)
Figure 7: Time series of the cumulative monthly returns, gross and abnormal, on an equally weighted PSIPO portfolio.
of−0.196. Only in four cases (BPA, Centralcer, Imp´erio, and CPP) does one find returns sharing the same sign, positive in BPA’s case and negative in the remaining ones. In the other eight offers, initial underpricing is matched by negative 5-year BHAR and vice versa, with the two fixed price offers posting initial overpricings and long-run positive BHAR and the two bookbuilt offers producing opposite results.
5.3.2. Wealth Relatives. The evolution of wealth relatives over
time is depicted inFigure 6.
In the first month, the WR is 0.93, and although the maximum value (0.99) is posted in month 26, the unit value is never reached. After twelve months, the WR is 0.90, after 36 months 0.96, and after 60 months 0.82. The analysis of WR thus points to the underperformance of Portuguese PSIPO in the long run.
5.3.3. Cumulative Abnormal Returns. We have based our
analysis of the Portuguese PSIPO’s initial aftermarket, which, in the first twenty trading days, produced negative cumu-lative abnormal returns, in this method. To capture long-run patterns, we now turn to monthly periods for analysis. Computed monthly AR and CAR are posted inTable 5, and depicted inFigure 7, together with gross cumulative returns.
The long-run analysis does not reverse the results stem-ming from the analysis of short-run aftermarket. The pattern of negative, and significantly different from zero, returns is sustained initially, but immediately after the 5th month it is no longer possible to reject the null hypothesis of zero cumulative returns for a significance level of 10%. This pattern
Table 5: AR and CAR for 1 to 12, 36, and 60 months.
Months 𝑁 AR CAR 𝑡CAR
Short-run Aftermarket 1 15 −7,1% −7,0% −3,20767∗∗∗ 2 15 −5,5% −12,5% −3,7942∗∗∗ 3 15 2,4% −10,1% −3,5513∗∗∗ 4 15 −2,0% −12,1% −3,7294∗∗∗ 5 15 5,4% −6,7% −0,65324 6 15 1,1% −5,5% −0,50533 7 15 −0,7% −6,2% −0,53367 8 15 −3,5% −9,8% −0,81478 9 15 −2,5% −12,2% −0,96539 10 15 3,1% −9,1% −0,6576 11 15 0,4% −8,7% −0,62113 12 15 −1,7% −10,4% −0,67213 (⋅ ⋅ ⋅ ) (⋅ ⋅ ⋅ ) (⋅ ⋅ ⋅ ) (⋅ ⋅ ⋅ ) (⋅ ⋅ ⋅ ) Long-run Aftermarket 36 14 0,6% −5,7% −0,31579 (⋅ ⋅ ⋅ ) (⋅ ⋅ ⋅ ) (⋅ ⋅ ⋅ ) (⋅ ⋅ ⋅ ) (⋅ ⋅ ⋅ ) 60 12 −0,02% −13,5% −0,54349
The table reports cumulative returns on the equally weighted Portuguese PSIPOportfolio for 1 to 12, 36, and 60 months after the first (or only) public offer (CAR) as well as the corresponding monthly returns (AR).∗∗∗, ∗∗, and∗ denote, respectively, a return statistically different from zero for 1%, 5%, and 10% significance levels.
is upheld during the 60 months under scrutiny. Thus, the long-run analysis of PSIPO CAR, like the short-run results, produces negative returns (with only six exceptions in 60 months, in months 19, and 24 to 28, as depicted in Figures 4). However, in a long horizon the cumulative returns, although negative on average, are not statistically different from zero.
6. Conclusion
The analysis of Portuguese PSIPO’s long-run returns gener-ates robust conclusions, independent of the elected method-ology. Abnormal returns are nonpositive, although not suffi-ciently negative to allow one to reject the hypothesis of zero returns.
These results are different from the ones made available by the IPO literature (no clear evidence of overpricing is found) and contrast even more with the results found for PIPO in international markets, since no evidence of long run underpricing is detected. On the contrary, our results are consistent with SIPO research, as well with the results of the Portuguese PIPO previous research, namely, Almeida and Duque [5] and Vieira and Serra [4], who use samples including some PIPO which are not PSIPO.
Our results show that no significant wealth transfer occurred between investors that participated in the share offers carried out by the Portuguese Republic and those who accepted exposure to privatized companies only in the secondary market. The former earned negative abnormal returns and the latter essentially zero abnormal returns. The price adjustment occurred in the first month of trading. Divergence of opinion or exaggerated optimism on the
PSIPO offers was eliminated relatively quickly; after all, the issuers, although coming to the market after long absences and under new names, were old acquaintances of investors.
Conflict of Interests
The author declares that there is no conflict of interests regarding the publication of this paper.
Acknowledgments
This paper draws upon the author’s doctoral dissertation. The author acknowledges the support and helpful comments of the thesis supervisor, Ant´onio Gomes Mota, and of thesis committee members Ant´onio Nogueira Leite, Miguel Athayde Marques, Clara Raposo, and Jos´e Paulo Esperanc¸a. All remaining errors are the author’s sole responsibility.
References
[1] J. R. Ritter, “The “hot issue” market of 1980,” Journal of Business, vol. 57, no. 2, pp. 215–240, 1984.
[2] S. M. Dawson, “Secondary stock market performance of Initial Public Offers, Hong Kong, Singapore and Malaysia: 1978–84,” Journal of Business Finance and Accounting, vol. 14, pp. 65–76, 1987.
[3] R. Alpalh˜ao, Ofertas P´ublicas Iniciais: o caso Portuguˆes [M.S. thesis], Nova School of Business and Economics, 1988, (Por-tuguese).
[4] C. Vieira and A. P. Serra, “Abnormal returns in privatiza-tion public offerings: the case of Portuguese firms,” Notas Econ´omicas, vol. 22, pp. 1–35, 2005.
[5] J. M. Almeida and J. Duque, “Ownership structure and Initial Public Offerings in small economies: the case of Portugal,” in Initial Public Offerings: An International Perspective, G. Gregoirou, Ed., Elsevier, New York, NY, USA, 2006.
[6] M. R. Borges, “Underpricing of Initial Public Offerings: the case of Portugal,” International Advances in Economic Research, vol. 13, no. 1, pp. 65–80, 2007.
[7] B. Husson and B. Jacquillat, “French new issues, underpricing and alternative methods of distribution,” in A Reappraisal of the Efficiency of FInancial Markets, R. M. C. Guimar˜aes, B. G. Kingsman, and S. J. Taylor, Eds., pp. 349–368, Springer, Berlin, Germany, 1989.
[8] F. Koh and T. Walter, “A direct test of Rock’s model of the pricing of unseasoned issues,” Journal of Financial Economics, vol. 23, no. 2, pp. 251–272, 1989.
[9] K. Wethyavivorn and Y. Koo-Smith, “Initial Public Offerings in Thailand, 1988-89: price and return patterns,” in Pacific-Basin Capital Markets Research, S. G. Rhee and R. P. Chang, Eds., vol. 2, North-Holland, Amsterdam, The Netherlands, 1991. [10] P. McGuiness, “The post-listing return performance of
unsea-soned new issues of common stock in Hong Kong,” Journal of Business Finance and Accounting, vol. 20, pp. 167–194, 1993. [11] R. M. Kunz and R. Aggarwal, “Why Initial Public Offerings are
underpriced: evidence from Switzerland,” Journal of Banking and Finance, vol. 18, no. 4, pp. 705–723, 1994.
[12] W. Drobetz, M. Kammermann, and U. W¨alchli, “Long-run performance of Initial Public Offerings: the evidence for
Switzerland,” Schmalenbach Business Review, vol. 57, pp. 253– 275, 2005.
[13] M. Levis, “Seasoned equity offerings and the short term performance of Initial Public Offerings,” European Financial Management, vol. 1, pp. 125–146, 1995.
[14] K. Rydqvist and K. H¨ogholm, “Going public in the 1980s— evidence from Sweden,” European Financial Management, vol. 1, no. 3, pp. 287–315, 1995.
[15] P. J. Lee, S. L. Taylor, and T. S. Walter, “Australian IPO pricing in the short and long run,” Journal of Banking and Finance, vol. 20, no. 7, pp. 1189–1210, 1996.
[16] C. Krishnamurti and P. Kumar, “The initial listing performance of Indian IPOs,” Managerial Finance, vol. 28, pp. 39–51, 2002. [17] P.-J. Engelen, “Underpricing of IPOs—Belgian evidence,”
Euro-pean Review of Economics and Finance, vol. 2, no. 1, pp. 53–69, 2003.
[18] S. ´Alvarez and V. M. Gonz´alez, “Signalling and the long-run performance of Spanish Initial Public Offerings (IPOs),” Journal of Business Finance and Accounting, vol. 32, no. 1-2, pp. 325–350, 2005.
[19] S. G¨unther and M. Rummer, “The hot-issue period in Germany: what factors drove IPO underpricing?” in Initial Public Offer-ings: An International Perspective, G. Gregoirou, Ed., pp. 215– 245, Elsevier, New York, NY, USA, 2007.
[20] R. Aggarwal, R. Leal, and L. Hern´andez, “The aftermarket performance of Initial Public Offerings in Latin America,” Financial Management, vol. 22, pp. 42–53, 1993.
[21] T. Loughran, J. R. Ritter, and K. Rydqvist, “Initial Public Offerings: international insights,” Pacific-Basin Finance Journal, vol. 2, no. 2-3, pp. 165–199, 1994.
[22] T. Jenkinson and C. Mayer, “The privatisation process in France and the U.K,” European Economic Review, vol. 32, no. 2-3, pp. 482–490, 1988.
[23] K. Menyah and K. Paudyal, “Share issue privatizations: the UK experience,” in Empirical Issues in Raising Equity Capital, M. Levis, Ed., Elsevier, Amsterdam, The Netherlands, 1996. [24] K. Paudyal, B. Saadouni, and R. J. Briston, “Privatisation Initial
Public Offerings in Malaysia: initial premium and long-term performance,” Pacific Basin Finance Journal, vol. 6, no. 5, pp. 427–451, 1998.
[25] D. Su and B. M. Fleisher, “An empirical investigation of underpricing in Chinese IPOs,” Pacific Basin Finance Journal, vol. 7, no. 2, pp. 173–202, 1999.
[26] R. Jelic and R. Briston, “Hungarian privatisation strategy and financial performance of privatised companies,” Journal of Business Finance and Accounting, vol. 26, no. 9-10, pp. 1319–1357, 1999.
[27] R. Jelic and R. Briston, “Privatisation Initial Public Offerings: the Polish experience,” European Financial Management, vol. 9, no. 4, pp. 457–484, 2003.
[28] R. Jelic, R. Briston, and W. Aussenegg, “The choice of privatiza-tion method and the financial performance of newly privatized firms in transition economies,” Journal of Business Finance and Accounting, vol. 30, no. 7-8, pp. 905–940, 2003.
[29] M. Omran, “Underpricing and long-run performance of share issue privatizations in the Egyptian stock market,” Journal of Financial Research, vol. 28, no. 2, pp. 215–234, 2005.
[30] E. C. Perotti and S. E. Guney, “The structure of privatization plans,” Financial Management, vol. 22, no. 1, pp. 84–98, 1993. [31] K. L. Dewenter and P. H. Malatesta, “State-owned and privately
labor intensity,” American Economic Review, vol. 91, no. 1, pp. 320–334, 2001.
[32] S. D. Choi and S. K. Nam, “The short-run performance of IPOs of privately- and publicly-owned firms: international evidence,” Multinational Finance Journal, vol. 2, no. 3, pp. 225–244, 1998. [33] S. L. Jones, W. L. Megginson, R. C. Nash, and J. M. Netter, “Share
issue privatizations as financial means to political and economic ends,” Journal of Financial Economics, vol. 53, no. 2, pp. 217–253, 1999.
[34] A. P. Ljungqvist, T. Jenkinson, and W. J. Wilhelm Jr., “Global integration in primary equity markets: the role of U.S. banks and U.S. investors,” Review of Financial Studies, vol. 16, no. 1, pp. 63–99, 2003.
[35] Q. Huang and R. M. Levich, “Underpricing of new equity offerings by privatized firms: an international test,” International Journal of Theoretical and Applied Finance, vol. 6, no. 1, pp. 1–30, 2003.
[36] W. Aussenegg, “Privatization versus private sector Initial Public Offerings in Poland,” Multinational Finance Journal, vol. 4, no. 1-2, pp. 69–99, 2000.
[37] C. J. Muscarella and M. R. Vetsuypens, “The underpricing of “second” Initial Public Offerings,” Journal of Financial Research, vol. 12, no. 3, pp. 183–192, 1989.
[38] F. Derrien and A. Kecsk´es, “The Initial Public Offerings of listed firms,” Journal of Finance, vol. 62, no. 1, pp. 447–479, 2007. [39] A. Ljungqvist, “IPO underpricing,” in Handbook of Corporate
Finance: Empirical Corporate Finance, B. Espen Eckbo, Ed., Elsevier, North Holland, 2007.
[40] E. C. Perotti, “Credible privatization,” American Economic Review, vol. 85, no. 4, pp. 847–859, 1995.
[41] D. B. B¨os, Privatization: A Theoretical Treatment, Oxford Uni-versity Press, 1991.
[42] F. Allen and G. R. Faulhaber, “Signalling by underpricing in the IPO market,” Journal of Financial Economics, vol. 23, no. 2, pp. 303–323, 1989.
[43] M. Grinblatt and C. Y. Hwang, “Signaling and the pricing of new issues,” Journal of Finance, vol. 44, pp. 393–420, 1989.
[44] I. Welch, “Seasoned offerings, imitation costs, and the under-pricing of Initial Public Offerings,” Journal of Finance, vol. 44, pp. 421–449, 1989.
[45] B. Biais and E. Perotti, “Machiavellian privatization,” American Economic Review, vol. 92, no. 1, pp. 240–258, 2002.
[46] M. K. Boutchkova and W. L. Megginson, “Privatization and the rise of global capital markets,” Financial Management, vol. 29, no. 4, pp. 31–76, 2000.
[47] D. C. Shaw, “The performance of primary common stock offerings: a Canadian comparison,” Journal of Finance, vol. 26, no. 5, pp. 1101–1113, 1971.
[48] J. R. Ritter, “The long-run performance of Initial Public Offer-ings,” Journal of Finance, vol. 46, no. 1, pp. 3–27, 1991.
[49] R. B. Carter, F. H. Dark, and A. K. Singh, “Underwriter reputation, initial returns, and the long-run performance of IPO stocks,” Journal of Finance, vol. 53, no. 1, pp. 285–311, 1998. [50] M. Keloharju, “The winner’s curse, legal liability, and the
long-run price performance of Initial Public Offerings in Finland,” Journal of Financial Economics, vol. 34, no. 2, pp. 251–277, 1993. [51] M. Levis, “The long-run performance of Initial Public Offerings: the UK experience,” Financial Management, vol. 22, pp. 28–41, 1993.
[52] A. P. Ljungqvist, “Pricing Initial Public Offerings: further evidence from Germany,” European Economic Review, vol. 41, no. 7, pp. 1309–1320, 1997.
[53] J. Cai and K. C. J. Wei, “The investment and operating per-formance of Japanese Initial Public Offerings,” Pacific Basin Finance Journal, vol. 5, no. 4, pp. 389–417, 1997.
[54] V. B. Marisetty and M. G. Subrahmanyam, “Group affiliation and the performance of IPOs in the Indian stock market,” Journal of Financial Markets, vol. 13, no. 1, pp. 196–223, 2010. [55] J.-B. Kim, I. Krinsky, and J. Lee, “The aftermarket performance
of Initial Public Offerings in Korea,” Pacific-Basin Finance Journal, vol. 3, no. 4, pp. 429–448, 1995.
[56] A. Brav and P. A. Gompers, “Myth or reality? The long-run underperformance of Initial Public Offerings: evidence from venture and nonventure capital-backed companies,” Journal of Finance, vol. 52, no. 5, pp. 1791–1821, 1997.
[57] P. A. Gompers and J. Lerner, “The really long-run performance of Initial Public Offerings: the pre-nasdaq evidence,” Journal of Finance, vol. 58, no. 4, pp. 1355–1392, 2003.
[58] F. Degeorge and F. Derrien, “Les d´eterminants de la perfor-mance `a long terme des introductions en Bourse: le cas franc¸ais,” Banque Et March´es, pp. 8–18, 2001 (French).
[59] R. Stehle, O. Ehrhardt, and R. Przyborowsky, “Long-run stock performance of German Initial Public Offerings and seasoned equity issues,” European Financial Management, vol. 6, no. 2, pp. 173–196, 2000.
[60] K. Menyah, K. Paudyal, and C. G. Inyangete, “Subscriber return, underpricing, and long-term performance of U.K. privatization Initial Public Offers,” Journal of Economics and Business, vol. 47, no. 5, pp. 473–495, 1995.
[61] A. E. Boardman and C. Laurin, “Factors affecting the stock price performance of share issued privatizations,” Applied Economics, vol. 32, no. 11, pp. 1451–1464, 2000.
[62] S. R. Foerster and G. A. Karolyi, “The long-run performance of global equity offerings,” Journal of Financial and Quantitative Analysis, vol. 35, no. 4, pp. 499–528, 2000.
[63] E. C. Perotti and P. van Oijen, “Privatization, political risk and stock market development in emerging economies,” Journal of International Money and Finance, vol. 20, no. 1, pp. 43–69, 2001. [64] W. L. Megginson, R. C. Nash, J. M. Netter, and A. L. Schwartz, “The long-run return to investors in share issue privatization,” Financial Management, vol. 29, no. 1, pp. 67–77, 2000.
[65] C. B¨ulent Aybar, “The long-term performance of privatization-related ADR issues,” Emerging Markets Review, vol. 3, no. 2, pp. 135–164, 2002.
[66] S.-D. Choi, I. Lee, and W. Megginson, “Do privatization ipos outperform in the long run?” Financial Management, vol. 39, no. 1, pp. 153–185, 2010.
[67] F. Degeorge and R. Zeckhauser, “The reverse LBO decision and firm performance: theory and evidence,” Journal of Finance, vol. 48, no. 4, pp. 1323–1348, 1993.
[68] S. Mian and J. Rosenfeld, “Takeover activity and the long-run performance of reverse leveraged buyouts,” Financial Manage-ment, vol. 22, no. 4, pp. 46–57, 1993.
[69] R. W. Holthausen and D. F. Larcker, “The financial performance of reverse leveraged buyouts,” Journal of Financial Economics, vol. 42, no. 3, pp. 293–332, 1996.
[70] E. M. Miller, “Risk, uncertainty and divergence of opinion,” Journal of Finance, vol. 32, pp. 1151–1168, 1977.
[71] R. Aggarwal and P. Rivoli, “Fads in the Initial Public Offering market?” Financial Management, vol. 19, pp. 45–57, 1990.
[72] P. Schultz, “Pseudo market timing and the long-run underper-formance of IPOs,” Journal of Finance, vol. 58, no. 2, pp. 483–517, 2003.
[73] M. Pagano, F. Panetta, and L. Zingales, “Why do companies go public? An empirical analysis,” Journal of Finance, vol. 53, no. 1, pp. 27–64, 1998.
[74] R. Alpalh˜ao and P. Alves, “States as LBO specialists: evidence from Portugal,” International Journal of Financial Research, vol. 4, no. 2, pp. 68–76, 2013.
[75] S. P. Kothari and J. B. Warner, “Econometrics of event studies,” in Handbook of Corporate Finance: Empirical Corporate Finance, B. Espen Eckbo, Ed., Elsevier, North Holland, 2007.
[76] B. M. Barber and J. D. Lyon, “Detecting abnormal operating performance: the empirical power and specification of test statistics,” Journal of Financial Economics, vol. 41, no. 3, pp. 359– 399, 1996.
[77] S. P. Kothari and J. B. Warner, “Measuring long-horizon security price performance,” Journal of Financial Economics, vol. 43, no. 3, pp. 301–339, 1997.
[78] J. D. Lyon, B. M. Barber, and C.-L. Tsai, “Improved methods for tests of long-run abnormal stock returns,” Journal of Finance, vol. 54, no. 1, pp. 165–201, 1999.
[79] T. Loughran and J. R. Ritter, “The new issues puzzle,” Journal of Finance, vol. 50, pp. 23–51, 1995.
[80] E. F. Fama, “Market efficiency, long-term returns, and behav-ioral finance,” Journal of Financial Economics, vol. 49, no. 3, pp. 283–306, 1998.
[81] M. L. Mitchell and E. Stafford, “Managerial decisions and long-term stock price performance,” Journal of Business, vol. 73, no. 3, pp. 287–329, 2000.
[82] R. Alpalh˜ao, “From market to state: wealth transfers in the Portuguese nationalisations of the 1970s1,” Financial History Review, vol. 19, no. 1, pp. 49–74, 2012.
Submit your manuscripts at
http://www.hindawi.com
Child Development Research
Hindawi Publishing Corporation
http://www.hindawi.com Volume 2014
Education
Research International Hindawi Publishing Corporation
http://www.hindawi.com Volume 2014
Hindawi Publishing Corporation
http://www.hindawi.com Volume 2014
Biomedical EducationJournal of
Hindawi Publishing Corporation
http://www.hindawi.com Volume 2014
Psychiatry
Journal
Archaeology
Journal ofHindawi Publishing Corporation
http://www.hindawi.com Volume 2014 Hindawi Publishing Corporation
http://www.hindawi.com Volume 2014
Anthropology
Journal of
Hindawi Publishing Corporation
http://www.hindawi.com Volume 2014
Research and Treatment
Schizophrenia
Hindawi Publishing Corporation
http://www.hindawi.com Volume 2014
Urban Studies
Research
Population ResearchInternational Journal of
Hindawi Publishing Corporation
http://www.hindawi.com Volume 2014 Hindawi Publishing Corporation
http://www.hindawi.com Volume 2014
Aging Research
Journal ofHindawi Publishing Corporation
http://www.hindawi.com Volume 2014
Hindawi Publishing Corporation
http://www.hindawi.com Volume 2014
Nursing
Research and Practice
Current Gerontology & Geriatrics Research
Hindawi Publishing Corporation
http://www.hindawi.com Volume 2014
Sleep Disorders
Hindawi Publishing Corporationhttp://www.hindawi.com Volume 2014
Addiction
Journal ofHindawi Publishing Corporation
http://www.hindawi.com Volume 2014
Hindawi Publishing Corporation
http://www.hindawi.com Volume 2014
Economics
Research International
Depression Research and Treatment
Hindawi Publishing Corporation
http://www.hindawi.com Volume 2014
Hindawi Publishing Corporation
http://www.hindawi.com Volume 2014
Geography
Journal
Hindawi Publishing Corporation
http://www.hindawi.com Volume 2014
Research and Treatment