EURASIAN JOURNAL OF ECONOMICS AND FINANCE
http://www.eurasianpublications.com
†This research paper was part of the research project “Advancing Serbia’s Competitiveness in the Process of EU Accession”, No. 47028, during the period 2011-2015, financed by the Serbian Ministry of Science and Technological Development.
T
HE
I
MPACT OF
D
IFFERENT
F
ORMS OF
F
OREIGN
C
APITAL
I
NFLOW ON
GDP
PC IN
CEE
C
OUNTRIES DURING THE
C
RISIS UP TO
2012
†
Goran Pitic
Corresponding Author: Singidunum University, Serbia. Email: [email protected]
Nebojsa Savic
Singidunum University, Serbia. Email: [email protected]
Lidija Barjaktarovic
Singidunum University, Serbia. Email: [email protected]
Snezana Konjikusic
Singidunum University, Serbia. Email: [email protected]
Abstract
This paper represents further analysis of the authors of previous research on the impact of foreign capital inflow on GDPpc. The analysis includes nine countries of Central and Southeastern Europe - CEE-9 in the period 2005-2012. The previous research has shown that foreign capital inflow (foreign direct investment /FDI/, portfolio investment /PI/, remittances /REM/ and cross-border credits/CBC/) had an impact on an increase in GDPpc and that CBC inflow had the greatest impact on an increase in GDPpc in the period 2005-2012. In this paper, we use correlation and panel regression in order to determine the cause and impact of the available source of financing on the level of GDPpc. Research showed that the influence of the crisis was evident from 2008 onwards and that CBC had the greatest impact on an increase in GDPpc in the period 2005-2012. Under conditions of a lack of financial resources from domestic sources, coupled with an insufficiently attractive business environment, CBCpc inflow had the greatest impact on an increase in GDPpc. Such a high significance of CBCpc is the result of the fact that CEE-9 failed to create a sufficiently attractive business environment. In an attempt to catch up with advanced EU economies, CEE-9 had to finance the increasing amount of investment from the relatively most expensive sources, such as CBCs, during the crisis. The problems related to the quality of the business environment and underdeveloped institutions contributed to a weak relationship between FDIpc and GDPpc. A weak indirect relationship also exists between PIpc and the level of GDPpc. A strong indirect relationship between REMpc and GDPpc was also observed. The correlation analysis showed that GDPpc was directly and strongly related to CBCpc.
71 1. Introduction and Literature Review
This paper represents further research by Savic et al. (2014; 2013a) and Savic et al. (2013c) concerning the impact of foreign sources of financing on citizens’ wealth expressed in terms of the level of GDPpc achieved by the selected countries of Central and Southeastern Europe – CEE-9 (Albania, Bosnia and Herzegovina, Bulgaria, Croatia, Hungary, Montenegro, Romania, Slovenia and Serbia) in the period 2005-2012. Foreign sources of finance included foreign direct investment (FDI), portfolio investment (PI), remittances (REM) and cross-border credits (CBC).
The panel regression results show that, compared to the analyzed inflow, CBCpc represents the most significant foreign capital inflow, which provides a basis for applying a K-means cluster analysis to GDPpc and CBCpc (Savic et al. 2014). This method was used in order to group the analyzed countries into clusters relative to the mentioned variables. Countries belong to a cluster if they are similar, or if a distance between them is small relative to the analyzed parameters (GDPpc, CBCpc).
The correlation analysis showed that GDPpc in the countries making up the sample was directly and heavily dependent on CBCpc inflow as a foreign source of finance. PIpc has a small impact while the impact of FDIpc on GDPpc is insignificant in comparison with the impact of CBCpc; REM is indirectly related to the level of GDPpc. An important conclusion that can be derived from the correlation analysis is that CBC was more significant for the level of GDPpc than FDI in the respective period. The applied panel regression models show that the effects of the global economic crisis were observable as early as 2009, manifesting themselves through a decline in foreign capital inflow and thus having an effect on a decline in GDPpc in CEE-9 countries. Due to low saving rates, CEE countries had to ensure high foreign capital inflows in order to achieve GDPpc growth and catch up with the advanced EU economies. Since these countries achieved different yet mostly dissatisfactory levels of competitiveness, foreign investors were not sufficiently prepared to enter them through FDI inflow. The main obstacle to higher FDI inflow was reflected in an insufficiently favorable business environment. Faced with the problem of insufficient FDI inflow, on one side, and the need to achieve growth and catch up with the advanced EU economies, on the other, these countries were forced to ensure capital inflows through CBC. Although this was a more expensive method of financing development, its impact was driven by insufficient levels of competitiveness, but sometimes also by specific regulatory measures (incentives). According to Savic et al. (2014) Romania increased its GDPpc faster than CBCpc; Albania, B&H, Serbia, Montenegro and Bulgaria increased their GPDpc simultaneously with CBCpc while Hungary and Croatia increased their CBCpc faster than GDPpc.
Bearing in mind the described foreign capital flows, the aim of this paper was to determine whether foreign capital inflow had an impact on an increase in GDPpc in CEE-9 in the period 2005-2012. In this paper, we tested the hypotheses that CBCpc inflow had the greatest impact on an increase in GDPpc in CEE-9 countries.
2. Description of the Data and Methodology
The paper examines the interdependence of GDPpc, on one side, and FDIpc, REMpc, PIpc and CBCpc, on the other, for CEE-9 countries in the period 2005-2012. In previous papers (Savic et al. 2013a; Savic et al. 2013b) we analyzed period before 2010.
72
Panel regression models were used in order to investigate the fixed and/or random effects of input variables. The essential difference between these two models lies in the role of so-called dummy variables. If these dummy variables are considered a part of the free term of the linear model, it is the question of the fixed effect (FE) model. In the random effect (RE) model, dummy variables are treated as a part of the error or are contained in it. The FE model investigates group differences in the free terms (intercepts of the linear function), assuming the same slopes and constant variabilities of input data (the observed subjects-countries). Since the group effect (individual-specific) is time-invariant and considered a part of the free term, ui is
allowed to be correlated with other regressors. The general form of the FE model is:
yit=(α+ui)+X’itβ+vit. (1)
In this model, the slope and variance error are constant while the intercept varies across countries and/or time. FE models use least square dummy variable (LSDV) and within effect estimation methods. Ordinary least squares (OLS) belong to the group of FE models.
The general form of the RE model is:
yit=α+X’itβ+(ui+vit), (2)
where the slope is constant like in the previous model while the intercept and variance differ relative to the previous model or, more precisely, the intercept in this model is constant, and the variance error varies across countries and/or time. The variables in the RE model are estimated using the GLS and FGLS methods, as well as the LM test. Unlike the FE model, the RE model estimates the variabilities by group or time, assuming the same free terms and slopes, whereby ui behaves like the error component and thus is not correlated with any regressor coefficient. In
the opposite, the essential OLS assumption will be disturbed. In this model, the difference in groups or time periods is based on the variability of the error terms, and not the free term. The RE model is estimated using the standard least square (GLS) method when the between-group variance Ω matrix is known. The feasible least square (FGLS) method is used when the Ω matrix is not known.
The coefficients calculated by means of the FE method, are tested using the F-test, while in the case of RE testing is carried out using the Lagrange multiplier. Decision-making on the use of the FE or RE model is based on the results of the Hausman test. If the null hypothesis of the mentioned test is not rejected or, more precisely if individual effects are uncorrelated with other regressors, the RE model is better than the FE one. Due to the results of the Hausman test (p=0.63), the RE models are rejected for our data.
3. Results
In continuation, we present the average changes for GDPpc, REMpc and CBCpc in the period 2005-2012: the correlation coefficient was calculated for each country, i.e. for GDPpc and FDIpc, GDPpc and FDIpc, GDPpc and PIpc, GDPpc and REMpc, GDPpc and CBCpc, and the panel regression results are shown.
73
Table 1. The average annual growth rates in the period 2005-2012
Country GDPpc REMpc CBCpc
Albania 5.97 9.70 12.3
B&H 6.95 9.82 7.30
Bulgaria 9.35 9.89 22.5
Montengro 10.10 11.20 8.70
Croatia 4.66 11.50 12.10
Hungary 1.96 1.90 1.10
Romania 10.22 -3.10 26.7
Slovenia 3.03 11.60 8.00
Serbia 6.27 -6.66 12.20
Source:Authors’ calculations
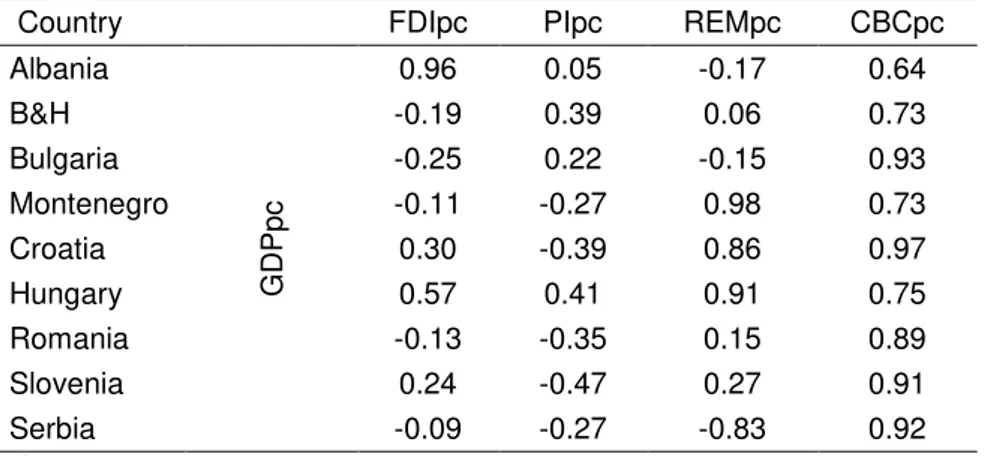
Table 2 shows the correlation coefficients, which were calculated for each country, crosswise for GDPpc and FDIpc, namely GDPpc and REMpc. The calculation showed that the value of the correlation coefficient for all countries for GDPpc and CBCpc was high and positive, and that GDPpc also increased with an increase in the level of CBCpc.
Table 2. Correlation coefficients for GDPpcandsubsequentlyfor FDIpc, PIpc, REMpc, CBCpc (2005-2012)
Country FDIpc PIpc REMpc CBCpc
Albania
G
DP
pc
0.96 0.05 -0.17 0.64
B&H -0.19 0.39 0.06 0.73
Bulgaria -0.25 0.22 -0.15 0.93
Montenegro -0.11 -0.27 0.98 0.73
Croatia 0.30 -0.39 0.86 0.97
Hungary 0.57 0.41 0.91 0.75
Romania -0.13 -0.35 0.15 0.89
Slovenia 0.24 -0.47 0.27 0.91
Serbia -0.09 -0.27 -0.83 0.92
Source: Authors’ calculations
The analysis continues to determine the degree of linear relationship between GDPpc and other indicators. According to the results (Table 3), it is evident that there is a distinctly weak relationship between FDIpc and GDPpc. A weak indirect relationship exists between PIpc and the level of GDPpc. One can also observe a strong indirect relationship between REMpc and GDPpc. The correlation analysis showed that GDPpc was directly and strongly related to CBCpc.
Table 3. Correlation coefficients by country
FDIpc PIpc REMpc CBCpc
GDPpc 0.114022 -0.22217 -0.5047 0.954158
Source:Authors’ calculation
74
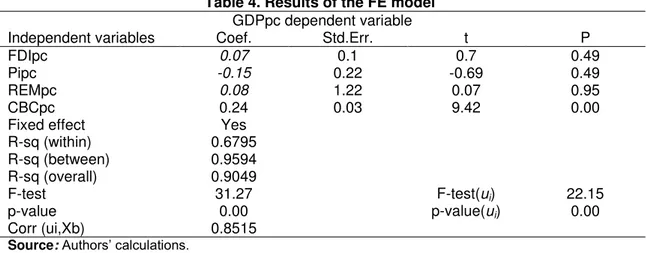
By applying the FE model to the observed data where GDPpc is a dependent variable and FDIpc, PIpc, REMpc and CBCpc independent variables, we obtain the results shown in the Table 4.
Table 4. Results of the FE model GDPpc dependent variable
Independent variables Coef. Std.Err. t P
FDIpc 0.07 0.1 0.7 0.49
Pipc -0.15 0.22 -0.69 0.49
REMpc 0.08 1.22 0.07 0.95
CBCpc 0.24 0.03 9.42 0.00
Fixed effect Yes
R-sq (within) 0.6795
R-sq (between) 0.9594
R-sq (overall) 0.9049
F-test 31.27 F-test(ui) 22.15
p-value 0.00 p-value(ui) 0.00
Corr (ui,Xb) 0.8515
Source: Authors’ calculations.
Notes: Coefficients given in italic are not statistically significant.
The statistical significance of each regression coefficient is contained in the output data and determined using a t-test. The statistical significance of the regression model is determined on the basis of the p-value. Since the p-value is less than 0.05, it is concluded that the obtained model is statistically significant and that the impact of at least one regressor variable on the values of the dependent variable is statistically significant. On the basis of the obtained results it is clear that the model is statistically significant (F=31.27 and p-value=0.00); only the obtained coefficient for CBCpc is statistically significant (p-value=0.00) and points to a direct relationship between GDPpc and CBCpc.
The subsequent steps will consist of applying the least square dummy variable (LSDV) method (within which dummy variables are introduced). Dummy variables are actually binary variables that are encoded by taking the values 0 and 1. There are also certain dangers associated with the use of dummy variables. In order to avoid them, the LSDV1, LSDV2 and LSDV3 models can be used. These three approaches are reduced to fitting the same linear model, but the dummy variable coefficients in each approach have a different meaning due to which they are also numerically different.
75
Table 5. Results of the LSDV1 model, introduced dummy variables for countries GDPpc dependent variable
Independent variables Coef. Std.Err. t P
FDIpc 0.07 0.1 0.7 0.49
Pipc -0.15 0.22 -0.69 0.49
REMpc 0.08 1.22 0.07 0.95
CBCpc 0.24 0.03 9.42 0.00
Albania -10653.61 1112.05 -9.58 0.00
B&H -10501.38 1180.09 -8.90 0.00
Bulgaria -9472.23 895.63 -10.58 0.00
Montenegro -10053.69 940.73 -10.69 0.00
Croatia -6761.86 557.16 -12.14 0.00
Hungary -6413.26 644.7 -9.95 0.00
Romania -8069.35 902.62 -8.94 0.00
Slovenija Omitted
Serbia -9765.35 1104.36 -8.84 0.00
R-squared 0.9811
Adj R-squared 0.9773
F-test 255.34
p-value 0.0000
Source:Authors’ calculations.
Notes: Introduced dummy variables for all countries except Slovenia. Coefficients given in italic are not statistically significant.
On the basis of the obtained results it is evident that CBCpc has a direct impact on GDPpc. The assessments for FDIpc, PIpc and REMpc in this model are not statistically significant. In this model, the countries being the most distant from the reference point (Slovenia) are listed in the order of distance: Albania, B&H, Montenegro, Serbia, Bulgaria, Romania, Croatia and Hungary. Since F=255.34 and p-value=0.00, the model is statistically significant.
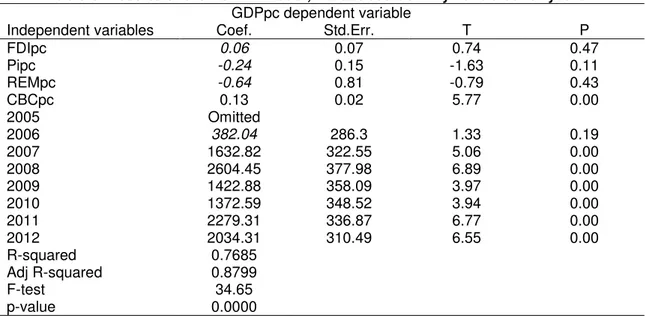
If we use dummy variables for years and not for countries like in the previous model – in order to detect certain regularities during the period under review – we will obtain the result shown in the Table 6.
Table 6. Results of the LSDV1 model, introduced dummy variables for years GDPpc dependent variable
Independent variables Coef. Std.Err. T P
FDIpc 0.06 0.07 0.74 0.47
Pipc -0.24 0.15 -1.63 0.11
REMpc -0.64 0.81 -0.79 0.43
CBCpc 0.13 0.02 5.77 0.00
2005 Omitted
2006 382.04 286.3 1.33 0.19
2007 1632.82 322.55 5.06 0.00
2008 2604.45 377.98 6.89 0.00
2009 1422.88 358.09 3.97 0.00
2010 1372.59 348.52 3.94 0.00
2011 2279.31 336.87 6.77 0.00
2012 2034.31 310.49 6.55 0.00
R-squared 0.7685
Adj R-squared 0.8799
F-test 34.65
p-value 0.0000
Source: Authors’ calculations.
76
Just like in the previous model, only the regressor coefficient corresponding to CBCpc is statistically significant. If F=34.65 and p-value=0.00, the model is statistically significant. It is important to note that the obtained coefficients have been dramatically declining since 2008. This points out that the effects of the global economic crisis have been felt since 2008 and that this year is crucial for the development of the real and financial markets of CEE-9 countries.
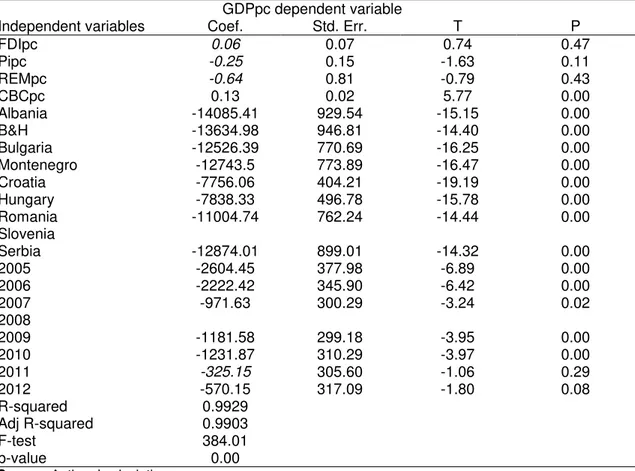
In order to find a good model, there remains the possibility of using the dummy variables referring to both countries and time, which is shown in Table 7. The results of such a model are output values yit which correspond to a specific country for a specific year.
Table 7. Results of the LSDV1 model, introduced dummy variables for countries and years
GDPpc dependent variable
Independent variables Coef. Std. Err. T P
FDIpc 0.06 0.07 0.74 0.47
Pipc -0.25 0.15 -1.63 0.11
REMpc -0.64 0.81 -0.79 0.43
CBCpc 0.13 0.02 5.77 0.00
Albania -14085.41 929.54 -15.15 0.00
B&H -13634.98 946.81 -14.40 0.00
Bulgaria -12526.39 770.69 -16.25 0.00
Montenegro -12743.5 773.89 -16.47 0.00
Croatia -7756.06 404.21 -19.19 0.00
Hungary -7838.33 496.78 -15.78 0.00
Romania -11004.74 762.24 -14.44 0.00
Slovenia
Serbia -12874.01 899.01 -14.32 0.00
2005 -2604.45 377.98 -6.89 0.00
2006 -2222.42 345.90 -6.42 0.00
2007 -971.63 300.29 -3.24 0.02
2008
2009 -1181.58 299.18 -3.95 0.00
2010 -1231.87 310.29 -3.97 0.00
2011 -325.15 305.60 -1.06 0.29
2012 -570.15 317.09 -1.80 0.08
R-squared 0.9929
Adj R-squared 0.9903
F-test 384.01
p-value 0.00
Source:Authors’ calculations.
Notes: Introduced dummy variables for countries and years (reference points: Slovenia and the year 2008). Coefficients given in italic are not statistically significant.
The model is also statistically significant (p-value=0.00) and, just like in the previous models, only the regressor coefficient CBCpc is statistically significant. Its positive value points out that an increase in CBCpc also leads to an increase in GDPpc.
4. Conclusions
77
investment from the relatively most expensive sources, such as CBCs, during the crisis.
The highest average increase in GDPpc in the period under review was recorded in Romania, Montenegro and Bulgaria, and the least in Hungary and Slovenia (Savic et al. 2013c; Savic et al. 2014). It is evident that the average change in CBCpc in the observed countries is higher than the average change in GDPpc, except in Hungary and Montenegro. The great difference in favour of CBCpc relative to GDPpc was recorded in Romania, Croatia and Bulgaria. Romania and Serbia are the only observed countries recording a fall in REMpc. The average change was not calculated for FDIpc and PIpc due to the existence of negative values in the time series.
The problems related to the quality of the business environment and underdeveloped institutions contributed to a weak relationship between FDIpc and GDPpc. A weak indirect relationship also exists between PIpc and the level of GDPpc. A strong indirect relationship between REMpc and GDPpc was also observed. The correlation analysis showed that GDPpc was directly and strongly related to CBCpc. The coefficients obtained for CBCpc are statistically significant and point to a direct relationship between GDPpc and CBCpc. The obtained coefficients have been dramatically declining since 2008. This shows that the effects of the global economic crisis have been felt since 2008 and that it is the question of the crucial year for the development of the real and financial markets of CEE-9 countries. Thus, the only statistically significant regressor coefficient is CBCpc, whose positive value points out that an increase in CBCpc leads to an increase in GDPpc. Bearing in mind the downward trend of CBCpc on this market over the past years, in addition to the requests for the diversification of the sources of finance, it is evident that CEE-9 must encourage other forms of capital inflow. Apart from strengthening the domestic deposit base, emphasis must be placed on improving the quality of the business environment and raising the level of competitiveness, thus increasing above all else the level of FDI. This would enable overcoming the problem related to the lack of domestic savings, but the positive effects of this form of capital inflow on economic growth and development, i.e. an increase in GDPpc would also be felt.
The authors will aim their further research at analyzing the efficiency in using foreign capital and identifying different subperiods in capital inflows to CEE-9 during the current crisis.
References
BIS, 2012. BIS quarterly review march 2011. [online] Available at: <http://www.bis.org> [Accessed 06 February 2012].
IMF, 2012. World economic outlook databases. Washington, DC: IMF.
Savic,N., Barjaktarovic, L., and Konjikusic, S., 2013a. Impact of foreign capital inflow on GDPpc in CEE counties. Annals of Faculty Engineering Hunedoara – International Journal of Engineering, 11(4), pp.129-135.
Savic, N., Barjaktarovic, L., and Konjikusic, S., 2014. Foreign capital inflow and GPDpc in CEE countries, Actual Problems of Economics APE, 03(153), pp.54-65.
Savic, N., Pitic, G., and Barjaktarovic, L., 2013b. Forced changes in banks financing growth in
East European Countries”, FINART, Volume II, Chapter 11, pp.189-203.
Savic, N., Pitic, G., and Konjikusic, S., 2013c. Competitiveness of Western Balkans in the process of EU integration. In: V. Kandzija and A. Kumar eds. Economic integrations, competition and cooperation - Accession of the Western Balkan countries to the European Union. Rijeka: University of Rijeka, pp.195-209.