Initial Public Offerings: The Relevance of the
Market Timing Hypothesis Under Conditions
of the Czech Capital Market
Meluzín Tomáš, Zinecker Marek
Abstract
In this article, the authors study the relevance of the market timing hypothesis of going public,
which tends to explain the lower post-issue operating performance of Czech initial public of -ferings. The data collected under the conditions of the Czech capital market are compared with
the performance of companies selected from the main European stock exchanges, when they
decided to adopt the IPO strategy. Achieving the objective required an empirical survey that involved a collection of accounting data in companies that had completed an initial public offer
in the Czech capital market. The data were evaluated by inancial performance measures. The
comparisons were made using descriptive statistical methods. The research results broaden and deepen the present understanding of the market timing hypothesis in companies going public, particularly in the Czech Republic.
Key words: Initial Public Offering, Market Timing Theory, Performance Measures, Czech Capital Market
1. INTRODUCTION
One of the phenomena associated with initial public offerings (IPOs) is a lower post-issue
operating performance after the company is going public. According to Paleari et al. (2006), the accounting performance of the newly listed companies in the private sector becomes worse after going public.
The period in which companies generate lower earnings usually lasts 3 to 5 years after IPO. This was demonstrated for irst time by Ritter (1991) and then corroborated by several other
international studies.
There are several explanations for this phenomenon. According to Khurshed, Paleari and Vis
-mara (2005), there are three major hypotheses explicating such post-issue underperformance:
market timing hypothesis,
window dressing (earning management) hypothesis, theory of information asymmetry among investors.
The market timing hypothesis is based on the assumption that companies do not enter the capital market when they have a high growth potential and need to raise additional funding, but at the time when they are able to display positive growth opportunities, and thus to induce optimistic valuations. According to
Loughran and Ritter (1995), existing shareholders try to enter the capital market at the time when their company enjoys very good inancial results, reports maximum operational per -formance, and the sector in which it operates is at the peak of its growth. They assume that investors will be positively inclined with respect to true value of the issuing company. Companies also try schedule stock issuance for periods when shares are in greater demand and are overvalued. Based on that assumption, a hypothesis has been put forward saying that long-term return on shares issued in periods with large numbers of IPOs is lower than that
on shares issued in periods with few IPOs. This hypothesis has been corroborated by several empirical studies.
The window dressing (earning management) hypothesis is based on an assumption that before imple-menting the IPO, companies will try to window-dress their accounting numbers to make the
irms look better before public offering. The result of such interventions is overvaluation of
the issue. At the same time, post-IPO companies will not be realistically able to achieve
long-term results expected from the investors, and share prices will begin to drop. In view of the fact that in a majority of developed countries, issuer companies are required to ile inancial
statements that meet International Financial Reporting Standards (IFRSs) and to have them audited, this theory cannot at present be considered the main reason for underperformance of issuer companies.
The most recent theory that strives to explain long-term post-issue underperformance is based on the assumption of the existence of an information asymmetry. Investors have different expec
-tations with respect to the issuer’s real value. If there are enough optimistic investors on the
market, the issue will be overpriced. But some time after the issue date and with the emergence of new information that help alleviate the information asymmetry, the pessimistic and the
op-timistic opinions of investors will converge, resulting in a decrease in the shares’ price. In this article, the authors consider the relevance of the irst of the market timing hypothesis that explains long-term post-issue underperformance of issuers under the conditions of the
Czech capital market, and compares the data collected with the performance of companies
that chose the main European stock exchanges when they decided to implement the going
public strategy.
2. MATERIAL AND METHODS
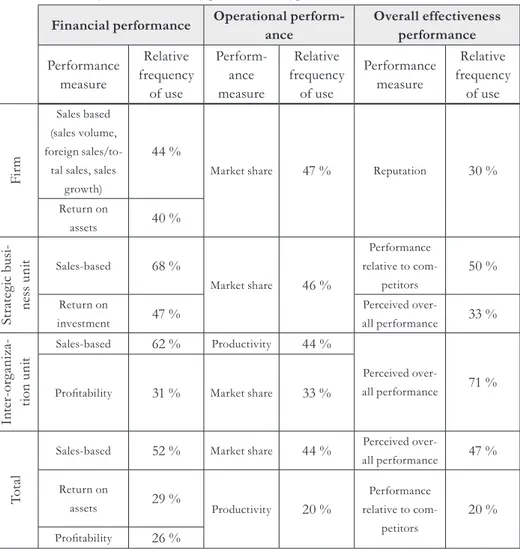
Hult et al. (2008) analyzed 96 papers reporting results of performance measurements in irms operating internationally. The papers were published between 1995 and 2005 in international academic journals (Academy of Management Journal, Administrative Science Quarterly, Jour -nal of Marketing, Jour-nal of Marketing Research, Jour-nal of Internatio-nal Business Studies, Management Science, Organization Science and Strategic Management Journal). It follows
from an analysis of results shown in Table 1 that the most frequently used measures of inancial performance in a irm are sales-based and return-based performance measures.
Paleari et al. (2008) measures inancial performance of irms that entered selected European stock exchange markets (London Stock Exchange, Euronext, Deutsche Börse and Borsa Ital
-iana) through an initial public offering in 1996–2007 on the basis of the development of the
following four indices in a period three years prior to the IPO, three years after the IPO and in the year of IPO:
sales volume,
net proit volume,
return on equity, return on investment.
Tab. 1 – Commonly used measures by performance type. Source: Hult et al. (2008) Financial performance Operational
perform-ance Overall effectiveness performance Performance measure Relative frequency of use Perform-ance measure Relative frequency of use Performance measure Relative frequency of use F ir m Sales based (sales volume, foreign sales/to-tal sales, sales
growth)
44 %
Market share 47 % Reputation 30 %
Return on
assets 40 %
S tr at eg ic b u si -n es s u n
it Sales-based 68 %
Market share 46 %
Performance relative to
com-petitors
50 %
Return on
investment 47 %
Perceived
over-all performance 33 %
In te r-o rg an iz a-ti o n u n it
Sales-based 62 % Productivity 44 %
Perceived
over-all performance 71 %
Proitability 31 % Market share 33 %
T
o
ta
l
Sales-based 52 % Market share 44 % Perceived
over-all performance 47 % Return on
assets 29 % Productivity 20 %
Performance relative to
com-petitors
20 %
Proitability 26 %
In reference to the above studies, the we performed inancial performance assessments of irms implementing the IPO on the Czech capital market using performance measures shown
in Table 2. When selecting the measures, it was necessary to take into account the character of input data, their availability, and the possibility to compare them to the results attained by
Tab. 2 – Financial Performance Measures Commonly. Source: Marek (2009) and Synek
(2000)
Financial Performance
Measures Deinition of the measure
Change in sales compared to
the base year, in %
(1) 100 0 u t n t Sales Sales
Sales=Revenues of goods sold + Revenues of products and
services sold
Change in Net Proit com
-pared to the base year, in % (2) Pr 100 Pr 0 u t n t ofit Net ofit Net
Return on Assets (ROA),
in %
(3) u100
Assets EBIT
EBIT = Earnings before Taxes + Interest
Return on Equity (ROE),
in %
(4) u100 Equity
EAT
EAT = Earnings before Taxes
Change in Basic Earnings per Share compared to the
base year (EPS), in %
(5) 100 0 u t n t Share per Earning Share per Earning
EPS = Result for the period
EPS = Result for the period attributable to the Group and
to ordinary shareholders / Weighted average number of ordinary shares
Change in Labour Produc-tivity compared to the base
year, in %
(6) 100 Pr Pr 0 u t n t oductivity Labour oductivity Labour
Labour Productivity = Sales/
Labour Productivity = Sales/ Weighted average number of
employees Change in Weighted
Aver-age Number of employees compared to the base year,
in % (7) 100 0 u t n t Employees of Number Average Weighted Employees of Number Average Weighted
The development of absolute inancial performance measures (sales, earning after taxes, earn -ings per share, labour productivity, weighted average number of employees) is evaluated using
the horizontal analysis method. A change is expressed by the base index. Base indices compare values of a certain inancial performance measure from different periods with the value of the
same measure from always the same period selected, which is used as a basis for comparison. The base year is the year of IPO implementation (t=0). Absolute values of measures in the
IPO implementation year are expressed as 100 %, absolute values for the period of three years prior to, and three years after, IPO implementation (t=-3, -2, -1, 1, 2, 3) are then expressed as
The values of the measures given in Table 3 for a speciic irm in a respective year (t= -3, -2, -1, 0, 1, 2, 3) were also used to calculate the characteristic value for the entire period of investi-gation. For that purpose, methods of descriptive statistics were used, i.e. the arithmetic mean,
median, standard deviation and “risk adjustment”, which takes into account the magnitude of luctuation of annual values of individual performance measures over the seven-year period. Šiška and Lízalová (2011) recommend that the risk projection be accomplished by the follow
-ing modiication of the measure’s arithmetic mean (1):
(8)
1 _ _
V
Value Avg Indicator
Adj , where
σ standard deviation of the measure’s values over the period t= -3, -2, -1, 0, 1, 2, 3; Avg arithmetic mean of the measure’s values over the period t= -3, -2, -1, 0, 1, 2, 3. If the measure’s values in all the years of investigation are identical, then the luctuation rate expressed by the standard deviation will be zero and the Adj_Indicator will equal the arithmetic
mean of the values. If, however, a measure’s values show wide year-to-year luctuations over
the period of investigation, then the standard deviation in the denominator will increase the
nominator’s value, and the Adj_Indicator will attain appropriately lower values than the
arith-metic mean (Šiška and Lízalová, 2011).
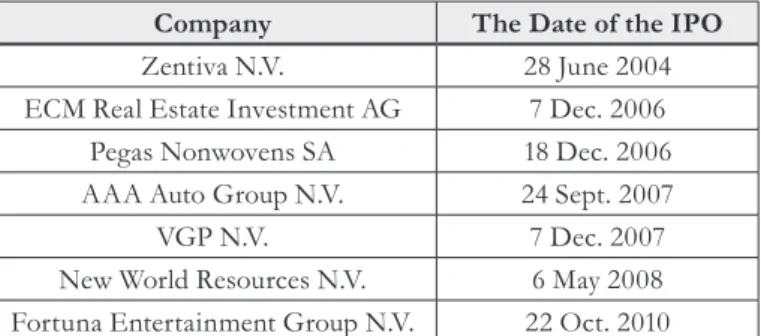
Using the measures selected, inancial performance is analyzed in a set of six irms that im
-plemented the IPO strategy within the modern history of the Czech capital market (Table 3). Those six share-holding corporations and Fortuna Entertainment Group N.V. represent our
basic set of issuers. Essentially complete and comparable accounting data published in annual
reports and/or in issuers’ prospectuses are available for all of the irms with the exception of the Fortuna Company (which issued its shares in 2010) and their respective inancial perform -ance can thus be subjected to an appropriate analysis. If some other than the Czech currency
was used in inancial statements, the Czech National Bank exchange rate of 31 December of
the corresponding year was used to convert values of individual measures.
Tab. 3 – The sample of IPOs on the Czech capital market, 2004–2011. Source: Prague Stock Exchange (August 2011)
Company The Date of the IPO
Zentiva N.V. 28 June 2004
ECM Real Estate Investment AG 7 Dec. 2006
Pegas Nonwovens SA 18 Dec. 2006
AAA Auto Group N.V. 24 Sept. 2007
VGP N.V. 7 Dec. 2007
New World Resources N.V. 6 May 2008
Fortuna Entertainment Group N.V. 22 Oct. 2010
In the text below, a comparison is made between performance of companies that implement-ed the IPO strategy on the Czech capital market and the results of companies that enterimplement-ed the
compara-tive analysis results must make provision for the fact that time series data from European
markets go only until 2007 and thus do not relect the impact of the economic crisis on the issuers’ performance. The data used for inancial performance assessment of issuers on the Prague Stock Exchange (PSE), on the other hand, included also data affected by the impact of
the economic crisis.
Comparison was made using methods of descriptive statistics (arithmetic mean, median). For
data processing, Microsoft Excel software was used.
3. RESULTS
3.1 Sales
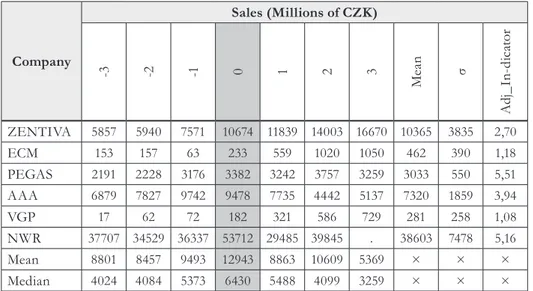
It follows from Tables 4 and 5 that pre-IPO sales in almost all of the companies monitored were growing, although at different rates. The post-IPO development was different. In some
companies, sales showed a signiicant increase compared to the previous year’s igures (ECM,
VGP, Zentiva), in other companies the sales showed a slight decrease (PEGAS) or even a
marked slump (AAA, NWR). Low values of adjusted arithmetic means suggest major luctua -tions of sale levels in all of the companies.
Looking at the course of sales reported by the companies monitored as a whole on the basis of
the mean and median values, we can note a signiicant increase in sales in the pre-IPO period and a subsequent signiicant decrease in the post-IPO period.
Tab. 4 – Sales of issuer companies. Source: own elaboration
Company
Sales (Millions of CZK)
-3 -2 -1 0 1 2 3
Me
an σ
A
d
j_
In
-d
ic
at
o
r
ZENTIVA 5857 5940 7571 10674 11839 14003 16670 10365 3835 2,70
ECM 153 157 63 233 559 1020 1050 462 390 1,18
PEGAS 2191 2228 3176 3382 3242 3757 3259 3033 550 5,51
AAA 6879 7827 9742 9478 7735 4442 5137 7320 1859 3,94
VGP 17 62 72 182 321 586 729 281 258 1,08
NWR 37707 34529 36337 53712 29485 39845 . 38603 7478 5,16
Mean 8801 8457 9493 12943 8863 10609 5369 × × ×
Median 4024 4084 5373 6430 5488 4099 3259 × × ×
Tab. 5 – Horizontal analysis of issuer companies’ sales. Source: own elaboration Company Horizontal analysis of sales (IPO implementation year =100 %)
ZENTIVA 55% 56% 71% 100% 111% 131% 156%
ECM 66% 67% 27% 100% 239% 437% 450%
PEGAS 65% 66% 94% 100% 96% 111% 96%
AAA 73% 83% 103% 100% 82% 47% 54%
VGP 9% 34% 40% 100% 177% 323% 401%
NWR 70% 64% 68% 100% 55% 74% .
Mean 68% 65% 73% 100% 68% 82% 41%
Median 63% 64% 84% 100% 85% 64% 51%
It follows from Table 6 and the Fig. 1 that sales of issuers on major European stock exchanges showed continuous growth over the monitoring period. The irms that used one of those
markets for the initial public offering of their stock doubled their sales within three years of
IPO implementation. Issuers who chose Borsa Italiana to go public were an exception. Their sales median three years after the IPO was around 121 % of the base year level. Compared with the developments on the main European stock exchanges, the situation on the Prague Stock Exchange seems the least favourable. The median of issuers’ sales on the PSE market was less than 51% of the base year level three years after the IPO. At this point it is necessary to
emphasize the earlier-mentioned marked differences in the development of that performance
measure between individual irms.
Tab. 6 – Comparison of sales medians of irms that entered the main European stock ex
-changes and the Prague Stock Exchange (IPO base year=100 %). Source: Paleari et al. (2008) and authors’ own elaboration
Stock exchange Annual periods before and after IPO implementation No. of irms
- - -1 0 1
LSE/Oficial List 63% 70% 81% 100% 128% 161% 202% 385
LSE - AIM 70% 81% 92% 100% 119% 170% 208% 1578
Euronext 48% 51% 63% 100% 131% 172% 208% 905
Deutsche Börse 41% 46% 60% 100% 150% 190% 205% 564
Borsa Italiana 50% 63% 80% 100% 107% 117% 121% 204
PSE 63% 64% 84% 100% 85% 64% 51% 6
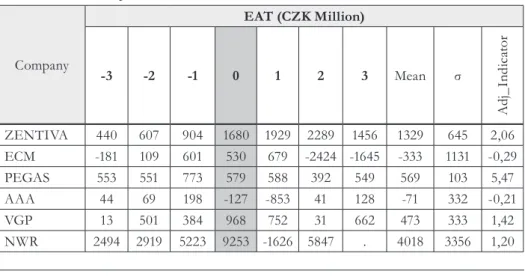
3.2 Net proit or loss
It follows from Tables 7 and 8 that pre-IPO net proit (deined as EAT) in a majority of the monitored irms increased signiicantly. In the year of IPO implementation, however, irms
began to differentiate with respect to results of their economic performance. One group were
after IPO, all the monitored companies reported a major drop in proit compared with the base year, or experienced operating loss (with the exception of AAA which showed proit for the irst time two years after IPO). Low, or, in some cases, negative values of the adjusted arithme
-tic mean suggest, as in the case of sales above, major luctuations of values of the monitored
measure in all of the companies.
Fig. 1 – Sales of issuer companies (IPO implementation year =100 %). Source: Paleari et al. (2008) and authors’
own elaboration
The mean and the median values of EAT of the companies monitored reached their maxima a year after IPO implementation, which underscores the sizeable increases in net proit in the
pre-IPO period, and its slump in the post-IPO period.
Tab. 7 – EAT Development. Source: own elaboration
Company
EAT (CZK Million)
- - -1 0 1 Mean σ
A d j_ In d ic at o r
ZENTIVA 440 607 904 1680 1929 2289 1456 1329 645 2,06
ECM -181 109 601 530 679 -2424 -1645 -333 1131 -0,29
PEGAS 553 551 773 579 588 392 549 569 103 5,47
AAA 44 69 198 -127 -853 41 128 -71 332 -0,21
VGP 13 501 384 968 752 31 662 473 333 1,42
NWR 2494 2919 5223 9253 -1626 5847 . 4018 3356 1,20
0% 50% 100% 150% 200% 250%
-3 -2 -1 0 1 2 3
Annual pe riods be fore and afte r IPO im ple m e ntation
S a le s o f is s u e r c o m p a n ie s ( IP O i m p le m e n ta ti o n y e a r = 1 0 0 % )
Mean 561 793 1347 2147 245 1029 230 × × ×
Median 242 526 687 774 634 217 549 × × ×
Tab. 8 – Horizontal analysis of issuer companies’ EAT. Source: own elaboration Company Horizontal analysis of EAT (IPO implementation year =100 %)
ZENTIVA 26,19% 36,13% 53,81% 100,00% 114,82% 136,25% 86,67%
ECM loss 20,49% 113,34% 100,00% 128,21% loss loss
PEGAS 95,44% 95,26% 133,46% 100,00% 101,64% 67,68% 94,86%
AAA × × × Loss × × ×
VGP 1,29% 51,75% 39,70% 100,00% 77,63% 3,21% 68,33%
NWR 26,96% 31,55% 56,44% 100,00% × 63,19% .
Average 26,10% 36,91% 62,73% 100,00% 11,41% 47,94% 10,71%
Median 31,31% 68,03% 88,76% 100,00% 81,95% 27,99% 70,99%
With the exception of issuers listed on the main market of the London Stock Exchange, issuer companies listed on most of the other stock exchange markets analyzed (Euronext, Borsa Ital
-iana, PSE) suffered a decrease in their net proits after IPO implementation. Companies listed on Deutsche Börse reported operating loss compared with the pre-IPO period, and companies
listed on LSE-AIM had a loss throughout the period of monitoring.
Tab. 9 – Comparison of EAT medians of irms that entered the main European stock ex
-changes and the Prague Stock Exchange (IPO base year=100 %). Source: Paleari et al. (2008) and authors’ own elaboration
Stock ex-change
Annual periods before and after IPO implementation
No. of
irms
-3 -2 -1 0 1 2 3
LSE/Of-icial List 31,40% 41,83% 52,76% 100,00% 131,25% 158,97% 180,48% 385
LSE
- AIM × × × × × × × 1578
Euronext 25,23% 37,57% 56,58% 100,00% 110,72% 88,92% 73,24% 905
Deutsche
Börse 56,72% 63,68% 125,87% 100,00% × × × 564
Borsa
Italiana 28,73% 54,51% 66,97% 100,00% 97,77% 68,67% 64,77% 204
Fig. 2 – EAT of issuer companies (IPO implementation year =100 %). Source: Paleari et al. (2008) and authors’
own elaboration
3.3 ROE and ROI
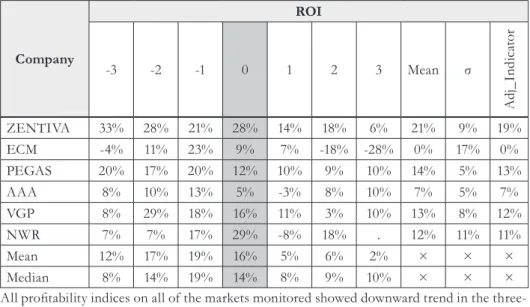
If we assess the developments in each of the monitored companies individually on the basis of their
ROE and ROI, then we see that the proitability of Zentiva, Pegas, VGP and NWR two and/or
three years after IPO was at a lower level compared with values reported for the IPO base year, the
AAA company had managed to restore its proitability and ECM operated at a signiicant loss.
Return on equity (ROE) and return on investment (ROI) of the companies as a whole meas-ured on the basis of the mean and median values show upward trend in the pre-IPO period and
a subsequent signiicant fall (the mean) or a slight decrease (median) in the post-IPO period.
Tab. 10 – ROE and ROI Development. Source: own elaboration
Company
ROE
-3 -2 -1 0 1 2 3 Mean σ
A
d
j_
In
d
ic
at
o
r
ZENTIVA 53% 42% 38% 24% 20% 19% 12% 30% 14% 26%
ECM -31% 15% 44% 16% 17% -97% -206% -34% 82% -19%
PEGAS 25% 20% 21% 27% 24% 15% 18% 21% 4% 21%
AAA 60% 41% 40% -11% -367% 20% 34% -26% 141% -11%
VGP 18% 88% 32% 28% 18% 1% 15% 29% 26% 23%
NWR 6% 8% 52% 54% -11% 29% . 23% 24% 19%
Mean 22% 36% 38% 23% -50% -2% -25% × × ×
Median 21% 30% 39% 25% 18% 17% 15% × × ×
0,00% 100,00% 200,00%
-3 -2 -1 0 1 2 3
Annual periods before and after IPO implementation
E
A
T
o
f
is
s
u
e
r
c
o
m
p
a
n
ie
s
(
IP
O
i
m
p
le
m
e
n
ta
ti
o
n
y
e
a
r
=
1
0
0
%
) LSE / Official List
Euronext
Deutsche Börse
Borsa Italiana
Company
ROI
-3 -2 -1 0 1 2 3 Mean σ
A
d
j_
In
d
ic
at
o
r
ZENTIVA 33% 28% 21% 28% 14% 18% 6% 21% 9% 19%
ECM -4% 11% 23% 9% 7% -18% -28% 0% 17% 0%
PEGAS 20% 17% 20% 12% 10% 9% 10% 14% 5% 13%
AAA 8% 10% 13% 5% -3% 8% 10% 7% 5% 7%
VGP 8% 29% 18% 16% 11% 3% 10% 13% 8% 12%
NWR 7% 7% 17% 29% -8% 18% . 12% 11% 11%
Mean 12% 17% 19% 16% 5% 6% 2% × × ×
Median 8% 14% 19% 14% 8% 9% 10% × × ×
All proitability indices on all of the markets monitored showed downward trend in the three-year post-IPO period. In this respect, we must underline the signiicantly higher proit rates
of companies listed on the PSE in comparison with those achieved on the rest of the markets
analyzed. Companies listed on LSE-AIM and Deutsche Börse operated at a loss in the
post-IPO period and their return rates are therefore negative.
Tab. 11 – Comparison of ROE and ROI medians of irms that entered the main European stock exchanges and the Prague Stock Exchange (IPO base year=100 %). Source: Paleari et al. (2008) and authors’ own elaboration
Stock exchange ROE No. of
irms
-3 -2 -1 0 1 2 3
LSE/Oficial List 16% 21% 15% 10% 10% 10% 9% 385
LSE - AIM 17% 18% 15% 2% -6% -3% -3% 1578
Euronext 15% 17% 19% 14% 12% 10% 8% 905
Deutsche Börse 16% 24% 16% 2% -3% -10% -4% 564
Borsa Italiana 8% 12% 13% 8% 7% 6% 5% 204
PSE 21% 30% 39% 25% 18% 17% 15% 6
Stock exchange ROI No. of irms
-3 -2 -1 0 1 2 3
LSE/Oficial List 4% 6% 5% 5% 6% 4% 4% 385
LSE - AIM -2% -1% -1% -3% -7% -6% -4% 1578
Euronext 4% 4% 5% 5% 4% 3% 2% 905
Deutsche Börse 3% 3% 3% 1% -2% -7% -4% 564
Borsa Italiana 2% 3% 4% 3% 3% 2% 2% 204
3.4 Other measures of performance
The following are other (complementary) measures chosen for performance evaluation of companies that implemented their IPOs on the PSE:
weighted average number of employees, labour productivity, and
earnings per share (EPS).
Because of data unavailability, no comparison between the developments in these measures
and results attained on the major European stock exchanges was possible. Their values will
nonetheless help complement the already collected results on performance trends of issuers under Czech capital market conditions.
From the data on weighted average number of employees it follows that the number of
employees increased in the post-IPO period in most of the companies monitored. Signiicant
increases compared with the IPO implementation year were observed in Zentiva, ECM and Pegas. By contrast, a marked decrease in the number of employees compared with the IPO implementation year (to about one third of the original number) occurred in AAA, and NWR
reduced its staff by 13 %. The means and median values of the measure for the market as a whole are signiicantly inluenced by the high weight of the latter companies.
Tab. 12 – Horizontal Analysis of the Weighted Average Number of Employees. Source: own elaboration
Company Horizontal Analysis of the Weighted Average Number of Employees (IPO implementation year =100 %)
ZENTIVA . 48% 67% 100% 118% 162% 210%
ECM 37% 34% 36% 100% 209% 280% 202%
PEGAS 91% 95% 102% 100% 117% 117% 117%
AAA 46% 53% 75% 100% 38% 29% 33%
VGP 38% 38% 50% 100% . . .
NWR 120% 114% 105% 100% 92% 87% .
Mean 112% 96% 95% 100% 34% 7% 49%
Median 19% 53% 70% 100% 57% 49% 52%
Labour productivity in some of the companies monitored decreased in the post-IPO imple-mentation period (Zentiva, Pegas, NWR). On the other hand, companies AAA and ECM were able to double their labour productivity following their initial public offering. Mean values of
labour productivity of all irms monitored show downturn trend in the post-IPO period, the
median of the measure remained at almost the same level for three years after IPO implemen-tation.
Tab. 13 – Horizontal Analysis of the Labour Productivity. Source: own elaboration Company Horizontal Analysis of the Labour Productivity (IPO implementation year =100 %)
ZENTIVA . 115% 106% 100% 94% 81% 74%
ECM 175% 195% 74% 100% 114% 156% 222%
PEGAS 71% 69% 92% 100% 82% 95% 82%
AAA 159% 155% 137% 100% 217% 163% 163%
VGP 25% 91% 79% 100% . . .
NWR 59% 56% 65% 100% 60% 86% .
Mean 57% 93% 89% 100% 64% 67% 57%
Median 85% 119% 108% 100% 102% 88% 104%
Data in Table 14 clearly show differences in earnings per share (EPS) between the companies monitored in the post-IPO period. While companies like Zentiva, Pegas and VGP repeatedly reported often even a sharp drop in their EPS in the three-year post-IPO period and the ECM
Company even suffered a signiicant loss in its EPS, the AAA Company revealed a more than
seven-fold increase in the value of this measure. Three years after IPO implementation, the
EPS median of the companies monitored was less than 77 % of the base year value.
Tab. 14 – Horizontal Analysis of Earnings per Share. Source: own elaboration
Company Horizontal Analysis of Earnings per Share (IPO implementation year =100 %)
ZENTIVA . 32% 54% 100% 110% 129% 83%
ECM . . . 100% 83% × ×
PEGAS . . 57% 100% 9% 6% 9%
AAA . . 144% 100% × 2284% 7109%
VGP . . 49% 100% 78% 3% 68%
NWR . . 56% 100% × 60% .
Mean . . 54% 100% 31% × 12%
Median . . 50% 100% 93% 66% 77%
4. DISCUSSION
Table 15 shows trends exhibited by the monitored measures on individual stock exchange mar
-kets. We may observe that post-IPO performance of companies:
grows on most capital markets with the exception of the PSE if changes in sales are
used for evaluation;
decreases on most capital markets with the exception of the LSE if changes in operat-ing proit or loss are used for evaluation;
decreases on all capital markets if return on equity (ROE) is used for evaluation; decreases or stagnates on all capital markets if return on investment (ROI) is used for evaluation.
a)
b)
A decrease or stagnation in issuers’ performance in the post-IPO period are also signalled by other measures of inancial performance which, however, were calculated only for irms that
had implemented the IPO strategy on the Czech capital market because other data were not available.
The theory formulated by Loughran and Ritter (1995) says that companies do not enter the capital market when they have a high growth potential and need to raise additional funding,
but at the time when existing shareholders think it advantageous has been corroborated by the results of research conducted on selected capital markets.
Tab. 15 – Summary of results – development trends of individual measures on stock exchange
markets. Source: own elaboration
Measure
Development trends in measures on stock exchange markets (median values)
LSE LSE-AIM Euronext Deutsche
Börse Borsa Italiana PSE p re - I P O p o st - I P O p re -I P O p o st - I P O p re -I P O p o st - I P O p re -I P O p o st - I P O p re -I P O p o st - I P O p re -I P O p o st - I P O
Sales ↑ ↑ ↑ ↑ ↑ ↑ ↑ ↑ ↑ ↑ ↑ ↓
EAT ↑ ↑ loss loss ↑ ↓ ↑ loss ↑ ↓ ↑ ↓
ROE ↑ ↓ ↑ neg. ↑ ↓ ↑ loss ↑ ↓ ↑ ↓
ROI ↑ ↓ neg. neg. ↑ ↓ → ↓ → → ↑ ↓
No. of employees (weighted average) . . . ↑ ↓ Labour
pro-ductivity . . . ↑ →
Net income
per share . . . ↑ ↓
Note: symbol ↑ represents upward trend, symbol ↓ represents downward trend, symbol → represents invariable trend, symbol . means that the datum is either unknown or not available.
An analysis was performed of selected measures of inancial performance over a period of sev -eral years (three years prior to the IPO, three years after the IPO and the IPO implementation year). Given the length of the period analyzed, conclusions of the analysis can be considered relatively reliable. However, three problematic aspects need to be borne in mind:
under the conditions of the Czech capital market conclusions are drawn from
perform-ance data of only six irms. Moreover, their inancial performperform-ance was strongly volatile, as evidenced by values of corresponding standard deviations and of the so-called “risk cleaning”;
performance of companies under the conditions of other capital markets was evaluated on
the basis of only four performance measures, other measures could not be quantiied and included in evaluation because of data unavailability;
only median values of individual measures of issuers’ inancial performance were used for
company performance evaluations.
The analysis exclusively focused only on book proit, i.e. the foremost interest of the owners in generating economic proit was not taken into account.
All the conclusions outlined above can be considered as the starting point for further research into the performance of IPO-implementing companies in the following areas:
a broader sample size of companies analyzed to include new issuers on the Czech capital market,
research into company performance on other capital markets of the CEE region (with a preference given to the Polish market in view of its importance),
evaluation of company performance on the basis of the economic added value (EVA) measure.
5. CONCLUSION
The aim of the study presented was to consider the relevance of one of the theories proposing
to explain underperformance of post-IPO companies under the conditions of Czech capital
markets, and to compare the data collected with the performance of companies that entered
the main European stock exchanges. According to the theory proposed by Loughran and Rit
-ter (1995), companies do not en-ter the capital market when they have a high growth potential and need to raise additional capital, but at the time when the company’s existing shareholders think it advantageous. Existing shareholders try to enter the capital market at the time when their company enjoys very good inancial results, reports maximum operational performance,
and the sector in which it operates is at the peak of its growth. They assume that investors will be positively inclined with respect to true value of the issuing company.
To gauge companies’ inancial performance on selected capital markets, a total of seven per
-formance measures of inancial analysis were chosen in accordance with recommendations
published in relevant literature. Two of them are from the group of relative measures (ROE,
ROI), the other ive belong among absolute measures. Data on inancial performance of in
-dividual companies were obtained from issuing companies’ prospectuses and their annual re -ports, and they were processed by horizontal analysis and descriptive statistical methods using
Microsoft Excel software.
It follows from the research results that the phenomenon of underperformance of newly listed
companies can be identiied both on the main European stock exchanges and under conditions
of the Czech capital market.
Analytical results can corroborate the theory of lower performance of companies following their entry onto the capital market. Generalization of the results is, however, hampered by the fact that the Czech capital market can offer data on a small number of companies only. Avail-ability of performance data about companies from other capital markets is also rather limited for comparison purposes.
2.
3.
In spite of the above reservations, the indings presented here can be considered a contribution to a better understanding of inancial performance of post-IPO companies, especially under the speciic conditions of one of the CEE region markets.
References
Brau, J. C., Fawcett, S. E. (2006). Initial Public Offerings: An Analysis of Theory and Prac
-tise. Journal of Finance, 61 (1), 399−436.
Hult, G. T. M. et al. (2008). An assessment of the measurement of performance in interna
-tional business research. Journal of Interna-tional Business Studies, 39, 1064-1080.
Khursher, A., Paleari, S., & Vismara, S. (2005). The Operating Performance of Initial Public
Offerings: The UK Experience. Universita di Bergamo Working Paper. Retrieved from http://
ssrn.com/abstract=439240.
Loughran, T., & Ritter, J., R. (1995). The New Issues Puzzle. Journal of Finance, 50 (1), 23−51.
Marek, P. et al. (2009). Studijní průvodce inancemi podniku (2nd ed.). Praha: Ekopress.
Meluzín, T., & Zinecker, M. (2009). IPO Prvotní veřejná nabídka akcií jako zdroj inancování rozvoje
podniku (1st ed.). Brno: Computer Press.
Paleari, S. et al. (2006). Academic EurIPO Fact Book 2006 (1st ed.). Bergamo: Universoft. Ritter, J., R. (1991). The long-run Performance of Initial Public Offerings. Journal of Finance,
46 (1), 3−27.
Ritter, J., R. (2010). Returns on IPOs during the ive years after issuing, for IPOs from 1970-2008. Retrieved from http://bear.warrington.ul.edu/ritter/IPOs2009-5years.pdf
Sedláček, J. (2001). Účetní data v rukou manažera (2nd ed.). Praha: Computer Press. Synek, M. (2003). Manažerská ekonomika (3rd ed.). Praha: Grada Publishing.
Šiška, L., & Lízalová, L. (2011). Výběr ekonomických ukazatelů pro měření dlouhodobé
výkonnosti podniku. Journal of Competitiveness, (1), 4−14.
Teoh, S., H., Welch, I., & Wong, T., J. (1998). Earnings management and the long-run per
-formance of initial public offerings. Journal of Finance,53(6), 1935–1974.
Welch, I. (2006). A First Course in Finance. Retrieved from http://welch.econ.brown.edu/
book/.
IPO - Prospectuses and Annual Reports of:
AAA Auto (2011). Prospectus. Retrieved from
http://www.aaaauto.cz/cz/hospodarske-vys-ledky/articles.html?c=10
ECM Real (2011). Prospectus. Retrieved from
http://www.ecm.cz/Investori/Korporatni-dokumenty/Vyrocni-inancni-vysledky.aspx
NWR (2011). IPO Prospectus. Retrieved from http://phx.corporate-ir.net/phoenix. zhtml?c=221913&p=irol-annualreview
Pegas (2011). Prospectus. Retrieved from http://www.pegas.cz/default.
asp?nLanguageID=2
VGP (2011). Prospectus. Retrieved from http://www.vgp.cz/investors/inancial-results/ Zentiva (2011). Prospectus. Retrieved from http://www.zentiva.cz/pages/default.aspx
1.
2.
3.
4. 5.
6.
7. 8.
9.
10. 11. 12.
13.
14.
1.
2.
3.
4.
5.
Contact information
doc. Ing. Tomáš Meluzín, Ph.D., doc. Ing. Marek Zinecker, Ph.D. Brno University of Technolog y, Faculty of Business and Management Kolejní 2906/4, 61200 Brno
E-mail: meluzint@fbm.vutbr.cz E-mail: zinecker@fbm.vutbr.cz