Beach response to high
energy wave climate.
A case study in the
portuguese west coast
Jorge Manuel do Rosário Trindade
Centro de Estudos Geográficos Faculdade de Letras da Universidade de Lisboa [email protected]
Ana Paula Ribeiro Ramos-Pereira
Centro de Estudos Geográficos Faculdade de Letras da Universidade de Lisboa [email protected]
Mário Rui Nunes Neves
Centro de Estudos Geográficos Faculdade de Letras da Universidade de Lisboa [email protected]
Territoris (2007-2008), 7: 21-38
BEACH RESPONSE TO HIGH ENERGY
WAVE CLIMATE. A CASE STUDY IN THE
PORTUGUESE WEST COAST
Jorge Manuel do Rosário Trindade Ana Paula Ribeiro Ramos-Pereira Mário Rui Nunes Neves
ABSTRACT: Portugal’s western coast is a wave-dominated rocky coast with a semidiurnal mesotidal regime. The
wave climate is highly conditioned by the Atlantic Ocean’s atmospheric circulation, which results in a seasonal change in wave patterns. Storms are frequent during winter and can reach 10-m wave heights with a 5-year recurrence period. Four profile monitoring campaigns were carried out in December 2005, January and May 2006 using a dGPS and a total station to evaluate the response of three different beach systems to high wave climate events, comparing pre-storm wave, morphology and sediment characteristics with the modifications induced in the system after the storm event. A series of 64 beach profiles is analysed in terms of sediment textural properties, volume, slope, surf similarity index and dimensionless fall velocity parameters’ variability. Each beach system’s modal and limit morphological behaviours are established according to Wright and Short’s morphodynamic model.
KEY WORDS: Beach profile, storm event, system morphodynamic range.
RESUMEN: La costa oeste de Portugal es una costa rocosa dominada por olas y con un régimen mesomareal
semidiurno. El clima marítimo está altamente condicionado por la circulación atmosférica del océano Atlántico y presenta una variabilidad estacional en el régimen de oleaje. Las tormentas son frecuentes durante el invierno y pueden alanzar alturas de ola de 10 m con una recurrencia de 5 años. Se han hecho cuatro campañas de control en tres playas, mediante el uso de GPS diferencial y estación total con el objetivo de evaluar su respuesta a sendos episodios de alta energía. Se comparan los cambios en la morfología y en la textura sedimentaria antes y después de cada temporal. Para ello se realizaron 64 perfiles de playa y se han analizado las variaciones en la textura del sedimento, el volumen, la pendiente, el índice de surf similarity y el parámetro adimensional de caída del sedimento. Con todo ello ha podido establecerse el comportamiento morfológico modal y extremo de dichas playas según el modelo de Wright y Short.
PALABRAS CLAVE: Perfiles de playa, temporales, variaciones del sistema morfodinámico.
1. Introduction
Beach environments are the result of several forcing factors which act per-manently changing profile morphology and beach shape. Waves, tides and sediment properties are amongst the main factors that explain those changes. Whilst beach mo-phodynamics can be defined through seasonal cycles, the dramatic changes occur frequently during high energy events. These changes are very significant for local communities because of the important damage costs, namely in beach facilities.
The magnitude of morphological changes in wave dominated exposed beach systems are closely related to the capacity of the outer bar sub-system to absorb and dissipate wave energy before it reaches beach face. This capacity can be exceeded if the frequency of storm occurrence over-comes the time needed for the system recovery.
The aim of this work is to evaluate the response of Sta. Rita, Azul and Foz do Lizandro beaches to high wave climate events through morphosedimentary va-riability analysis and to establish modal and limit morphological behaviours of this systems.
2. Study site framework
The western coast of Portugal, between Peniche and Cascais, is a wave dominated rocky coast with a semi-diurnal mesotidal regime. Tidal wave propagates northwards and reaches its maximum amplitude at circa 4m. The Cascais tidal gauge data shows that in 1998 the extreme water levels reached 4,030m and the mean spring tide amplitude was 3,075m (Fig. 1). Wave climate is highly conditioned by the Atlantic Ocean atmos-pheric circulation resulting in a seasonal change of the wave patterns. Northwest
dominant wave patterns along the coast occur in 265 days of the year (Costa, 1994) and the mean offshore significant wave height is 2,5m in winter and 1,0m in summer (Oliveira Pires, 1989). Carvalho (2004), used the wave numeric model MAR3G (Oliveira Pires & Carvalho, 1996) and applied it to a 1998/2001 ocean-atmospheric climate data series. He estimated 8 storms/year in the west-central coast of Portugal with wave heights above 4m, mostly between October and April. The main directions of high wave climate found by Carvalho (2004) were W (67,3%) and NW (27,4%). Considering storms with wave heights over 6m, the W direction was found in 89,3% of the occurrences. However, storm waves from SW are less frequent but they usually have a higher magnitude and can reach heights of 10 – 12m (Pereira, 1999; Taborda et al, 1992). Extreme wave heights above 10m can be reached with a recurrence period of 5 years (Carvalho, 1992).
Coastal drift is usually directed to the south along the West coast, although Pereira (1991) refers that in cases of strong SW wave climate the southwards coastal drift may invert locally its direction. Several field and numerical based estimates of longshore transport rate in the western coast of Portugal have been made a range between 1,0 x10⁶and 2,3x10⁶m3/year (Oliveira et al,
1982; Bettencourt, P. & Ângelo, C., 1992; Taborda, 1993; Vidinha et al, 1997; Larangeiro, 2002). Most of those estimates are related to the central-northern sector of the Portuguese coast, between Nazaré and Oporto (Fig. 2).
The coastline between Peniche and Cascais is a limestone cliff dominant with a lack of sediment supply from local sources and from longshore drift sediment dynamics. Southwards longshore drift is interrupted by the submerged Nazaré canyon and by the Peniche headland (Fig. 2).
Beach response to high energy wave climate...
High (m) Low (m)
esT 4,030 0,070
msT 3,672 0,597
mnT 2,902 1,447
The Peniche – Cascais continental shelf, between 0m and -50m, is mainly composed of rock outcrops and coarse sediment deposits with high levels of biogenic remains. Fine sands and muds are found in very confined and sheltered areas in the Ericeira sea. Therefore, local sediment sources are scarce due to (i) continental shelf morphology and deposits, (ii) little contribution from the small river basins (Pereira, 1987) and (iii) the carbonate nature of the rocks that constitute the cliff systems (Neves, 2004).
The exposed beach systems are narrow, embayed or associated with small infilled valleys as a result of the Holocene sea level rise, and their importance in the overall costal systems of the study area decrease southwards.
Three beach-dune systems, different in size and shape, but similar in the exposure to W stormy wave climate, were chosen to illustrate the beach-systems’ morpho-dynamics. They are also included in a monthly monitoring programme being held at the «Centro de Estudos Geográficos» for over two years.
Figure 1. Tidal range in the Cascais tide gauge (38º41’39,171’’N; 09º25’05,229’’W – heights above chart datum), 01-01-1998 / 31-12-1998. esT – extreme spring tide; msT – mean spring tide; mnT – mean neap tide; msl – mean sea level.
The Sta. Rita beach is a mixed beach-dune/beach-cliff system (Fig. 2-a). The beach-dune component of the system is 550m long and 150-200m wide, while the beach-cliff part is 1000m long and 100m wide. Foz do Lizandro beach (Fig. 2-c) is a beach-dune system 600m in length and
200m in width and has a very small dune field, highly damaged by human trampling. Azul beach (Fig. 2-b) is the largest beach-dune system, 1900m long and 975m wide and is the only one of the three affected by overwashes.
Trindade, J., Ramos-Pereira, A. y Neves, M. Beach response to high energy wave climate...
Figure 2. The study area. a – Sta. Rita beach; b – Azul beach; c – Foz do Lizandro beach; Le – Leixões offshore wave buoy; Sn – Sines offshore wave buoy.
A
B
C
3. Methodology
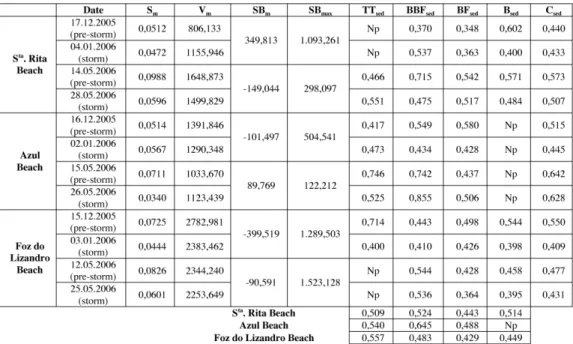
Four monitoring campaigns were carried out in pre-storm and right after storm conditions (December of 2005, January and May of 2006) on the tree beach systems, resulting in 64 survey profiles (table 1). The storm morphological and sediment para-meters measured 3 or 4 days after storm peaks in early January and late May are
considered representative of the local hydrodynamic influence in sediment transport during the high wave climate event.
Total station and dGPS units were used to measure emerged beach volumetric and morphometric changes. The differences between the two techniques prove to be negligible in this dynamic context (Trindade
programme, beach profile number and spacing were initially defined to record data from the beach face and berm morpho-dynamics.
Beach profiles are anchored in fixed points away from the hydrodynamic area, ensuring overlapping between campaigns (Trindade et al, 2006).
Beach morphodynamics was accessed by volume variability along each profile with an assumed width of 0,1m. The volume of each profile was calculated above mean sea level (msl) and below the point of no relative hydrodynamic sand movement, usually associated with the inland backshore or backshore/foredune limit (Ferreira, 1998; Baptista, 2006). The inland beach profile limits is not easy to establish and often it
corresponds to a boundary between marine and aeolian dynamics. This boundary point, that we can call a knick point, was accessed by the direct overlap of all the obtained beach profiles.
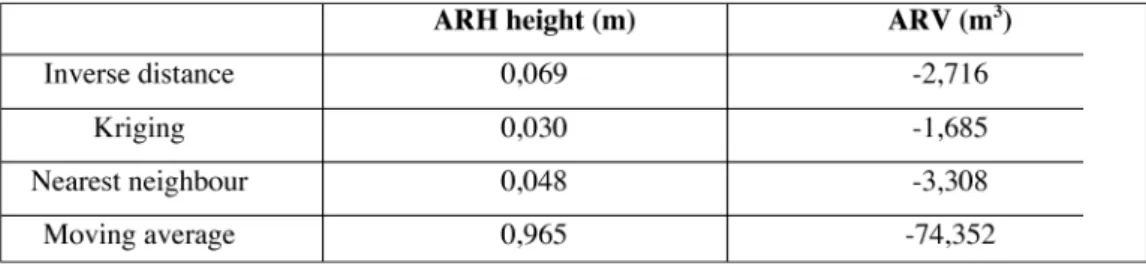
Several interpolation methods were tested with the field data of May campaign in order to calculate beach profile volume, namely inverse distance to a power of two, kriging, nearest neighbour and moving average. Test results expressed in Table 2 revealed that Kriging is the most accurate technique, with the lowest residual values both in height and volume calculations
(ARH = 0,300m; ARV = -1,685m3) and
therefore the most suitable for this campaigns profile volumetry.
Table 1. Monitoring campaigns.
Table 2. Residual values of height and volume. ARH – Average residual height; ARV – Average residual volume.
Trindade, J., Ramos-Pereira, A. y Neves, M.
Sedimentological analyses of beach sands were carried out with 44 samples (Table 1) taken from the berm, beach face, base of the beach face and low tide terrace (when existent) during each campaign, in order to evaluate grain size distribution and statistical parameters. Approximately 60g from each sample were washed, without calcium carbonate destruction, and dry sieved between -2,0φ (4,0mm) and 4,5φ (0,044mm), in 0,5φ intervals, and weighed with a 0,01g accuracy. The SEDMAC/-SEDPC worksheet (Henriques, 2004) was used to calculate the mean, standard deviation and skewness of each sample, according to the Method of Moments of Friedman and Sanders (1978).
Offshore wave significant (Hs) and maximum (Hmax) height, expressed in meters above chart datum (cd ≈ -2m msl), period (T) and wave direction (Hdir) were provided by the Leixões buoy, one of the two offshore wave buoys available on the west coast of Portugal (Fig. 2).
Wave breaker type and morphodynamic classification was accessed with widely used parameters, namely the surf similarity parameter or Iribarren Number (ξb) for
breaker wave conditions and the dimensionless fall velocity (Ω) (Masselink & Hegge, 1995; Benavente et al, 2002; Benedet, Finkl & Klein, 2004; Benedet, Finkl, Campbell & Klein, 2004; Goodfellow & Stephenson, 2005; Anfuso & Benavente, 2006).
The surf similarity parameter was calculated according to Battjes, 1974:
(1)
Where:
tanβ is the beach slope calculated from the average slope of the beach profiles, between the berm crest and the seaward
limit of the surveyed profile, in each campaign;
Hbis the breaker wave significant height, expressed in meters above cd, obtained from the Komar and Gaughan (1972) expression based on the Leixões offshore wave data:
Hb=0,39g0,2(T * H
o2)0,4 (2)
Where:
H0 is the offshore wave significant height, expressed in meters above cd;
0,39 is the empirical coefficient based on laboratory and field data from Munk (1949) and confirmed later as a good predictive coefficient by Weishar and Byrne (1978);
L0is the deep water wave-length which, based on linear wave theory, can be calculated as:
(3)
The Dimensionless fall velocity parameter (Ω) was calculated according to the Wright and Short (1984) formula:
(4)
Where:
ws is the sediment fall velocity,
expressed in m/s. Hallermeier (1981a,b) empirical formulas for ws were used to obtain the fall velocity of the sediment samples:
(6)
Where:
ρsis the sediment density (≈2,648 g/cm3
for quartz grains and ≈2,8 for shell material),
(ρs – ρ) g
ξb = tan β (Hb / L0)1/2
Beach response to high energy wave climate...
L0= gT2 2π Ω = Hb wsgT Ws=
[
ρ]
D501.1, for 39<A<104 (5) 0,7 A = (ρs – ρ) gD3 50 ρυ230-12-2005 – 16h 21-05-2006 – 06h to to 01-01-2006 – 21h 23-05-2006 – 12h Time (h) 53 54 Hs(m – cd) 3,89 3,67 Hmax(m – cd) 9,77 10,77 T (s) 8,54 8,38 Tmax(s) 21,10 18,80
ρ is the density of the seawater (≈1,026 g/cm3 at 15ªC – 33 ppt), υ is the seawater
kinematic viscosity (≈0,0119 cm2/s at 15ªC – 33 ppt), g is gravity acceleration (981cm/s) and D50 is the Passega (1957) sediment median size, in centimetres. The Hallermeier formulation for ws(eq. 5) was tested on previously published settling velocity measurements of sands with a diameter range between 0,125mm and 1.0mm.
The quartz/shell content of the samples was used to calculate the final result for the
weighted arithmetical mean of Ws,
concerning the different values of ρs. These types of dimensionless paramete-rizations are fully related to beach behavior and are useful tools to first access the range of beach morphodynamic states, but choosing the right parameters to calculate formulae is difficult due to the irregular nature of the beach system dynamics.
The range of values assumed for Ω in one system depend on the measured range of sediment size, which usually controls the intertidal slope, and on characteristics of incident waves which are the main driving factor of beach dynamics.
Incident wave can be described by the range of breaker types (ξb) that can occur
within a beach system, which are controlled by beach slope and wave height and length (Komar, 1998; Masselink & Hughes, 2003).
However, the beach is composed of several constant slope angles associated to the different dynamic subunits of the beach. Because the submerged profile is absent in this study, mean beach slope is calculated for the most dynamic areas of the beach profile, including berm crest, beach face and low tide terrace, when present.
4. Results
January and May campaigns were prece-ded by two high wave climate events recor-ded entirely or partially in the two existing wave buoys (Leixões and Sines). Despite the proximity to the study area, it was impossible to use data from the Sines buoy because of the several gaps registered in the January and late May records. This made it unable to correlate and interpolate the Sines data with the Leixões buoy to fulfil data loss.
The Leixões offshore wave data before the January 2006 monitoring campaigns was very similar to the May 2006 (Fig. 3). Mean
Hs values was 3,89m in January and 3,67m in May. T registered a range of 16,3s in January and 14,6s in May, reaching Tmax 21,10s and 18,80s at the maximum storm strength (Table 3). Hdirwas predominantly from the NW quadrant with resultant vectors
of 310º in January and 309º in May (Fig. 3) which usually means a strong southwards longshore drift in the western coast of Portugal. The registered Hdiris also perpen-dicular to the Sta. Rita and Azul beach
systems. The two high wave climate events lasted 53h (January) and 54h (May) and Hmax reached 9,77m and 10,77m, respec-tively (Table 3).
The morphodynamics of a beach system can be expressed in terms of the mean sediment budget (SBmin Table 4) which, in this study, is assumed to be the arithmetic
mean of the differences between the vo-lumes of all emerged beach profiles in each system and in two sequential campaigns. Mean volumes and the sediment budget variability (mean and maximum) between campaigns are expressed in Table 4.
Values of mean sediment budget va-riability between campaigns range from a maximum erosive sediment dynamics (-399,519 m/m3) in Foz do Lizandro beach to a maximum accretionary behaviour in Sta.
Rita beach (349,813m/m3), both registered in January data.
Beach response to high energy wave climate...
Trindade, J., Ramos-Pereira, A. y Neves, M.
Table 4. Slope, volume and mean sediment size in the three beach systems. Sm – slope (x 102 = %); Vm – mean volume (m/m3); SBm – mean sediment budget (m/m3); SBmax – maximum variability of sediment budget (m/m3); TTsed – mean sediment size of the tidal terrace (mm); BBFsed – mean sediment size of the base of the beach face (mm); BFsed – mean sediment size of the beach face (mm); Bsed – mean sediment size of the berm (mm); Csed – campaign average sediment size (mm); Np – not present.
Azul beach have the smallest variation in sediment budget variability. January erosion (-101,497 m/m3) is almost equivalent to May accretion (89,769 m/m3).
Differences in systems responses to the same energetic event can be measured also with maximum sediment budget variability (Table 4). The highest maximum budget value in January (1289,503 m/m3in Foz do
Lizandro beach) was 2,5 times higher than the value of Azul beach (504,541 m/m3). In
May this relation rose to 12,5 times showing the extreme differences in the morpho-dynamic responses of this systems.
Mean beach slope variability (Table 4) is lower in Azul beach (3,71%), similar in Foz do Lizandro beach (3,82%) and higher in Sta. Rita beach (5,16%).
The sediment collected during the four campaigns is characterised by middle medium to middle coarse sands (Table 4) with sizes that range from 0,348mm to 0,855mm. The low range of mean sand sizes, approximately 1,25Ø, may be asso-ciated to the high selectivity of the transport agent and to the homogeneity of the sediment source.
The December-January sediments are in average lower when compared to average sediment size from the May campaigns, exception made for Foz do Lizandro where overall mean sand size is slightly higher in December-January campaigns (Table 4).
Superior values of mean sand sizes can also be found in the tidal terrace (0,540mm in Azul beach and 0,557mm in Foz do Lizandro
Trindade, J., Ramos-Pereira, A. y Neves, M.
beach) and in the base of the beach face (0,524mm in Sta. Rita, 0,645mm in Azul
beach and 0,483mm in Foz do Lizandro beach). These morphological elements are placed were the wave breaker point moves back and forward during the high tide cycle, resulting in higher concentration of turbulence and wave energy dissipation. This differen-tiation is not clear in the beach face and in the berm where it would be expected a gradual decrease in the sediment size (Table 4).
Sand samples are moderately well sorted according to Friedman (1962) classification. Standard deviation shows little variation when all campaigns are analysed (0,616 – 0,779). Foz do Lizandro beach has the wider range in the sample dispersion measure (0,616 in the tidal terrace; 0,739 in the base of the beach face; 0,755 in the beach face; 0,733 in the berm) in contrast with Sta. Rita which reveals the highest homogeneity both in mean (Table 4) and standard deviation measures (0,695 in the tidal terrace; 0,722 in the base of the beach face; 0,745 in the beach face; 0,733 in the berm).
5. Discussion
Although a wave breaker type and beach profile continuum occur in natural beaches,
accessing wave breaker conditions and morphodynamic state of the beach by formula and models is essential in order to compare the systems response to high energy input during one or several episodes. According to Wright and Short (1984) _ classification (<1Ω reflective; 2Ω – 5Ω intermediate; >6Ω dissipative), the three beach systems lie between the dissipative and intermediate systems. The high wave climate events that occurred in January and May of 2006 (Fig. 4) are responsible for a general change in Sta. Rita, Azul and Foz do
Lizandro beach systems towards dissipative morphology (Fig. 4, Tables 5 and 6).
December – January results show that Sta. Rita evolved from low tide terrace with berm formation to quasi-dissipative behaviour. The general decrease in ξb values
(Table 5) from the pre-storm to storm conditions, especially due to Hb and L0 increase, reflects an amplification of wave energy dissipation along submerged profiles and an decrease in the energy’s reflection over the beach system, as closure depth moves away from the shoreline.
The same response was not observed in May campaigns (Fig. 4) as beach profile reached only rhythmic bar and beach behaviour. In fact, for similar offshore storm values (Fig. 3) Ω is much lower in May.
Beach response to high energy wave climate...
Table 5. Surf similarity index parameterization (ξb ), based on wave data from Leixões buoy.
SP – spilling breakers; SG – surging breakers.
ξb ξb
Field observations revealed the presence of one longshore bar in January whilst in May there were at least two bars present. According to Battjes (1974) classification, the wave type for the two high wave climate conditions was the spilling breaker, given as storm in Table 5. Spilling breakers are usually associated with steep incident waves (≈ Hb≥ Lb) and low gradient beach profiles that play a significant role in wave energy dissipation. The presence of multi-barred submerged profile and very well defined crescentic berms in Sta. Rita pre-storm May
morphology (Fig. 4) acted as a buffer to wave energy and to onshore sediment transport, restricting beach profile pro-gression towards fully dissipative behaviour. The differentiated Ω values for January and
May storm events are consistent with the maximum sediment budget variability expressed in Table 4, where higher variability of January storm (1.093,261m/m3) is contrasting with lower
May value (298,097m/m3). Further more,
sediment size variations across beach profile confirm this tendency. An increase in January mean sediment size between pre-storm and pre-storm data (Table 4) is noted on the base of the beach face and on the beach face (BBF – 0,370mm to 0,527mm; BF – 0,348mm to 0,363mm), which directly reflects a rise in the energetic levels. May results reveal the opposite tendency, with a decrease in mean sand size between pre-storm and pre-storm conditions.
Trindade, J., Ramos-Pereira, A. y Neves, M. Beach response to high energy wave climate...
Exception made for more energetic and/or durable storms it can be assumed that the intermediate morphodynamic state of longshore bar-trough is the limit response to high hydrodynamic events. The modal state of morphodynamic behaviour during low-energy wave climate was found to be the low tide terrace.
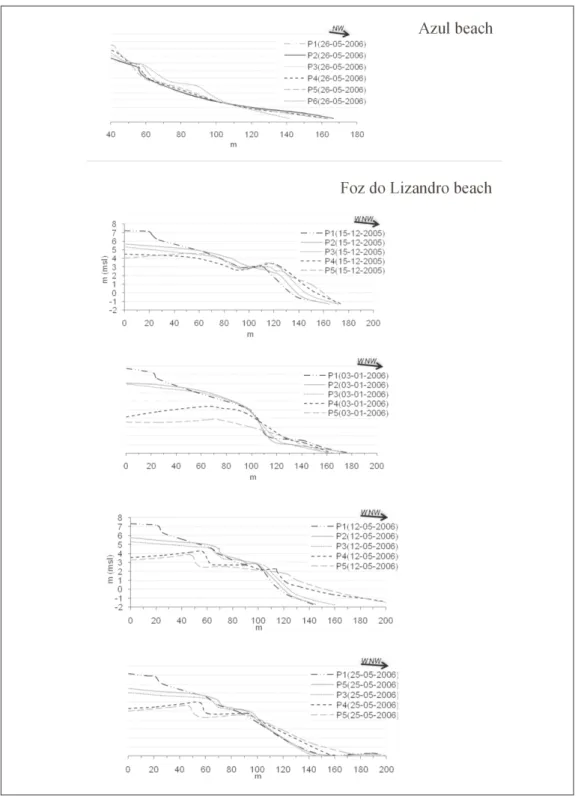
Azul beach morphology ranged from low tide terrace in pre-storm measurements to longshore bar-trough in January and trans-verse bar and rip in May, as a response to the respective storm events (Table 6). Field observations revealed a decrease in the number of bars from pre-storm to storm morphology. In December, the pre-storm submerged morphology included one bar indirectly observed through the number of consistent breaker lines present during low tide. This bar disappeared after January storm. A two bar system was also found in May pre-storm conditions. This bar system was reduced to one transversal bar after late May high wave event.
The existence of a barred system in May observations along with low values of ξb
(0,3373 – January storm; 0,1985 – May storm) indicate high dissipative behaviour of the submerged beach and was a major contribution to the lowest mean variability
of January (-101,497m/m3) and May
(89,769m/m3) sediment budgets (Table 4).
This fact doesn’t necessary mean a less dynamic system when compared to the other two beaches. Dimensionless fall velocity parameter values and it’s correspondent classification (Wright and Short, 1984) and the observed bar number along the four campaigns denote high morphological dynamics of the submerged beach profile.
Azul beach modal state of morpho-dynamic behaviour (low tide terrace) and limit conditions under storm influence (longshore bar-trough) can be assumed as being similar to Sta. Rita beach.
Unlike Sta. Rita and Azul beach, Foz do
Lizandro beach reached the fully dissipative morphodynamic behaviour in January storm event and the range of Ω values indicate the full spectrum of intermediate types are present (Table 6).
Table 6. Dimensionless fall velocity parameterization (Ω). D – dissipative; LBT – longshore bar-trough; RBB – rhythmic bar and beach; TBR – transverse bar and rip; LTT – low tide terrace.
At Foz do Lizandro, the high variability in morphodynamic states is consistent with the higher values of maximum sediment budget changes over the four campaigns
(1289,503m/m3 in January and
1523,128m/m3 in May, (Table 4). This
system is smaller and, unlike the other beach systems, beach morphology is conditioned not only by wave climate but also by direct river hydrodynamics during winter. The Lizandro river flows in the southernmost sector of the beach (Fig. 2) and in high water episodes can flood and erode the beach and the backshore profile. This combined fluvial and marine hydrodynamics probably explain the higher volume and parameter variability recorded in this system.
Because of this high variability in the beach profile it was not possible to charac-terize modal behaviour of Foz do Lizandro beach. More wave, morphologic and se-diment data is needed to fully understand this system dynamics.
6. Conclusion
Beach morphology dynamics depends, in the first place, on the variations of wave energy reaching the coast, namely during storms, and secondly on sediment availability to fulfill loss from high hydrodynamic events.
Parameterization of data collected with regular beach profile monitoring campaigns is a useful tool to predict and validate beach behaviour. The use of the surf similarity index (ξb) and the dimensionless fall
velocity (ξb) parameters allowed
diffe-rentiating between the three beach systems’ behaviour before and right after two high wave events that occurred in January and May 2006. Field data parameterization allowed establishing modal behaviour and limit response to high wave climate within
Wright and Short morphodynamic model. Sta. Rita and Azul beach have the same modal morphodynamic behaviour (low tide terrace) as well as the similar response limit to storm conditions (longshore bar-trough). Foz do Lizandro revealed no modal mor-phodynamic behaviour and reached fully dissipative conditions during January storm event.
The Ω parameter showed good predictive results when compared to the observed beach morphology.
Results reveal the high potential of beach monitoring programmes in the prediction of local system behaviours under high wave events and, therefore, in potential beach damage by storms.
References
ANFUSO, G. & BENAVENTE, J. (2006): Approximation to the classification and morphodynamic behaviour of the beaches between Chipiona and Rota (Cádiz, SW Spain); Ciencias Marinas, 32 (4), p. 605 – 616
BAPTISTA, P. (2006): O sistema de
posicionamento global aplicado ao estudo de litorais arenosos; Tese de Doutoramento, Universidade de Aveiro, 278 p.
BATTJES, J. (1974): Surf similarity;
Proceedings of the 14th International Conference on Coastal Engineering, ASCE,
p. 466 – 480
BENAVENTE, J., DEL RÍO, L., ANFUSO, G., GARCIA, F. & REYES, J. (2002): Utility of morphodynamic characterization in the prediction of beach damage by storms; Journal of Coastal
Research, SI36, ICS Proceedings, p. 56 – 64
BENEDET, L., FINKL, C. & KLEIN, A. (2004): Mophodynamic classification of beaches on the Atlantic coast of Florida: geographical variability of beach types,
Beach response to high energy wave climate...
beach safety and coastal hazards; Journal of
Coastal Research, SI39, Proceedings of the
8th International Coastal Symposium BENEDET, L., FINKL, C., CAMPBELL, T. & KLEIN, A. (2004): Predicting the effect of beach nourichment and cross-shore sediment variation on beach morphodynamic assessment; Coastal
Engineering, 51, p. 839 – 861
BETTENCOURT, P. & ÂNGELO, C. (1992): Faixa costeira Centro-Oeste (Espinho-Nazaré): Enquadramento geomor-fológico e evolução recente; Geonovas. A
Geologia e o ambiente, Número Especial 1,
Lisboa, p. 7 – 30
CARVALHO, F. (2004): Temporais no mar da região costeira de Portugal continental. in Alveirinho Dias, J. & Ferreira, Ó. Methods for determining and
representing coastal hazards; Universidade
do Algarve, p. 34 – 35
CARVALHO, M. (1992): Valores extremos de agitação marítima (Figueira da Foz). Tratamento local dos dados existentes;
Rel. 13/92 – A, PO-WAVES, IH – LNEC:
108 p.
COSTA, C. (1994): Wind wave climatology of the portuguese coast. Final report of sub-project A; Rel. 6/94 – A,
PO-WAVES, IH – LNEC, 79 p.
FERREIRA, Ó. (1998): Morfodinâmica de praias expostas: aplicação ao sector costeiro de Aveiro – Cabo Modego; Dissertação de Doutoramento, Universidade do Algarve, 337 p.
FRIEDMAN, G. (1962): On sorting, sorting coefficients, and the lognormality of the grain-size distribution of sandstones;
Journal of Geology, V. 70, p. 737 – 753
FRIEDMAN, G. & SANDERS, J. (1978): Principles of sedimentology; John Wiley & Sons. U.S.A., 792 p.
GOODFELLOW, B. & STEPHENSON, W. (2005): Beach morphodynamics in a strong-wind bay: a low-energy environment?
Marine Geology, 214, p. 101 – 116
HALLERMEIER, R. J. (1981a): Terminal settling velocity of commonly sand grains. Sedimentology, 28, p. 859 – 865
HALLERMEIER, R. J. (1981b): Fall
velocity of beach sands. Coastal Engineering
Technical Note, CETN-B-4, Coastal Engineering Research Center, U.S. Army Engineer Waterways Experiment Station, Vicksburg, 2 p.
HENRIQUES, R. (2004): SEDMAC/SEDPC: An application to support particle size analysis of unconsolidated sediments; 32nd
Interna-tional Geological Congress, Abs. Vol., pt. 1,
abs. 154-6, p. 726
KOMAR, P. (1998) – Beach processes
and sedimentation. Prentice Hall, 544 p.
KOMAR, P. & GAUGHAN, M. (1972): Airy wave theory and breaker height prediction; Proceedings of the 13rd
Conference on Coastal Engineering, ASCE,
p. 405 – 418
LARANGEIRO, S., OLIVEIRA, F. & FREIRE, P. (2002): Numerical characterization of the longshore sediment dynamics at Buarcos Beach, West coast of Portugal; Littoral 2002, The changing coast, EUROCOAST – EUCC, porto, p. 369 – 374
MASSELINK, G. & HEGGE, B. (1995): Morphodynamics of meso- and macrotidal beaches: examples from central Queensland, Australia; Marine Geology, 129, p. 1 – 23
MASSELINK, G. & HUGHES, M. (2003): Introduction to coastal processes
and geomorphology; Hodder Arnoldress,
354 p.
MUNK, W. (1949): The solitary wave theory and its applications to surf problems;
Annals of the New York Academy of Science,
nº 51 (3), p. 376 – 424
NEVES, M. (2004): Evolução actual dos
litorais rochosos da Estremadura Norte. Estudo de Geomorfologia; PhD Tese de
OLIVEIRA, I., VALLE, A. & MIRANDA, F. (1982): Littoral problems in the portuguese West coast; Coastal
Engineering Proceedings, vol. III, p. 1950 –
1969
OLIVEIRA PIRES, H (1989): Alguns aspectos do clima de agitação marítima de interesse para a navegação na costa de Portugal. O clima de Portugal; Fasc. XXXVII, vol 2, INMG, Lisboa, 34 p.
OLIVEIRA PIRES, H. & CARVALHO, F. (1996): Fundamento e características do
modelo de ondas de terceira geração MAR3G. Instituto de Meteorologia; Lisboa,
38 p.
PASSEGA, R. (1957): Texture as characteristic of clastic deposition; AAPG Bull. 41, p. 1952 – 1974
PEREIRA, A. R. (1987): Aspectos da evolução do relevo de Portugal. Litoral entre a serra de Sintra e a praia de S. Julião (Ericeira); Finisterra, XXII (44), p. 423-434
PEREIRA, A. R. (1991): A margem continental portuguesa. Breve síntese do conhecimento actual; Finisterra, 51, Lisboa, p. 149 – 185
PEREIRA, A. R. (1999): A importância do conhecimento do clima de agitação marítima na planificação de obras costeiras. O exemplo de Sines. in A. Ramos Pereira, César Andrade, Maria Conceição Freitas, Mário Neves, Jorge Trindade, Anabela Cruces e Ana Maria Viegas, Livro – Guia da
visita de estudo ao litoral entre S. André e Vila Nova de Milfontes; EUROCOAST
-Portugal
TABORDA, R. (1993): Modelação da
dinâmica sedimentary induzida pela
ondulação na plataforma continental portuguesa: Tese de Mestrado, Universidade de Lisboa, 126 p.
TABORDA, R. & DIAS, J. A. (1992): Análise da Sobreelevação do Mar de Origem Meteorológica durante os Temporais de Fevereiro/Março de 1978 e Dezembro de 1981. Geonovas, I, p. 89-97
TRINDADE, J., PEREIRA, A. R. & METROGOS, R. (2006): Aquisição de dados sobre a dinâmica de praias em diversas escalas temporais. Exemplos do litoral da Extremadura; Publicações da
Associação Portuguesa de Geomorfólogos,
Vol. III, p. 85 – 91.
TRINDADE, J., PEREIRA, A. R., NEVES, M., BORGES, B. & PAIXÃO, R. (2007): Monitorização da morfodinâmica de praias com dGPS e Estação Total. Comparação de resultados; Publicações da
Associação Portuguesa de Geomorfólogos,
Vol. V, p. 293 – 301.
VIDINHA, J., ANDRADE, C. & TEIXEIRA, S. (1997): Análise morfológica do cordão dunar entre Espinho e o Cabo Mondego (Portugal); In Colectânea de
ideias sobre a zona costeira de Portugal,
Associação EUROCOAST – Portugal, Porto, pp. 391 – 416.
WEISHAR, L. & BYRNE, R. (1978): Maximum breaker height; Journal of
Waterways, Harbours and Coastal Engineering Division, ASCE, nº 98, p. 529 –
548
WRIGHT, L. & SHORT, A. (1984): Morphodynamic variability of beaches and surf zones, a synthesis; Marine Geology, 56, p. 92 – 118.
Beach response to high energy wave climate...